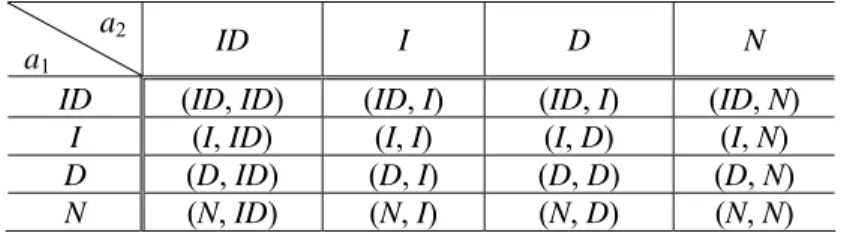
We present a spatial model of the metropolitan area in which two airports provide services for two types of air transport (international and domestic). This kind of award is observed in some cities, such as NYC, Paris, Seoul, Tokyo and Osaka. In contrast, in Amsterdam and Melbourne, airports closer to the CBD offer both domestic and international flights, while other airports only provide domestic flights. how the different types of operations change the allocation of services and affect economic welfare;. and how large is the welfare gain from regulating the service choice.
In our model, the role of the airport operator is to choose the type of service and the level of airport charge. Each location is identified by the coordinate value of x, where the origin of coordinates (x = 0) is in the center of the City. Furthermore, we assume that airport 2 is located on the edge of the City: that is, x2 = b.
Moreover, in these cases, the newly built airport is located on the outskirts of the city and suffers from a shortage of demand compared to capacity.
Airports
Each airline chooses the vector fSk =(f1Sk,f2Sk) to maximize the sum of the profits of two airports, i.e. Skj.
The Sequence of Decisions
Regime G: The government operates two airports. and case iii) corresponds to a situation where airport charges are regulated. Specifying some decision variables is useful not only for evaluating the effects of regulations, but also for separately investigating the effects of different decision variables. The analysis under ii) and iii) explains the effect of decentralized decision-making on the choice of prices or services.
The result for case i) is reported in Section 3, and Sections 4 and 5 discuss the allocations under the presence of regulations, i.e. the results of cases ii) and iii).
Variable Airport Charges and Service Choices
Decisions of Airport Operators under Alternative Regimes
Regime PP
At the Nash Equilibrium of the service selection game, the service chosen by operator j, a∗j( )PP , is the best response against the choice of the other operator i, ai∗( )PP. The first two terms in the RHS indicate the sum of the travel benefit and the operating cost, respectively. The last three terms are the total access cost, the scheduling cost, and the congestion cost.
Under the assignment (a1, a2), the rates at each airport j set by the government, rj*(a a G1, ;2 ), satisfy the following conditions:.
Allocations under Alternative Regimes
On the other hand, the difference is in the sum of income from two airports. I is concentrated at airport 2 under the allocation (D, ID), while ∆R2D is negative due to the reduction in the congestion at. The sum of these two terms, ∆R2 = ∆R2I + ∆R2D, is always positive because the increase in the income from service I, ∆R2I, dominates.
This difference leads to the different results in the allocations between two regimes, PP and M. This reduction in congestion causes service D service providers to reallocate flights between the two airports. S I .. 16), the three terms of the RHS respectively represent the changes in the scheduling cost, the travel benefit and the access cost16.
The first term of the RHS in Eq. 16), the change in planning costs, is always positive and it is constant for the location of airport 1, x1. 16 In addition to these three components, the consumer surplus of service I is affected by the change in price. However, since the change in fare affects service I airlines in the opposite direction, the effect of the change in fare is canceled out when comparing the social profit.
This reduction in congestion costs always increases the profits of service D carriers, and this increases as airport 1 moves closer to airport 2. These gains from users and operators are not taken into account in the private operator's decision-making. However, under regime M, the inefficiency in setting airport charges is dominant, making the social surplus lower than under regime PP.
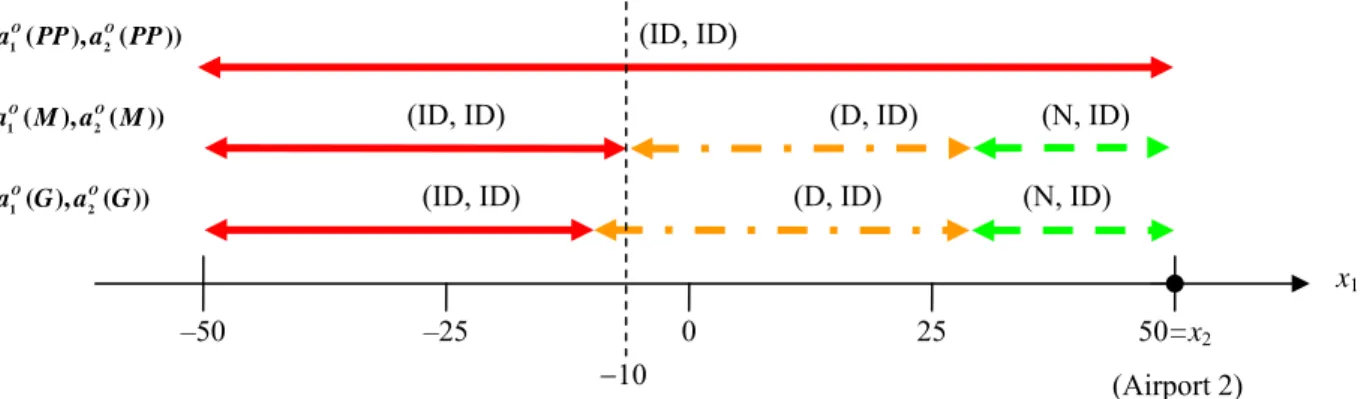
Surplus-Maximizing Allocation: Regulation of the Service Choice
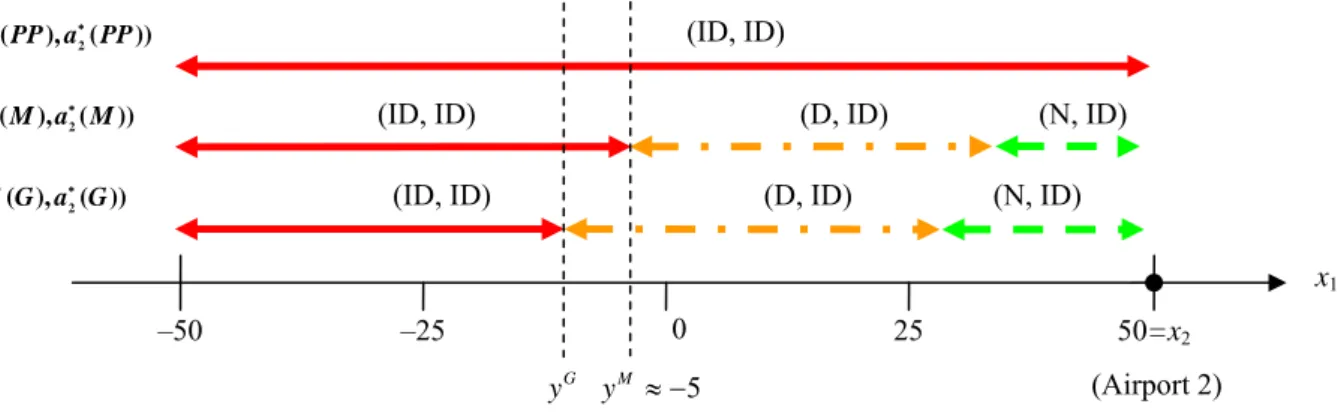
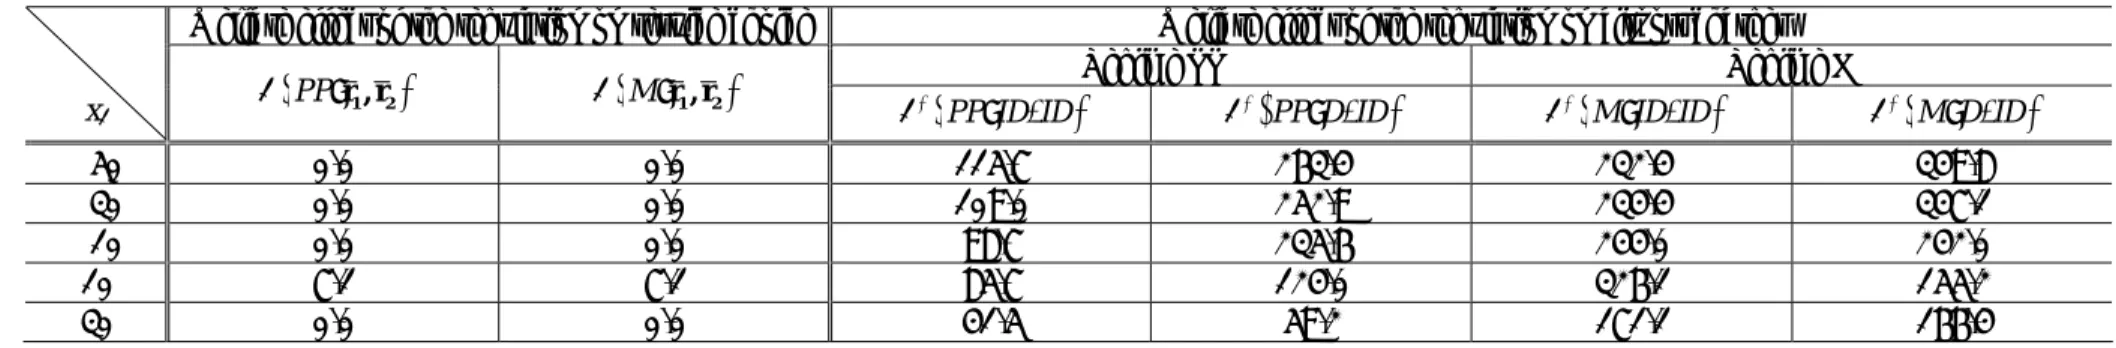
In Table 3, the government always sets negative airport tariffs to alleviate the distortion from the airlines' market power. In addition, the airport charges under Regime M are always the highest among three schemes because the monopolistic operator abuses its market power in setting the airport charges. Note that for x1 =0 and 25, the allocation of services under Regime M coincides with that under Regime G, which is different from Regime PP.
This suggests that the service choice under Regime M is more efficient than under Regime PP. Recall that both the allocation and the airport tax under regime G in section 3 are determined to maximize social profit. The profit-maximizing allocation under regime G becomes identical to the allocation under regime G in section 3.
Comparing Figure 3 with Figure 2, we notice that there is little difference in the results regarding the allocation of services. The results for regimes PP and G are the same as in section 2, while the result for regime M is different. The domain of (ID, ID) under Mode M in Figure 3 is smaller than that in Figure 2, while the domain of (N, ID) in Figure 3 is larger than that in Figure 2.
Note that the results shown in both figures are obtained by assuming variable airport costs;. If the allocation is therefore identical, the levels of airport charges and consequently the social surpluses must be the same in Figures 2 and 3. This implies that the service choices of private operators produce almost the same results as the surplus-maximizing allocation.
Parametric Airport Charges: Regulation of Pricing
Decisions of Airport Operators under Alternative Regimes
Regime PP
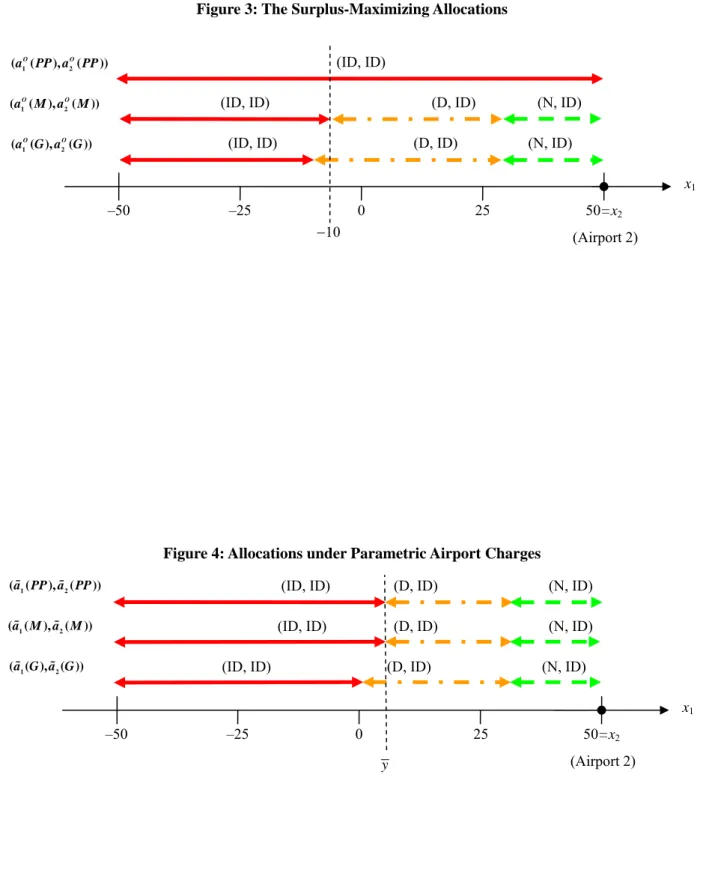
A single private firm operating two airports chooses the services provided at two airports, a1 and a2, in order to maximize the sum of revenues from the two airports, R(r , r1 2; , )a a1 2. These values are derived airport charges for I and D services at Kansai International Airport in Japan. In Figure 4, the domain of (ID, ID) is identical between two private operations, Regimes PP and M.
In fact, the operators' choices under these two schemes are different, but the carriers' choices are decisive for the allocation of services between airports19. The domain of (ID, ID) under Regime G is smaller than that under private operation (PP and M).
Comparison of Regulations of Service Choice and Airport Charges
In the previous three sections, we considered three situations in which the decision variables of the operators differ: ie. variable airport charges and service choices, surplus maximization allocation and parametric airport charges. In surplus-maximizing allocation, managers set airport charge levels, while service allocation maximizes social surplus. In the case of parametric airport charges, airport charge levels are given exogenously while operators choose the service provided at airports.
Therefore, by comparing the social surplus under the three alternative situations, we can estimate the welfare effect of the regulations. This shows that adjusting airport charge levels can have a significant impact on social surplus compared to adjusting service choice. Specifically, under parametric airport charges, allocations to private operation differ from those of regime G within the narrow range x1, implying that regulating service choice has a limited effect on improving social welfare22.
20 Instead of parametric airport charges, the airport charge set by the government, rj*( , ; )a a G1 2 , is the other candidate for the regulated level of airport charge. However, since rj*( , ; ) 0a a G1 2 < as shown in Table 3, it is not practical to assume that the government sets the negative airport charges as the regulated level. 21 In Table 4, the welfare effect of regulating airport charges is relatively large under Regime M compared to Regime PP, straight from Table 3.
This means that the monopolistic operator has greater market power in determining the level of airport charges, and there is no competition between the two airports. Under Regime M, the regulation of airport charges mitigates these inefficiencies and generates a greater welfare effect. As explained in Chapter 4, the difference between Figures 2 and 3 arises solely from the difference in service choice: that is, in Figure 2 operators freely choose the service offered at their airports, while in Figure 3 the service is determined by the government to maximize the social surplus.
Conclusion
"Airport Congestion When Carriers Have Market Power," The American Economic Review 92, pp. 2006): "Prices, Capacities, and Service Levels in a Congestible Bertrand Duopoly," Journal of Urban Economics 60, pp. "The Economics of Airport Congestion Prices," Journal of Urban Economics 55, pp. 2004): "Spatial competition of governments in the investment on public facilities,". Population density of the CityρC is calibrated so that the population of the City with the size of 100 square kilometers is equal to that of the Osaka Metropolitan Area.
In contrast, the population density of the hinterlandρH is the average population density of Japan. According to these values, we use the weighted average of access costs per kilometer for 50 cities as the value of t. The values of dI and dD, respectively, correspond to the average travel frequencies of international and domestic flights in Japan.
We set the number of routes for services I and D to three and six, respectively, to align the schedule costs for users close to realistic values. As Pels and Verhoef (2004) explained, the total delay cost for each airline is equal to 5% of its total operating cost. Therefore, 95% of the total operating costs correspond to the sum of the costs of providing international and domestic flights.
Using the financial data of JAL and ANA for 2004, we calculate the cost of providing each service S (S = I, D) according to the share of each service per revenue passenger kilometer so that their sum equals 95% of the total operating costs. Using the calculated total cost of providing each service, S, we set the average cost per flight for each service as the value of parameter ωS(S = I, D). To calibrate the value of parameter c, we set 5% of the total operating cost as the total delay cost.
The following table shows the calibrated number of passengers for each service at the two airports in the Osaka Metropolitan Area. Due to the asymmetry in congestion, the number of passengers for domestic flights at each airport differs from that in 2004.