From the Edge to the Center : Viscoelastic Migration of Particles and Cells in a Strongly Shear‑Thinning Liquid Flowing in a
Microchannel
Author Francesco Del Giudice, Shivani Sathish, Gaetano D Avino, Amy Q. Shen
journal or
publication title
Analytical Chemistry
volume 89
number 24
page range 13146‑13159
year 2017‑10‑30
Publisher American Chemical Society
Rights (C) 2017 American Chemical Society.
Author's flag publisher
URL http://id.nii.ac.jp/1394/00000329/
doi: info:doi/10.1021/acs.analchem.7b02450
ACS AuthorChoice (https://pubs.acs.org/page/policy/authorchoice̲termsofuse.html)
“ From the Edge to the Center ” : Viscoelastic Migration of Particles and Cells in a Strongly Shear-Thinning Liquid Flowing in a
Microchannel
Francesco Del Giudice,*
,†,¶Shivani Sathish,
†Gaetano D’Avino,
‡and Amy Q. Shen*
,††
Micro/Bio/Nano
fluidics Unit, Okinawa Institute of Science and Technology Graduate University, 1919-1 Tancha, Onna-son, Kunigami-gun, Okinawa 904-0495, Japan
‡
Dipartimento di Ingegneria Chimica, dei Materiali e della Produzione Industriale, Universita
́degli Studi di Napoli Federico II, Piazzale Tecchio 80, 80125 Naples, Italy
¶
Systems and Process Engineering Centre, College of Engineering, Swansea University, Fabian Way, Swansea SA1 8EN, U.K.
*
S Supporting InformationABSTRACT:
Controlling the fate of particles and cells in micro
fluidic devices is critical in many biomedical applications, such as particle and cell alignment and separation. Recently, viscoelastic polymer solutions have been successfully used to promote transversal migration of particles and cells toward
fixed positions in straight microchannels. When inertia is negligible, numerical simulations have shown that strongly shear-thinning polymer solutions (
fluids with a shear viscosity that decreases with increasing
flow rates) promote transversal migration of particles and cells toward the corners or toward the centerline in a straight microchannel with a square cross section, as a function of particle size, cell deformability, and channel height. However, no experimental evidence of such
shifting in the positions for particles or cells suspended in strongly shear-thinning liquids has been presented so far. In this work, we demonstrate that particle positions over the channel cross section can be shifted
“from the edge to the center
”in a strongly shear-thinning liquid. We investigate the viscoelasticity-induced migration of both rigid particles and living cells (Jurkat cells and NIH 3T3
fibroblasts) in an aqueous 0.8 wt % hyaluronic acid solution. The combined e
ffect of
fluid elasticity, shear-thinning, geometric con
finement, and cell deformability on the distribution of the particle/cell positions over the channel cross section is presented and discussed. In the same shear-thinning liquid, separation of 10 and 20
μm particles is also achieved in a straight microchannel with an abrupt expansion. Our results envisage further applications in viscoelasticity-based micro
fluidics, such as deformability-based cell separation and viscoelastic spacing of particles/cells.
I n the last decades, micro
fluidic platforms have been widely used to manipulate the trajectories of particles and living cells in channels with micrometer-size scale.
1−4Micro
fluidic operations such as sorting, analysis, and detection require a precise control of the
flowing particle trajectories. For instance,the size and the variance of a population of cells can be determined more accurately when such cells are aligned along the centerline of a micro
fluidic channel.
5For biomedical applications, separation of healthy cells from unhealthy cells (such as circulating tumor cells) can be accomplished in an ad hoc micro
fluidic device based on the deformability di
fference between healthy and unhealthy cells.
6Several techniques have been proposed to manipulate the trajectories of particles suspended in a
fluid. Many of them rely on the use of external forces generated, for instance, by electric,
7magnetic,
8or acoustic
9fields. The resulting platformsare, however, sometimes bulky, and require
fine-tuning of the
field strength. Furthermore, particles or cells need to be
functionalized to be responsive to the external
field before each experiment, thus limiting rapid healthcare applications.
An alternative way to manipulate the trajectories of the
flowing particles is through forces intrinsic to the suspending
fluid. For instance, particles suspended in water and
flowing in a microchannel migrate transversally to the
flow direction ifinertial forces become relevant.
10−13The so-called inertial micro
fluidics have been successfully used for the alignment
14and separation
15of cells, avoiding any preliminary cell treatment. However, inertial e
ffects may become weak with submicrometer-sized particles, small channel dimensions, and/
or small
flow rates.
16Recently, particle and cell manipulation has been successfully achieved in simple straight microchannels by replacing the
Received: June 23, 2017 Accepted: October 30, 2017 Published: October 30, 2017
Article pubs.acs.org/ac copying and redistribution of the article or any adaptations for non-commercial purposes.
suspending liquid from pure water to dilute aqueous polymer solutions.
16−18The
flow
field developed in the channel leads to deformation of the polymer chains, resulting in a net elastic force that pushes the particles toward the channel centerline or the walls, depending on the elastic properties, i.e., the rheology of the polymer solution, and on the volumetric
flow rate.
16,17Most of the works available in the literature have considered elastic
fluids with a near-constant viscosity. In this case,
fluid elasticity drives the particles and cells toward the channel centerline achieving the so-called particle
19−22or cell
23,24focusing.
The literature dealing with particle manipulation in elastic
fluids with a nonconstant viscosity is scarce. The degree of shear-thinning
fluids is commonly quanti
fied by the
flow index parameter
n.25With reference to the simple shear
flow case, the shear-thinning region of the viscosity
ηcan be related to the shear rate
γ̇through a power-law model
η∝γ̇n−1, with 0 <
n≤1. For a constant-viscosity
fluid the
flow index is
n= 1. Lindner et al.
26proposed to classify the
fluid as weakly or strongly shear-thinning if
n≥0.65 or
n< 0.65, respectively. Lim et al.
27used an aqueous hyaluronic acid (HA) solution at 0.1 wt % (n
≈
0.9) to align rigid particles and white blood cells on the centerline of a rectangular micro
fluidic channel by coupling elastic and inertial effects. Nam et al.
28used the same 0.1 wt % HA solution to align and separate human breast carcinoma and leukocyte cells in a straight micro
fluidic channel. Liu et al.
29reported that particles, cells, and bacteria suspended in a 0.2 wt % PEO solution (n
≈0.8) attained di
fferent equilibrium positions depending on their size and the aspect ratio of the channel, allowing easy separation. In square-shaped geometry, they found that 5
μm particles migrated toward the channel centerline, while 15
μm particles were o
ff-centered with respect to the centerline. Very recently, Yuan et al.
30used a 0.1 wt % poly(ethylene oxide) (PEO) aqueous solution (n
≈0.9) to align and separate Jurkat and Yeast cells. Seo et al.
31employed a holographic microscopy technique to study the transversal migration of rigid particles suspended in a 1 wt % PEO aqueous solution (n
≈0.65). They found that the shear-thinning property promoted the depletion of some rigid particles from the centerline, leading some particles to migrate toward the centerline and others toward the vicinity of the walls. Del Giudice et al.
32used an aqueous PEO solution at 1.6 wt % (n = 0.5) and observed the presence of 10
μm particles in the four corners of a straight square-shaped micro
fluidic channel with a channel height
H= 100
μm, in agreement with numericalsimulations.
33While elastic near-constant-viscosity liquids are expected to promote particle migration toward the channel centerline only, numerical simulations showed that strongly shear-thinning liquids promoted transversal migration of rigid particles and cells either toward the corners or toward the centerline of a square-shaped microchannel as a function of the particle diameter, cell deformability, channel size, and volumetric
flow rate, without changing the suspending liquid.
33,34However, no experimental evidence of such shifting in the equilibrium positions for particles and cells in strongly shear-thinning liquids, with negligible inertia, has been reported. Needless to say, a detailed investigation on the transversal migration of particles and cells in shear-thinning liquids would provide a deeper understanding of the e
ffect of
fluid rheology on the transversal migration of particles and cells. Moreover, shear- thinning liquids are expected to be more bene
ficial for delicate cells (such as neuron cells
35) as compared to near constant-
viscosity liquids. The velocity pro
file around the centerline of a straight micro
fluidic channel is
flat (Figure 3), leading to smaller stresses on the cell surface as compared to the near constant-viscosity case, at the same volumetric
flow rate.
Furthermore, the viscosity thinning at high
flow rates reduces the pressure drop required to pump the suspension through the micro
fluidic channel, reducing risks connected to high-pressure- induced device failure.
In this work, we demonstrate that positions of particles over the channel cross section can be shifted
“from the edge to the center
”in a strongly shear-thinning liquid
flowing in a straight square-shaped microchannel, when inertia is negligible. We use polystyrene particles with four di
fferent diameters and two types of cells, namely Jurkat cells and NIH 3T3
fibroblasts with di
fferent deformabilities. The suspending liquid is an aqueous solution of hyaluronic acid at 0.8 wt % with a
flow index
n= 0.35. Optical microscopy techniques and numerical simulations are used to measure the position of the
flowing particles on the channel cross section at a
fixed distance from the channel inlet.
The e
ffect of
flow rate, particle size, and deformability on the equilibrium positions attained by the particles and cells is presented and discussed. The present results are also compared with experimental and numerical observations available in the literature for near-constant viscosity as well as weakly and strongly shear-thinning elastic
fluids. Finally, separation of 10 and 20
μm particles in HA 0.8 wt % is achieved in a straight microchannel with an abrupt expansion.
■
THEORETICAL BACKGROUNDDimensionless Parameters.
The interplay among di
ffer- ent migration mechanisms can be studied by comparing the relevant transversal forces acting on particles and cells.
Unfortunately, while an expression for the deformability- induced force is known,
23an explicit expression for the migration force induced by a viscoelastic suspending
fluid with shear-thinning features is not available. In this regard, it is worthwhile noting that the expressions of the viscoelastic force descriptions commonly used in the literature
17depend on the Deborah number and the con
finement ratio only, but this is valid only for constant-viscosity
fluids at small Deborah numbers. These conditions are not met in our experiments.
A similar expression for a general viscoelastic
fluid with shear- thinning features is di
fficult to derive, as it needs to be valid for nonvanishing Deborah numbers (when shear-thinning e
ffects start to become relevant), likely leading to complex and nonlinear dependences on the relevant dimensionless param- eters. Alternatively, numerical simulations
33,36can be employed to examine the particle migration behavior by elucidating the interplay among di
fferent migration mechanisms through dimensionless numbers, highlighting the importance of relevant forces.
Fluid viscoelasticity can be quanti
fied by the Deborah number
De. For square-shaped channel geometries, Deis de
fined as
= λ De Q
H3 (1)
The Deborah number is the ratio between the
fluid characteristic time
λ(generally the longest relaxation time) and the
flow characteristic time
H3/Q, where
His the channel height, and
Qis the volumetric
flow rate. For a Newtonian
fluid (zero elasticity), the Deborah number is
De= 0, while larger
Decorresponds to more pronounced elasticity present in the
fluid.
Analytical Chemistry
Another important dimensionless number is the Reynolds number
ρ
= η Re Q
H (2)
where
ρis the density, and
ηthe shear viscosity of the liquid.
Rerepresents the ratio between inertial and viscous forces. The highest Reynolds number for the system considered in this work is
6(10 )−3, thus inertial e
ffects are insigni
ficant.
To quantify the particle deformability, we use the elastic capillary number
= η
Ca Q
el GH3 (3)
where
Gis the storage modulus of the object.
Caelis the ratio between the viscous force from the suspending liquid and the elastic force from the deformable object. For a rigid particle, the elastic capillary number is
Cael= 0.
The con
finement ratio is de
fined as
β= dH (4)
the ratio between the particle or cell diameter
dand the channel height
H.Forces Acting on Particles and Cells Suspended in Shear-Thinning Liquids.
For particles and cells suspended in a near constant-viscosity liquid, the direction of the transversal migration does not depend on the Deborah number
De16,17,19,34(or on the
flow rate
Q). In shear-thinning liquids,33instead, the migration direction is strongly dependent on
De(Figure 1). Villone et al.
33reported the existence of a neutral
plane along the channel cross section, which identi
fies the basin of attraction for rigid particles. A rigid particle initially positioned (i.e., at the channel inlet) within the neutral plane migrates toward the channel centerline as the elastic force within the neutral plane is directed toward the centerline. On the other hand, a rigid particle with its center of gravity outside the neutral plane migrates toward the channel corners (Figure 1). The size of the neutral plane is strongly a
ffected by the Deborah number
De. Increasing the Deborah number leads to amodi
fication of the velocity pro
file in the microchannel, a
ffecting, in turn, the direction of the viscoelastic force.
Speci
fically, higher
De-values reduce the area of the neutralplane, reducing the fraction of particles focused on the centerline as well (Figure1b). Hence, most of the particles are attracted toward the centerline at low Deborah numbers and toward the corners at high Deborah numbers. Notice that a quanti
fication of
“low
”and
“high
”Deborah number depends on the rheology of the
fluid under investigation and on the con
finement ratio
β. To the best of our knowledge, no general criterion has been presented so far to quantitatively discriminate between
“low
”and
“high
”Deborah numbers.
Very recently, Li et al.
37have proposed a similar model for particles suspended in a weakly shear-thinning hyaluronic acid solution. The proposed model was based on decomposing the elastic force in a component directed toward the wall and another directed toward the centerline.
For deformable objects (such as cells) suspended in shear- thinning liquids, a deformability-induced force directed toward the channel centerline
23(Figure 1c,d) a
ffects the transversal migration. In this case, the position of the neutral plane depends on the mutual strength of viscoelastic and deform- ability-induced force, quanti
fied through the Deborah number
Deand the elastic capillary number
Cael, respectively. Similar to rigid objects, deformable particles entering the channel at a position within the neutral plane migrate toward the centerline, while those outside the neutral plane migrate toward the corners (Figure 1c,d). Unfortunately, a general theory on the coupled e
ffect of these forces on the migration is not available.
Numerical simulations of Villone et al.
36reported only a few representative cases, which are compared with our experimental observations (Transveral Migration of Cells).
The values of the dimensionless numbers for the experiments carried out in this work are listed in Table 1.
■
MATERIALS AND METHODSFluid Rheology.
The suspending liquid used in this work is a 0.8 wt % aqueous solution of hyaluronic acid (HA) (molecular weight
Mw= 1.6 MDa, Sigma-Aldrich, Japan). HA is a polyelectrolyte, i.e., a polymer with free charges on the chain. Because of electrostatic repulsion, free charges cause the swelling of the polymer (large hydrodynamic radius),
38,39enhancing shear-thinning properties. HA is usually used in combination with phosphate bu
ffer saline (PBS) to promote cell viability during and after biological experiments.
27However, PBS contains 138 mM of NaCl, and Na
+ions in solution screen free charges on polyelectrolyte chains, causing polymer shrinking, leading to a decrease in both shear-thinning properties and elasticity
40(see also Figure S1). Thus, for this work, PBS is not added to the HA to preserve both shear- thinning and elastic properties.
Rheological measurements were carried out on a stress controlled rheometer (Anton Paar MCR 502) with a cone and plate geometry (50 mm of diameter, 1
°angle). Solvent trap was
Figure 1. Rigid particles and deformable objects migrate towarddifferent positions depending on flow conditions. Schematic of the forces acting on rigid particles and deformable objects, depending on the Deborah numberDe=λQ/H3, whereλis thefluid relaxation time, Qis the volumetricflow rate, andHis the channel height. The red dashed line is the so-called neutral plane.33,36If the initial position (i.e., at the channel inlet) of the object along the cross section is within the neutral plane, it migrates toward the centerline; otherwise the object migrates toward the corners. (a) Rigid particles at lowDe. (b) Rigid particles at highDe. (c) Deformable objects at lowDe. (d) Deformable objects at highDe.
Analytical Chemistry
used to avoid
fluid evaporation. The shear viscosity
ηof HA 0.8 wt % is constant in the range of shear rate 10
−2<
γ̇< 1
s−1(black triangles in Figure 2a). A clear shear-thinning region is identi
fied for
γ̇> 1
s−1, with a slope of
−0.65 corresponding to a
Table 1. Values of the Dimensionless Numbers Corresponding to the Experiments Performed in This Workaβ=d/H Q[μL/min] De=λQ/H3 Re=ρQ/(ηH) Cael=ηQ/(GH3)
rigid particles
polystyrene 0.06 <β< 0.2 0.1 0.92 4.3×10⁻⁶ 0
0.25 2.3 1.5×10⁻⁵ 0
0.5 4.6 4.2×10⁻⁵ 0
1 9.2 1.2×10⁻⁴ 0
2 18 3.7×10⁻⁴ 0
4 37 1.1×10⁻³ 0
8 74 3.6×10⁻³ 0
cells
Jurkat β= 0.14±0.02 0.1 0.92 4.3×10⁻⁶ 0.13
0.25 2.3 1.5×10⁻⁵ 0.24
0.5 4.6 4.2×10⁻⁵ 0.35
1 9.2 1.2×10⁻⁴ 0.48
2 18 3.7×10⁻⁴ 0.62
4 37 1.1×10⁻³ 0.81
8 74 3.6×10⁻³ 1.0
NIH 3T3 β= 0.24±0.05 0.1 0.92 4.3×10⁻⁶ 3.4×10⁻⁴
0.25 2.3 1.5×10⁻⁵ 5.7×10⁻⁴
0.5 4.6 4.2×10⁻⁵ 8.3×10⁻⁴
1 9.2 1.2×10⁻⁴ 1.1×10⁻³
2 18 3.7×10⁻⁴ 1.5×10⁻³
4 37 1.1×10⁻³ 1.9×10⁻³
8 74 3.6×10⁻³ 2.5×10⁻³
aThefluid properties are evaluated without particles/cells. Note that, for a shear-thinningfluid, the shear viscosityηchanges with theflow rate. The viscosity used in the dimensionless numbers has been evaluated at the average shear rate over the channel cross section,γ̇=Q/H3.
Figure 2.Hyaluronic acid 0.8 wt % solution is strongly shear-thinning and strongly elastic. (a) Shear viscosityηas a function of the shear rateγ̇for aqueous HA 0.8 wt % without addition of cell culture medium (black triangles) and with addition of 10 vol % of cell culture medium (red squares).
Cell culture medium does not significantly affect the rheology of thefluid (see discussion inPreparation of Cell and Particle Suspensions) Referring to black triangles, a clear shear-thinning region is identified forγ̇> 1 s−1, with aflow index ofn= 0.35 (strongly shear-thinning liquid). (b) Elastic modulusG′and the viscous modulusG″as a function of the angular frequencyωfor thefluid without cell culture medium. Solid and dashed lines are the theoretical slopes forω→0,25that is, the terminal region of a viscoelastic liquid. Viability and diameter of cells do not change significantly within 90 min. (c) Cell viability as a function of time for NIH 3T3 (black bars) and Jurkat (blue bars) suspended in HA 0.8 wt %. (d) Cell diameter as a function of time for NIH 3T3 and Jurkat suspended in HA 0.8 wt % (black and blue bars, respectively) and in cell medium (dashed black and dashed blue, for NIH 3T3 and Jurkat cells, respectively). Error bars are evaluated from three independent experiments for each condition.
Analytical Chemistry
fl
ow index
n= 0.35, i.e., a strongly shear-thinning liquid.
Viscoelastic properties of the HA solution are determined by measuring the elastic modulus
G′and the viscous modulus
G″as a function of the angular frequency
ω(Figure 2b). HA 0.8 wt % shows strong elastic properties, with
G′<
G″when
ω<
30 rad/s. Solid and dashed lines are the theoretical slopes of
G′and
G″when
ω →0,
25that is, the terminal region of a viscoelastic liquid. The intersection of these lines gives an estimate
25of the longest relaxation time
λ≈400 ms. However, since the terminal region is not clearly identi
fied for
G′, we estimated
λ≈480 ms by
fitting the viscosity curve of Figure 2a with the Carreau model. The Carreau model
25describes inelastic
fluids with
flow-dependent viscosity
η η η η
= + λγ− + ̇
∞
∞
[(1 ( ) ]−n 0
2 1 /2
(5)
where
η0is the zero-shear viscosity,
η∞is the plateau viscosity at in
finite shear (in our case it is zero),
λis the relaxation time,
nis the
flow index . The value
λ= 480 ms is used for the determination of the Deborah number
Dein the subsequent studies (see Theoretical Background for the de
finition).
Preparation and Characterization of the Samples.
In this work, rigid polystyrene particles with four di
fferent diameters and two cell types are used for the transversal migration studies.
Cell Culture.
BCL2 (S70A) Jurkat (ATCC CRL-2900) cells are seeded at moderate densities (approximately 7
×10
5cells per
flask) in standard 25 cm
2Corning cell culture
flasks (Sigma- Aldrich, Japan). Jurkat cells are cultured in 5 mL of RPMI-1640 (Roswell Park Memorial Institute-1640) culture medium supplemented with 10% fetal bovine serum (both from Thermo Fisher Scienti
fic, Japan) and 200
μg/mL G418 Geneticin (Nacalai Tesque, Inc., Japan) until cells are con
fluent.
NIH 3T3 (ATCC CRL-1658)
fibroblast cells are cultured in a culture medium prepared by reconstituting DMEM (Modi
fied Basal Eagle culture medium) powder (Thermo Fisher Scienti
fic, Japan) in Milli-Q water (Millipore, Japan), which is supplemented with 10% calf serum (Thermo Fisher Scienti
fic, Japan), 3.7 g/L sodium bicarbonate, and 200
μg/mL G418 Geneticin (both from Nacalai Tesque, Inc., Japan). The
fibroblast cells are seeded at moderate densities (approximately 7
×10
5cells per
flask) in standard 25 cm
2Corning cell culture
flasks and cultured in 5 mL of the prepared and
filtered DMEM culture medium until cells become con
fluent. Both cell types are cultured at 37
°C in 5% CO
2in a biosafety hood.
Cell Characterizations.
Although the absence of PBS in HA 0.8 wt % preserves elastic and shear-thinning properties, it could result in a decrease in cell viability (lack of physiological conditions). Hence, we evaluate the viability of both Jurkat and NIH 3T3 cells in aqueous HA 0.8 wt % and without PBS, over 90 min (Figure 2c). The viability of both cell types suspended in culture medium and PBS are measured to serve as control experiments (Figure S2). Cells suspended in HA 0.8 wt % are
first stained with Muse Count & Viability Reagent (1:10 dilution) for 5 min at room temperature, after which the viability is quanti
fied through the
flow cytometer Muse Cell Analyzer (Millipore, Japan). Cell viability for both cell types in HA 0.8 wt % does not change signi
ficantly within 90 min, being
∼
38
±5% for Jurkat and
∼53
±7% for NIH 3T3.
As low cell viability could a
ffect cell size,
41we evaluate the diameter of both cell types over time (Figure 2d). The average cell diameter is determined from phase contrast microscopy images (Figure S3) through an Olympus CKX41 phase-
contrast inverted microscope with a 10
×objective and equipped with a DP27-A camera system. The combination of lens and camera gives a resolution of
∼1.85 pixel/μm. Thediameter of both Jurkat and NIH 3T3 suspended in HA 0.8 wt % does not change within 90 min (100 cells analyzed for each condition). Average diameters (over time) are
d= 14
±2
μm for Jurkat and
d= 24
±5
μm for NIH 3T3
fibroblasts, suspended in HA 0.8 wt %. Notice also that cells suspended in HA 0.8 wt % are bigger than those suspended in the cell medium, being
d= 12
±1
μm for Jurkat andd= 16
±2
μm forNIH 3T3 (see additional Figure S3 for microscopy images).
Cell sti
ffness is quanti
fied through the elastic modulus
G.Rosenbluth et al.
42measured the storage modulus of Jurkat cells
G= 0.05
±0.035 kPa using atomic force microscopy. For NIH 3T3, Bausch et al.
43determined the storage modulus 20 <
G
< 40 kPa using magnetic tweezers. In our analysis, we use
G= 20 kPa for NIH 3T3 to evaluate the elastic capillary number
Cael(see Theoretical Background for the de
finition).
Preparation of Cell and Particle Suspensions.
Jurkat cells cultured in the cell culture
flasks are counted by standard cell counting procedures using a hemocytometer (Bright-Line, U.S.A.). An appropriate volume of the cell suspension containing 6
×10
5cells is extracted from the
flasks and centrifuged at 130g for 5 min to separate the cells from the culture medium. The supernatant is removed, and the cell pellet is resuspended in 50
μL of cell culture medium, added into 500
μL of 0.8 wt % hyaluronic acid solution, and gently mixed to avoid bubbles and cell breakage.
NIH 3T3 cells are adherent cells and grow while being attached to the substrate of the cell culture
flasks. As a result, the collection of cells for the preparation of the suspensions requires a further step. Cells are
first washed three times with 1
×
PBS (phosphate bu
ffer saline) and then incubated with 0.5%
trypsin
−EDTA mixture (Nacalai Tesque, Inc., Japan) to dissociate the cells from the substrate. An appropriate volume containing 6
×10
5cells is extracted from this mixture after counting by standard cell counting procedures using a hemocytometer. This volume is then centrifuged at 130g for 5 min, after which the supernatant is removed. The cell pellet is resuspended in 50
μL of cell culture medium, added into 500
μL of 0.8 wt % hyaluronic acid, and gently mixed to avoid bubbles and cell breakage.
The addition of 50
μL of cell culture medium introduces both salts and water in 500
μL of 0.8 wt % hyaluronic acid, thus possibly affecting the rheology of the resulting liquid. We then compare the viscosity curve for the liquid with and without cell culture medium (Figure 2a). The slope of the viscosity in the shear-thinning region is preserved and only the shear viscosity
ηdecreases by a factor of 2. Since cell culture medium does not a
ffect signi
ficantly the rheology of the
fluid, dimensionless numbers presented below are derived by considering the rheology of the
fluid without cell culture medium. Note thattransversal migration of particles is studied in HA solution without cell culture medium.
Four sets of polystyrene (PS) rigid particles (Polyscience) with diameter
d= 6, 10, 15, and 20
μm are added directly to the HA 0.8 wt % at a volume fraction
ϕ= 0.01 vol %. The suspension is then put in a vortex mixer to guarantee dispersion and is centrifuged for a couple of seconds to remove air bubbles.
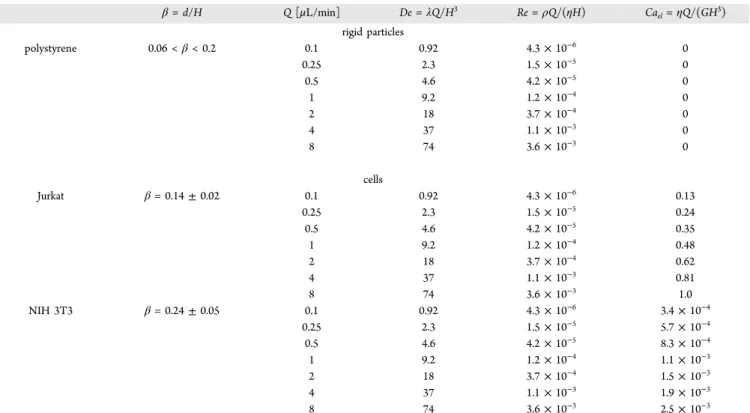
Experiments.
A straight square-shaped glass microchannel
(Vitrocom, U.S.A.) with channel side
H= 100
μm is glued into
a silicon tube, directly connected to the needle of the syringe
Analytical Chemistry(Figure 3a). The glass channel has advantages over polydimethylsiloxane (PDMS) devices because of its rigidity.
Del Giudice et al.
44showed that the transversal migration of rigid particles suspended in an aqueous poly(ethylene oxide) solution 1.6 wt % (shear-thinning,
n= 0.5) di
ffers when the channels are made of PDMS or poly(methyl methacrylate).
The authors argued that softer walls (PDMS) alter the dynamics of transversal migration.
The separation experiments of Separation of 10 and 20
μm Particles are carried out in a square-shaped cross section channel made of rigid
44poly(methyl methacrylate) (PMMA, substrate thickness 1 mm, Kuraray Co. Japan) using a micromilling machine
45(Minitech CNC Mini-Mill). A 2 mm tip is
first used to mill all the substrate to 300
μm to guarantee level uniformity. A 100
μm tip is used to mill the main channel, while the abrupt expansion is milled with a 1 mm tip (see Figure 8a for the schematic of the device). The channel depth is uniform and equal to 100
μm. Finally, two holes are made in the substrate to prepare the access to the inlet and the outlet of the channel. The channel is bonded on another PMMA substrate by immersing the two pieces in absolute ethanol (Sigma-Aldrich) for about 20 min. The two PMMA pieces are
then put on a hot press (Imoto IMC-180C, Japan) with plate temperature
T= 40
°and pressure
P= 0.7 MPa for about 20 min.
The
fluid is pumped through the glass channel at an imposed volumetric
flow rate
Qusing a high precision Harvard PHD- Ultra syringe pump. We used Hamilton gastight glass syringes to avoid wall deformation from a
ffecting the rate of
fluid delivery into the microchannel.
The alignment of particles in the microchannel is observed through an inverted microscope (Leica DMIRB) with a 63
×Leica air objective and a numerical aperture of 0.7. Images are captured at
Lz= 7.5 cm from the entrance of the microchannel (the total length of the channel is
L= 10 cm) using a high speed camera (Phantom Miro M310, Vision Research), at frame rates ranging between 30 and 800 frames per second (fps). Flow stabilization is achieved after
∼15 min. To explore the whole range of the Deborah number 0.92 <
De< 74, experiments with Jurkat and NIH 3T3 cells are carried out in two time intervals, each one no longer than 90 min (cell viability and size do not change within 90 min as discussed in Preparation and Characterization of the Samples). Notice also
Figure 3.Glass capillary is glued to a silicon tube. (a) Schematic of the experimental apparatus. The square-shaped channel with heightH= 100μm is glued to a silicon tube and then connected directly to the syringe. Velocity profile of shear-thinningfluid is flat around the centerline. (b) Schematic of cells that migrated toward the centerline and the walls as a result of viscoelastic forces. The origin of the Cartesian reference frame is located at the center of the cross section (see also panel (e)). The cross section is identified by the (X,Y) coordinates andZdenotes the mainflow direction. In this panel, the velocityfield on theX-axis of a constant-viscosityfluid (black line) and of HA 0.8 wt % (red dashed line) are shown.Around the centerline, the velocity profile of the HA 0.8 wt % isflatter than that observed for the constant-viscosity elasticfluid. Velocity profiles are both evaluated atQ= 0.5μL/min (De= 4.6). Cells appear blurred when the lens is outside the focal plane of the cells. (c) Schematic representation explaining the derivation ofY-coordinate of the particles/cells. High magnification lens 63×with a numerical aperture of 0.7 allows distinction between different channel layers alongY(I, II,III). When cells areflowing on the centerline (position III in the side view), if the lens is in focus with the layers I or II, theflowing cells will appear blurred. If the lens is in focus with the layer III, theflowing cells appear optically focused. When the lens is in focus with a given plane, all cells that appear in focus belong to that layer. (d) Top view images are experiments on Jurkat cells atDe= 4.6, where focal planes are set at 50μm (I), 20μm (II), and 0μm (III) from the center. Position of each layer gives the value ofY. Red scale bar is 50 μm. Square cross section is divided in several bands. (e) Each quadrant of the channel cross section is divided in 4×4 equally sized square subregionsk. The green region denotes the zone of the section inaccessible to the particle center. The side length of the bandskdepends on the particle diameter and is equal toΔLb= (H/2−d/2)/4.
Analytical Chemistry
that cell viability, cell size, and cell migration experiments are carried out within the same day, using the same stock solution.
All the experiments are carried out at room temperature
T= 25
±1
°C.
Determination of Particle and Cell Distribution along the Channel Cross Section.
The strongly shear-thinning nature of HA 0.8 wt % solution makes the evaluation of particle positions difficult. Indeed, previous approaches were based on the evaluation of the o
ff-center distance of the object only
20,22(i.e., the
X-coordinate inFigure 3), or through the comparison between the particle velocities evaluated through particle tracking experiments and numerical simulations
21to acquire the position of particles or cells on the channel cross section (i.e., both
X- andY-coordinates inFigure 3). Unfortunately, the second approach is not reliable for a strongly shear-thinning
fluid such as the one used in the present work. Indeed, this technique evaluates the velocity
field
v(X,Y) over the channelsection through numerical simulations and assumes that the velocity of a particle
vp, evaluated through particle tracking, is equal to the
fluid velocity at the particle center. Hence, the
X-coordinate is directly measured though microscopy, and the
Y-coordinate is obtained by solving the equation
vp=
v(X, Y),where
vpis the particle velocity measured through particle tracking experimentally, and
v(X,Y) is the velocity profile of the
fluid evaluated through numerical simulations.
21,32However, the equation
vp=
v(X,Y) is valid only when the particles arelocated around the centerline,
46and the confinement ratio
β=
d/H ⩽0.1. As shown below, neither of the conditions are satis
fied for the system under investigation here. Furthermore, the velocity pro
file for a strongly shear-thinning
fluid is signi
ficantly
flatter around the channel centerline as compared to that of a
fluid with a constant viscosity (compare black solid line with red dashed line in Figure 3b). Thus, the velocities of particles around the channel centerline are very similar, making it hard to distinguish
X-positions.Here, we employ a di
fferent methodology to derive the positions of particles and cells during
flow. We use a high magni
fication lens (Leica 63
×, aperture of 0.7) with an estimated depth of
field of
∼2
μm. When the lens is set on a given focal plane (at a
fixed
Yin our case), any object in the range of
±1μm alongYis in focus, while all the other objects located on di
fferent focal planes appear to be blurred (middle panel of Figure 3c). We then focus the lens on di
fferent focal planes with an increment of 10
μm (layers separated by dashed lines in the left panel of Figure 3c). Any object in focus in a given focal plane belongs to that focal plane, thus univocally identifying
Y. For instance, if particles or cells are flowing on the centerline, and the focal plane of the lens is 50
μm (image I in Figure 3d) or 20
μm (image II in Figure 3d) far from the centerline, particles or cells appear to be blurred. If, instead, the focal plane of the lens is set on the centerline (image III in Figure 3d), particles or cells appear optically in focus.
Once the particle positions (X,
Y) have been experimentallymeasured, the particle distribution along the channel cross section can be reconstructed. Following previous works,
21,47we de
fine the fraction of particles
fkcrossing a certain region
kof the channel section at a distance
Lzfrom the inlet as
=
∑
̅ ̅
f Lk( )z
n L A v k
n L A v ( )
( )
k z k k k z
k k (6)
where
nk(L
z) is the number of particles
flowing in the band
k,and
Akand
v̅kare the cross-sectional area and the average velocity of the band
k(
fluid without particles), respectively.
Here
Lzis kept as a constant at
Lz= 7.5 cm.
We then divide the channel cross section in square subregions (Figure 3e). With reference to the upper-left quadrant, we split the accessible length of both sides of the cross section in four equal segments that form the boundaries of the 4
×4 bands. The side length of the bands depends on the particle radius and is equal to
ΔLb= (H/2
− d/2)/4.Notice that, with such a subdivision, the areas
Akin eq 6 are equal for any individual band. The average velocities
v̅khave been calculated from the velocity
field of the
fluid without particles through
finite element simulations.
32Here, the
fluid is modeled by the Carreau constitutive equation
48with parameters obtained by
fitting the viscosity curve (Figure 2a).
Due to the symmetry of the channel cross section, all the particle/cell positions are moved to the upper-right quadrant (X > 0 and
Y> 0), and the particle fraction distributions are computed only in this quadrant.
■
EXPERIMENTAL RESULTSIn this section, we report experimental results in terms of fractions of particles over the channel cross section during
flow.
All the measurements have been taken at a
fixed distance from the inlet
Lz= 7.5 cm. In agreement with previous works,
32this distance assures that the particles/cells have reached the equilibrium position on the channel section, i.e., no signi
ficant change in the particle distribution is found by taking the measurements at a larger distance from the inlet. To further con
firm that this distance is su
fficiently large, we have estimated the channel length from numerical results available in the literature,
33assuring that rigid particles attain an equilibrium position. Simulation results refer to a con
finement ratio
β= 0.1 and a Deborah number
De= 2.0. For these parameters, a channel length of about 1.5
−2 cm is su
fficient to complete the migration process (either to the centerline or to the wall).
Higher con
finement ratios and Deborah numbers speed up the migration phenomenon so that the required distance from the inlet is even lower.
33However, we also perform experiments at a lower con
finement ratio (
β= 0.06) and Deborah number (De
= 0.92). By considering the dependence of the migration velocity on
Deand
βreported in the literature (for vanishing
De),17the length necessary to achieve equilibrium positions at
De= 0.92 increases 3
−4 times. In conclusion, a distance from the inlet
Lz= 7.5 cm should be su
fficient for all the experimental conditions examined in this work.
Typical snapshots for particle and cell suspensions taken with a 10
×objective are shown in Figure 4 at two di
fferent
flow rates (thus Deborah numbers). Following the methodology described in Determination of Particle and Cell Distribution along the Channel Cross Section, the cross-sectional particle/
cell positions are reconstructed, and the distributions are then evaluated using a 63
×objective. We
first describe the results for rigid particles, followed by the analysis for the Jurkat and NIH 3T3 cells.
Rigid Particles.
As rigid particles are, by de
finition, not deformable (G
→∞), the elastic capillary number is
Cael= 0.
Transversal migration of rigid particles is then driven by purely viscoelastic forces, quanti
fied through the Deborah number
De.For
β= 0.06 (d = 6
μm) and
De= 0.92, about 90% of rigid
particles are located at the corners of the square cross section,
while only
∼5% are found at the band closest to the centerline
Analytical Chemistry(Figure 5a1). By
fi= 0.06 and progressively increasing the Deborah number (that is, by increasing the
flow rate
Q),the fraction of particles near the corners reduces. For instance, at
De= 4.6 (Figure 5a3), the fraction of particles at the corners drops to
∼44%, and the particles migrate near the channel centerline or between the centerline and the walls. From
De= 9.2 to
De= 74, particles completely migrate away from the corners (Figure 5a4
−a7). For
β= 0.1 (d = 10
μm), particle
distributions are similar to the case of
β= 0.06 in the range of 0.92 <
De< 4.6 (Figure 5b1
−b4). In the range of 4.6 <
De<
74, particle distributions at
β= 0.1 di
ffer from those found at
β= 0.06 (Figure 5b4−b7). Starting from
De= 4.6, rigid particles tend to migrate toward the midregion of the channel cross section. At the highest
De-value (De= 74) investigated in this work, the equilibrium positions of the particles are evenly distributed along the centerline and close to the midregion of the channel cross section (Figure 5b7).
Rigid particles with a large size
β= 0.15 (d = 15
μm) display a di
fferent trend. For 0.92 <
De< 4.6, particles are driven to both the centerline and the corners of the square cross section (Figure 5c1
−c3). As
Deincreases, they progressively align on the centerline until complete 3D focusing is achieved (Figure 5c4
−c7). Finally, the largest particles considered in this work (d
= 20
μm,β= 0.2) are predominantly aligned on the centerline in the whole range of Deborah number investigated (Figure 5d1
−d7). Only at the smallest Deborah number
De= 0.92, a small fraction of particles (
∼10%) is observed near the corners.
We also investigate if particles at
β= 0.15 and
β= 0.20 remain aligned even at higher
flow rates. We
find that particles
flowing at a
flow rate
Q= 50
μL/min (De = 460) with
β= 0.15 are not tightly focused, while particles with
β= 0.2 remain substantially aligned (see Movie S1).
Figure 4. Experimental observation of particle and cell positions.
Experimental images of particles and cells atLz= 7.5 cm from the inlet in the square-shaped microchannel. A 10×objective is used. Images of NIH 3T3 are obtained using phase contrast microscopy. Scale bar is 100μm. Flow is from left to right.
Figure 5.Migration of rigid particles strongly depends on the Deborah number and confinement ratio. Normalized fractionfkof rigid particles atLz
= 7.5 cm from the inlet as a function of the spatial coordinatesXYin the upper-right quadrant of the channel cross section (seeFigure 3d). Each row corresponds to a different Deborah numbersDe. Each column corresponds to a different confinement ratioβ.
Analytical Chemistry
Cells.
Comparing to rigid particles, cells are deformable. As discussed in Theoretical Background, the e
ffect of the deformability-induced force is quanti
fied through the elastic capillary number
Cael. The storage modulus of Jurkat cells is estimated to be
G= 0.05
±0.035 kPa,
42while the storage modulus of NIH 3T3 is estimated to be
G≈20 kPa.
43These values of
Gcorrespond to the range of elastic capillary number 0.13 <
Cael< 1 for Jurkat cells and 3.4
×10
−4<
Cael< 2.5
×10
−3for NIH 3T3. Hence, the effect of shape deformation on the lateral motion of cells is expected to be stronger for Jurkat than for NIH 3T3 cells.
The average diameter of Jurkat cells in HA 0.8 wt % is
d= 14
±
2
μm, thus
β= 0.14
±0.02. Jurkat cells are prevalently focused on the channel centerline in the range of Deborah numbers 0.92 <
De< 2.6 (Figure 6a1,a2). At Deborah numbers in the range 4.6 <
De< 74, cells are found to enrich positions in the vicinity of the walls (Figure 6a3
−a7). Positions of Jurkat cells along the square cross section are similar to those of rigid particles with
β= 0.15 in the range 0.91 <
De< 2.3, while they bare more similarity to those observed for rigid particles at
β= 0.1 when 9.2 <
De< 74. This is not surprising since the diameter of Jurkat cells spans the range 12 <
d< 16
μm. The deformability-induced force is also expected to play a role in the migration process. Indeed, we observe highly deformed cells near the walls and less deformed cells on the centerline (Figure S4 for cells
flowing at
De= 74). Such di
fference in the observed deformability is related to the velocity pro
file for shear-thinning liquids (
flat around the centerline).
The average diameter of NIH 3T3 cells is
d= 24
±5
μm, thus
β= 0.24
±0.05. NIH 3T3 cells align on the channel
centerline in the whole range of the Deborah number investigated, 0.91 <
De< 74 (Figure 6b1
−b7). Comparing these results with those for rigid particles at
β= 0.2, we found a strong similarity between the equilibrium positions over the channel cross section attained by rigid particles and NIH 3T3 cells.
■
Transversal Migration of Rigid Particles.DISCUSSIONThe transversal migration of rigid particles in a strongly shear-thinning liquid can be summarized as follows: (i) at a
fixed Deborah number
De, the fraction of particles aligned on the channel centerlineincreases with increasing particle size (i.e., con
finement ratio
β), whereas the fraction of particles at the corners decreases.
Equilibrium positions are then shifted from the corners to the centerline, i.e.,
“from the edge to the center
”; (ii) at a
fixed
β, the fraction of particles at the corners decreases with increasing Deborah number
De; (iii) for relatively low values of 0.06 <β<
0.1, rigid particles attain an equilibrium position between the wall and the centerline; (iv) larger particles (i.e., large
β) prevalently migrate toward the channel centerline, and this e
ffect is enhanced at high Deborah numbers.
It is worthwhile to mention that, even at the lowest
De-value,the maximum estimated shear rate in the channel (at the wall) falls in the shear-thinning region. As
Deincreases, the maximum shear rate increases as well, and a larger volume of
fluid is characterized by a viscosity lower than its zero-shear value.
Our observations at low con
finement ratios and Deborah numbers (i.e., migration toward the corners) are consistent with previous experimental and numerical studies dealing with
Figure 6.Migration of Jurkat and NIH 3T3 cells depends on confinement ratio and Deborah number. Normalized fractionfkof cells atLz= 7.5 cm from the inlet as a function of the spatial coordinatesXYin the upper-right quadrant of the channel cross section (seeFigure 3d) for different Deborah numbersDe. Panels (a1−a7) report the results for Jurkat cells (d= 14±2μm). Panels (b1−b7) refer to NIH 3T3 cells (d= 24±5μm).Analytical Chemistry
weaker shear-thinning
fluids. Song et al.
22studied the transversal migration of rigid particles with
β ≈0.1. They found that particles suspended in weakly shear-thinning poly(ethylene oxide) solutions migrated toward the channel centerline when exploring the constant-viscosity zone of the viscoelastic suspending
fluid, whereas particles deviated from the channel axis as the
flow rate becomes su
fficiently high to enhance the shear-thinning of the suspending culture medium.
Very recently, Li et al.
37found results similar to Song et al.
22for the migration of rigid particles in a weakly shear-thinning hyaluronic acid solution
flowing in a straight microchannel with aspect ratio (width over height) varying between 1 and 3. Li et al.
37also observed a strong dependence of the elastic migration force on the polymer concentration and con
finement ratio. Seo et al.
31studied migration of particles suspended in 1 wt % PEO solution (n = 0.65) under two conditions: (i) when inertial and viscoelastic forces were comparable and (ii) when inertial forces dominated. When inertial and elastic forces were comparable, they found that particles were focused to the centerline and near the walls at
β= 0.1 but only to the centerline at
β= 0.17.
When inertial forces dominate, particles were dispersed around the centerline for
β= 0.1, but were focused at the centerline for
β= 0.17. However, they did not observe a complete shifting in the particle positions when increasing the particle size. Di
fferent from their work, inertial e
ffects are negligible in our experiments (Table 1). Villone et al.
33numerically studied the transversal migration of a single particle suspended in a strongly shear-thinning viscoelastic liquid described by the Phan-Thien Tanner model. (The Phan-Thien Tanner model
49describes polymer solutions presenting shear-thinning and
first normal stress di
fference, while it predicts a null second normal stress di
fference.) They found that the particles migrate toward the centerline or the corners of a straight channel depending on
De. AtDe
< 1, i.e., when exploring the constant-viscosity zone of the
fluid, particles migrate mainly toward the channel centerline regardless of the initial position. Only particles that start very close to the walls migrate toward the corners. At
De>
1, i.e., in the shear-thinning zone, particles migrate toward both the channel centerline and the walls, or toward the corners only. Finally, Del Giudice et al.
32found that particles suspended in a poly(ethylene oxide) 1.6 wt % solution (shear-thinning
fluid,
flow index
n= 0.5) with
β= 0.1 were well focused at the corners of the square-shaped microchannel at
De= 9.2. In this work, we
find that migration toward the corners occurs at a much lower Deborah number (De = 0.92). However, the
fluid used in the present work has a lower
flow index (n = 0.35), thus suggesting that the strength of shear-thinning a
ffects the transversal migration toward the corners.
As the Deborah number increases, the particles migrate away from the corners (Figure 5a3
−a7) and Figure 5b3
−b7). In contrast, previous experimental
32,37and numerical
33results have shown that the transversal migration toward the corners is enhanced by increasing
De. The detachment of particles fromthe walls has previously been associated with the inertial wall- lift force that is relevant at high
flow rates. The importance of inertial forces is quanti
fied through the Reynolds number
Re. DiCarlo
11reported that inertial e
ffects become dominant as
Re≈1. As reported in Table 1, the highest Reynolds number in our experiments is
Re= 3.6
×10
−3, thus inertial e
ffects are irrelevant in our case. A possible explanation that might justify our experimental observations is the possible occurrence of secondary
flows on the channel cross section. These
flows lead to the formation of vortices near the four corners of the square channel section and are caused by a viscoelastic property called second normal stress di
fference. An extensive investigation on the e
ffect of secondary
flows on the particle lateral motion has
Figure 7.Positions of particles match with the predicted positions of viscoelastic vortices. Velocityfield over the channel cross section of 0.8 wt % hyaluronic acid solution derived from numerical simulations (details can be found inSI). The color bars on the lateral side indicate the normalized fraction of particles as ineq 6. Solid dashed lines delimitate the zone accessible by the particle. Good agreement is found between the position of particles and the predicted position of the vortices induced by the viscoelastic secondaryflows.Analytical Chemistry
been carried out by Villone et al.
33through numerical simulations, using the Giesekus model to describe the viscoelastic
fluid. (The Giesekus model50describes polymer solutions presenting shear-thinning, positive
first normal stress di
fference, and negative second normal stress di
fference.) They found that, if the con
finement ratio was su
fficiently low (
β≤0.1), these vortices
“attract
”a small fraction of the particles, leading to an additional equilibrium particle position between the channel centerline and the walls. For
β= 0.1 and
De= 6 (higher values of
Deare not reported in their work), Villone et al.
33predicted this extra equilibrium position in the region around (X,
Y) = (0.18, 0.35), in very good quantitativeagreement with the position (X,
Y) = (0.17, 0.4) observed fromour measurements, corresponding to a peak in the particle fraction. We also carried out numerical simulations to evaluate the position of viscoelastic vortices along the cross section for our 0.8 wt % HA solution (Figure 7). Hyaluronic acid solution has been modeled through the Giesekus model (details can be found in the Supporting Information (SI)). We compared the position of viscoelastic vortices with particle positions at
β= 0.06 and
β= 0.1 for
De= 4.6 and
De= 9.2 (colored squares in Figure 7). We
find that the position of viscoelastic vortices is in good agreement with the experimentally observed peaks in the particle fraction.
As the con
finement ratio increases, particles are driven toward the corners and the centerline up to
De= 4.6 and progressively align around the centerline at higher
De-values.Villone et al.
33reported that, by increasing the con
finement ratio
β, a signi
ficant variation in the equilibrium positions attained by the particles emerges. Speci
fically, larger particles are not in
fluenced by the secondary
flows anymore (the extra equilibrium position generated by the presence of the vortices disappears) and tend to migrate toward the centerline.
Remarkably, at higher con
finement ratio
β⩾0.15, no particles are observed between the channel centerline and the walls, in agreement with the numerical
findings.
A direct measurement of a nonzero second normal stress difference for the HA 0.8 wt % solution would strengthen our argument above. Unfortunately, such a measure cannot be easily performed due to (i) lack of a well-established method to make this measurement feasible; (ii) low normal stress values of this
fluid (the second normal stress di
fference is generally 1 order of magnitude lower than the
first normal stress di
fference, which is already low for the 0.8 wt % HA solution).
Nevertheless, the agreement with numerical simulations supports our argument that the existence of secondary
flows is a plausible explanation for our experimental observations.
Transversal Migration of Cells.
The heterogeneous nature of cells
51does not allow us to de
finitely settle the origin behind the positions observed in our experiments.
However, we wish to compare our experimental results with simulation on deformable objects in shear-thinning liquids presented by Villone et al.
36The migration of Jurkat cells is signi
ficantly a
ffected by the heterogeneity of cell diameters (rigid particles show very di
fferent migration trends at
β= 0.1 and
β= 0.15, which are the same values of the con
finement ratios for Jurkat cells). In the range of Deborah number 0.92 <
De< 2.3, Jurkat cells are mainly aligned on the channel centerline (Figure 6a1,a2). In particular, the fraction of Jurkat cells on the corners at
De= 0.92 is
fk= 0.16, which is lower than both the fraction of rigid particles in the corners at
β= 0.1 (
fk= 0.88) and at
β= 0.15 (f
k= 0.49). This migration trend can be ascribed to both the e
ffect
of the con
finement (for bigger cells) and to the deformability- induced force acting on Jurkat cells. Yang et al.
23experimentally observed that red blood cells (average elastic modulus
G= 0.75
±
12 kPa
52is much higher than
G= 0.05
±0.035 kPa for Jurkat cells) suspended in a near constant-viscosity liquid experienced such deformability-induced force, promoting transversal migra- tion toward the centerline. In shear-thinning liquids, numerical simulations
33and experiments
37showed that the elastic force promotes migration toward the centerline or the corners of the square-shaped microchannel depending on the initial position of the cells (see also Theoretical Background). Therefore, competition or synergy between elastic and deformability- induced force is expected. Villone et al.
36carried out numerical simulations of elastic particles with
β= 0.2 in shear-thinning liquids (modeled through the Giesekus model
50). They found that an elastic particle with
β= 0.2 migrated toward the channel centerline when the elastic capillary number
Cael> 0.1 in the range of the Deborah number 0.2 <
De< 1, in very good agreement with our
findings for the transversal migration of Jurkat cells when 0.13 <
Cael< 0.24. At higher
Deand
Cael, bigger Jurkat cells are supposed to remain aligned on the centerline due to the high con
finement (as for rigid particles at
β= 0.15), while smaller Jurkat cells are supposed to remain on the centerline because of the deformability-induced force. On the contrary, we observe Jurkat cells on the centerline and on positions close to the channel wall. These
findings can be justi
fied as follows. When increasing the Deborah number
Deby increasing the
flow rate, the elastic capillary number
Caelincreases as well. However, increasing the Deborah number
Deby a factor of 2 corresponds to a mere increase of maximum 33% in
Cael(see Table 1) because the viscosity decreases. In other words, as the
flow rate increases, the increase in
fluid elastic force is far more signi
ficant than the increase in deformability-induced force. As reported in Theoretical Back- ground, when increasing
De, the neutral plane approaches moretoward the centerline, thus most of the cells would likely migrate away from the centerline. However, the deformability- induced force also increases and is directed toward the centerline. As a consequence, a competition between elastic forces and deformability-induced forces is expected to modify equilibrium positions. Our experiments show that cells occupy positions qualitatively similar to rigid particles at
β= 0.1 in the range of Deborah number 9.2 <
De< 74, thus suggesting that the viscoelastic force overcomes the deformability-induced force, allowing migration toward the wall. Numerical simulations of Villone et al.
36did not explore such high values of Deborah number nor other con
finement ratios, thus further comparison is not currently possible.
NIH 3T3 are much sti
ffer than Jurkat cells, since the elastic modulus of NIH 3T3 is
G ≈20 kPa.
52The highest elastic capillary number found in our experiments for NIH 3T3 is
Cael= 2.5
×10
−3, and numerical simulations of Villone et al.
36reported that deformability-induced force is negligible at such value of
Cael. In our experiments, NIH 3T3 cells follow the same migration trend of rigid particles with
β= 0.2, in agreement with numerical simulations of Villone et al.
33for the transversal migration of elastic particles at vanishing capillary numbers, suggesting that the deformability-induced force is negligible.
Recalling that average cell viability in our experiments is
∼