1* Department of Community Health Nursing, Ishika-wa Prefectural Nursing University, Tsu 7–1 Nakanu-ma, Kahoku, Ishikawa 929–1212, JAPAN
2 Department of Community Health Nursing, Gradu-ate School of Medical Science, The University of Tokyo
3 Department of Nursing, Division of Health Science, Graduate School of Medical Science, Kanazawa University
CHANGES IN FUNCTIONAL CAPACITY IN OLDER ADULTS
LIVING ALONE:
A THREE-YEAR LONGITUDINAL STUDY IN A RURAL AREA OF JAPAN
Emiko SAITO1*, Junko TAKAI1, Katsuko KANAGAWA1, Akiko HONDA2and Kazuko SAEKI3
Objective The purposes of this research were to clarify three-year changes in functional capacity and to investigate related physical health, psychological/mental health, and social health factors in older adults living alone in a rural area of Japan.
Methods Home visit interviews were conducted in 2000 (the baseline survey: n=128) and in 2003 (the follow-up survey: n=101) with older adults living alone in a town in Ishikawa prefec-ture. Seventy nine subjects were analyzed using logistic regression analysis at the follow-up survey.
Results Of these 79 subjects, 40 persons had scores for functional capacity decreased by one or more points, the ``Lowered'' group (50.6%), while 27 persons were ``Unchanged'' (34.2%), and 12 persons were ``Improved'' (15.2%). Factors at the baseline survey were compared between the ``Lowered'' group and the ``Unchanged/Improved'' group. Sig-niˆcant factors that caused a decreased functional capacity were age (75 years old and over), no participation in social activities, and contact with friends/neighbors over the phone less than once a week.
Conclusion This research has shown that participation in social activities and contact with friends/ neighbors maintain a higher functional capacity in older adults living alone.
Key words:aged, functional capacity, living alone, longitudinal study, quality of life
I. Introduction
Major changes in living arrangements have oc-curred in Japan, owing to an increase in the number of older people and a decrease in the birthrate. The number of nuclear families is increasing and the number of three-generational families is decreasing and consequently the households with only a married couple or a single person in which the older adult is the only family member are expected to keep increas-ing in number. The proportion of households of ol-der adults living alone is increasing, for example, 8.5% in 1980, 11.2% in 1990, and 14.2% in 2002, respectively. This tendency is continuing and ac-cording to estimated ˆgures, the total amount of households of older adults living alone will total 5.3
million in 20201).
As the estimated number of older adults grows, a socially independent lifestyle is expected for the old adults not only in their basic activities of daily living (BADL), but also in their higher-level activities of daily living of competence2). For a more positive life, the higher-level competences of ``Instrumental Self-maintenance'', ``Intellectual Activity'', and ``Social Role'' must be maintained, these generally being de-ˆned as ``functional capacity''3~7). Koyano et al.8) reported that approximately 75% of older adults liv-ing alone in a community have an independent func-tional capacity. Another result was obtained approx-imately 90% of older adults living alone also have
physical independence9). However, it is more
di‹cult to keep a healthy lifestyle for older adults liv-ing alone than those livliv-ing with others10). When de-terioration in their status occurs, they need various support from separated families, friends, neighbors, and medical, health and social services. In some cases, their living places or conditions will be largely changed after rehabilitation or treatment11). In other words, older adults living alone have more potential problems in their health and living conditions com-pared with those living with others.
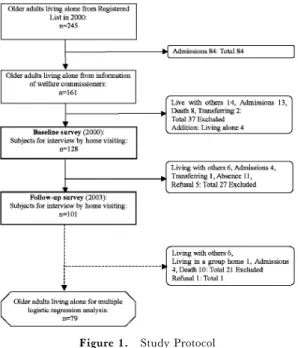
Figure 1. Study Protocol
the characteristics of older adults living alone when compared with those living with others. No clearly speciˆc characteristics were evident in some of the available reports12,13). However, in one investigation a diŠerence between older adults living alone and ol-der adults living with their families was found regarding social support from neighbors in the community14)and the authors suggested more help was needed to provide older adults living alone with a point of contact in case of emergency. In longitudi-nal studies, with death assumed to be the outcome, no diŠerence between older adults living alone or with others was apparent15,16). However, when
ex-amining physical health, psychological/mental
health, and social health factors as outcomes, older adults living alone did show diŠerences17). This was also conˆrmed in a four-year follow-up survey for fe-male older adults living alone, namely, that contact with friends and relatives signiˆcantly prevents lowering of mental health scores18).
In Japan, several cross-sectional studies have been performed with older adults living alone as the focus group since the 1990's8,10,19,20). Single house-holds of older adults have priority eligibility for entry into special nursing homes for the aged21). However, no longitudinal study focusing on older adults living alone has yet been documented to our knowledge in Japan. Only a few preventive services are in place by which older adults living alone are protected from becoming homebound or bed-ridden or physi-cally handicapped. The purpose of the present 3-year
longitudinal study was to clarify changes in functio-nal capacity and to investigate related changes physi-cal health, psychologiphysi-cal/mental health, and social health factors.
II. Methods
Data collection
The baseline survey was conducted from Sep-tember to November in 2000, and the follow-up sur-vey from August to October in 2003. Older adults were identiˆed in single households from the Resi-dent Registries. The number of older adults living a-lone over 65 years was 245 in a town of Ishikawa prefecture in 2000. Figure 1 shows the study pro-tocol. First, 84 subjects in hospital or facilities for the aged were excluded from the 245. Second, from detailed information provided by welfare commis-sioners in each district, an additional 14 subjects were excluded as living with others, 13 as in hospitals or facilities for aged, 8 because they had died and 2 because of transfer, while 4 subjects who were con-ˆrmed as living alone were added to the subject last. One hundred twenty eight subjects were thus eligible for the baseline survey in 2000. From the results of 6 subjects with others, 4 subjects in hospital or facili-ties, one person who was transferred, 11 subjects who were absent and 5 subjects who refused to be in-terviewed were excluded. The follow-up survey was conducted for 101 subjects in 2003. Eighty subjects remained living alone, and only one person refused in the follow-up survey. Data for seventy nine sub-jects were therefore analyzed by multiple logistic regression analysis.
Questionnaires were collected by home visiting interviewers, who were public health nurses, regis-tered nurses, and certiˆed care workers in 2000 and public health nurses in 2003, and the average time for an interview was 45 minutes. Details of the base-line survey process were described in a previous research report9).
Measures
1) Dependent variable.
Functional capacity was measured using the Tokyo Metropolitan Institute of Gerontology Index of Competence (TMIG–Index of competence) which consists of thirteen items: ˆve items of strumental Self-maintenance'', four items of ``In-tellectual Activity'', and four items of ``Social Role''. The response to each item was designed as `yes (able to do)' or `no (unable)' and scored as 1 for `yes' and 0 for `no'. Full marks for the total of 13 items thus e-qualled 13 points22,23). A higher score indicates a higher competence of functional status for older adults.
2) Independent variables.
Independent variables were arranged according to the three factors of physical health status, psycho-logical/mental health status, and social health status. The following include the physical factors: admission to a hospital within one year preceding the baseline survey (yes or no), current medical treatments (yes or no), self-reported diseases currently being treated medically, criteria for evaluating the degree of in-dependence of disabled elderly persons in perform-ing activities of daily livperform-ing24), screening levels of long-term care required by the Long-term Care In-surance System, basic activities of daily living (BADL), visual impairment, hearing impairment, cognitive impairment, physical performance by the motor ˆtness scale and self-rated health.
The basic activities of daily living were meas-ured using the Barthel index developed by Mahoney et al.25). Visual impairment was assessed into three categories: able to read a newspaper, able to recog-nize someone one meter ahead, and almost unable to see. Hearing impairment was also similarly assessed: able to hear normally, able to hear when someone speaks in a loud voice, and almost unable to hear and cognitive impairment was assessed: none or no in-convenience in daily life, slight inin-convenience, and serious inconvenience. Physical performance was measured using the Motor Fitness Scale (MFS)26). Self-rated health was assessed in 4 categories (good, fair, poor, and very poor) by asking: ``How would you rate your present health?27,28)''
The following include psychological/mental health factors: depression status, self-e‹cacy in activities of daily living, and feeling that life is worth living. Depressive status was measured by the short version of the Geriatric Depression Scale (GDS)29~31). Yatomi32)reported this to have relia-bility and validity for older adults in Japan. A score of 5 or greater shows a tendency for a depressive con-dition. The total GDS score included missing values that were estimated based on the answer tendency to the items eŠectively answered. For 10 subjects who answered 1/2 or more (over 8-items) of the total number of items, the following calculation method was used to estimate scores for incorporation of anal-ysis: multiplying the total score by the reciprocal of the number of answered items over the number of total items15): for an examinee who answered 8 items with a total point value of 3, the estimated score was 3×15/8=5.6 points33). Self e‹cacy in activities of daily living was measured using six items of a modiˆ-cation of the Falls E‹cacy Scale (FES)23), developed by Tinetti et al.34).
The following were the social health factors: having a job, participation in social activities,
fre-quency of contact with family members face-to-face or over the phone, and frequency of contact with friends/neighbors face-to-face or over the phone. The frequency of participation in social activities and contact with family members or friends/neighbors face-to-face or over the phone were divided into ˆve categories; (1) two or more times a week, (2) once a week, (3) 1–2 times a month, (4) a few times a year, and (5) none.
Statistical analysis
The statistical data were analyzed using the SPSS statistical package software version 10.0 J for Windows. Comparisons among categorical variables were made using the chi-square test and the Fisher's exact test (when the expectation value was less than 5 per cell), for ordered variables using the Mann-Whitney U test or Kruskal-Wallis' H test, and for continuous variables with the Student t test, the One-way ANOVA. We divided subjects into three groups; ``Improved'', ``Unchanged'' and ``Lo-wered'' demonstrating increase, maintenance and decrease of the functional capacity score from 2000 to 2003. ``Lowered'' was then compared with
``Un-changed/Improved'' combined, because
main-tenance of competence in functional status is thought to be successful aging35). Multiple logistic regression analysis was used to examine the changes in func-tional capacity. Odds ratios were adjusted for the functional capacity score at the baseline survey ac-cording to forced entry. A signiˆcant diŠerence was calculated with a two-sided p value less than 0.05. Ethical approvals
All participants provided verbal informed con-sent. Prior to the home visit interviews, all par-ticipants received the survey documents by mail and received information in advance on the purpose of the survey, including the request for an interview at home, and a visiting schedule. After sending the in-formation, a phone call was made if possible and per-mission was obtained for a visit. The public health nurses visited older adults at home and explained the purpose of this survey once again. They then made the interview using the questionnaire if consent had been given. In addition, prior to approaching the subjects, we explained the purpose of this survey to the district welfare department in order to obtain permission from the local authorities. After this ex-planation, public health nurses asked welfare com-missioners in districts to explain the purpose of the survey at meetings to be held in their districts.
III. Results
Changes in functional capacity
Table 1–1. Characteristics of older adults living alone by gender at the baseline survey
Contents (n=20)Males (n=81)Females P-value
mean±SD, n % mean±SD, n % Sociodemographic factors
Age 75.6±7.7 75.9±6.7 0.827
≧75 10 50.0 46 56.8 0.584
Years living alonea 10.1±11.1 9.2±9.1 0.979
Functional capacity
TMIG Index of competence 12.1±1.6 10.9±3.2 0.190
Physical health factors
Admission to a hospital within one year preceding the baseline surveyb 3 15.8 11 13.6 0.726
Current medical treatments 15 75.0 67 82.7 0.523
Self-reported diseases Hypertension 6 37.5 30 47.6 0.468 Heart disease 2 12.5 13 20.6 0.723 Gsatrointestinal disease 2 12.5 12 19.0 0.723 Eye disease 1 6.3 8 12.7 0.334 Osteoporosis 0 0.0 9 14.3 1.000 Diabetes 2 12.5 5 7.9 0.191 Hyperlipidemia 2 12.5 5 7.9 0.677 Articular rheumatism 0 0.0 7 11.1 1.000 Lumbalgia 1 6.3 5 7.9 0.625 Respiratory disease 1 6.3 3 4.8 0.625 Stroke 0 0.0 1 1.6 1.000 Liver disease 0 0.0 1 1.6 1.000 Other diseases 1 6.3 16 25.4 0.170
Degree of independence Independence 18 90.0 64 79.0 0.350†
Rank J 2 10.0 12 14.8
Rank A 0 0.0 4 4.9
Rank B 0 0.0 1 1.2
Rank C 0 0.0 0 0.0
Screening levels of long-term Support required 2 10.5 9 11.1 1.000
care insurance Care level 1 0 0.0 3 3.7
Care level 2 0 0.0 1 1.2
Care level 3 0 0.0 1 1.2
Basic activities of daily living 99.8±1.1 98.0±10.9 0.677
Visual impairment 1 5.0 7 8.6 1.000
Hearing impairment 6 30.0 16 19.8 0.367
Cognitive impairment 1 5.0 12 14.8 0.455
Physical performance 11.6±3.4 7.9±4.0 0.000
Self-rated healthc good 1 5.3 10 12.7 0.728‡
fair 13 68.4 45 57.0
poor 4 21.1 18 22.8
very poor 1 5.4 6 7.6
Missing: a=99, b=100, c=98, d=89, e=96 x2test, Fisher exact test, t test, Mann-Whitney U test † Independence vs. Rank J, A, B.
Table 1–2. Characteristics of older adults living alone by gender at the baseline survey
Contents (n=20)Males (n=81)Females P-value
mean±SD, n % mean±SD, n % Psychological/mental health factors
Depressive statusd 2.7±2.7 3.5±3.1 0.357
Depressive condition 2 12.5 19 26.0 0.340
Self-e‹cacy in activities of daily livinge 22.1±2.8 19.9±3.9 0.021
Feeling life to be well worth living yes 17 94.4 65 83.3 0.457
Social health factors
Having a job yes 8 40.0 16 19.8 0.078
Participation in social activitiesb yes 12 63.2 46 56.8 0.613
none 7 36.8 35 43.2
Frequency of contact with family ≧1/a week 8 42.1 37 45.7 0.778
members face-to-faceb <1/a week 11 57.9 44 54.3
Frequency of contact with family ≧1/a week 10 52.6 42 53.2 0.967
members over the phonec <1/a week 9 47.4 37 46.8
Frequency of contact with ≧1/a week 14 73.7 73 87.9 0.050
friends/neighbors face-to-facea <1/a week 5 26.3 7 12.1
Frequency of contact with ≧1/a week 8 44.4 33 42.3 0.869
friends/neighbors over the phone <1/a week 10 55.6 45 57.7
Missing: a=99, b=100, c=98, d=89, e=96 x2test, Fisher exact test, t test, Mann-Whitney U test
males (19.8%), mean age 75.9 years old (standard deviation 6.8), and age range was from 65 to 97 years at the baseline survey. Table 1–1 and Table 1–2 show characteristics of older adults living alone by gender.
In the baseline survey, 53 (67.1%) received full scores, but in the follow-up survey, this was the case for only 28 (35.4%). The score of functional capaci-ty in 2003 was signiˆcantly correlated with the score in 2000 (R2=.24, P<.001). The score of 40 sub-jects (50.6%) had decreased, and the average num-ber of points for the functional capacity score sig-niˆcantly decreased from 11.6±2.4 to 10.4±3.2 (P =.001) in 2000 and 2003. The average number of points for ``Instrumental Self-maintenance'' and ``Intellectual Activity'' signiˆcantly decreased from 4.8±0.6 to 4.3±1.3 (P=.001) and from 3.6±1.1 to 3.2±1.2 (P=.001). The average number of points for ``Social Role'' decreased from 3.2±1.4 to 2.9±1.4 (P=.073). Table 2 shows the average number of points for the functional capacity score by age and gender in 2000 and 2003. The average total, ``Instrumental Self-maintenance'' and ``Intellectual Activity'' scores signiˆcantly decreased in subjects aged 75 years and over. Total and three subscale scores were signiˆcantly decreased in female sub-jects. The rate for subjects who had scores of ten points or less increased to 36.7%.
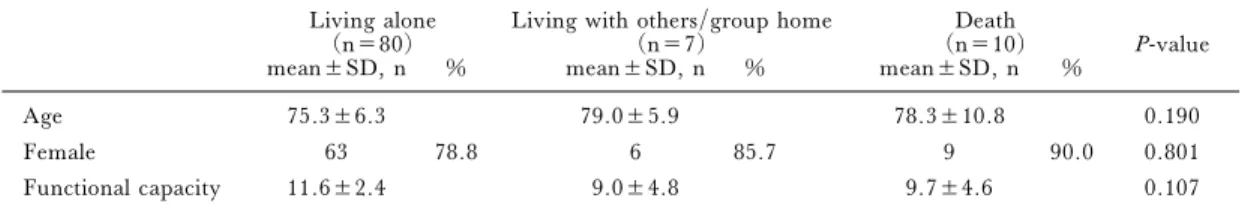
Prognoses, which were categorized into 3
groups: living alone (80 persons), living with others or living in a group home (7 persons), and deaths (10 persons) at the follow-up survey were compared with age, gender and functional capacity scores at the baseline survey (Table 3).
The factors related to changes in functional capacity were examined in 79 persons, excluding the one refusal among the 80 persons living alone, divid-ed into ``Lowerdivid-ed'' 40 (50.6%), ``Unchangdivid-ed'' 27 (34.2%), and ``Improved'' 12 (15.2%) groups. Subjects who had 13 points of functional capacity score in 2000 were 27 (67.5%) in the ``Lowered'' and 25 (92.6%) in the ``Unchanged''. Subjects who had from 2 to 9 points of functional capacity score in 2000 were 6 (15.0%) in the ``Lowered'', 2 (7.4%) in the ``Unchanged'' and 8 (66.7%) in the ``Im-proved''. The average functional capacity score sig-niˆcantly decreased from 11.7±2.5 to 8.6±3.5 in the ``Lowered'' (P=.000) and signiˆcantly in-creased from 11.5±2.4 to 12.3±1.2 in the ``Un-changed/Improved'' (P=.001) in 2000 and 2003. Relationship among functional capacity and physical health, psychological/mental health and social health factors
In order to examine functional capacity and related factors for older adults living alone, factors at 2000 were compared between the ``Lowered'' group and the ``Unchanged/Improved'' group (Table 4–1 and Table 4–2). The ``Lowered'' group showed sig-niˆcantly higher percentages of hearing impairment,
Table 2. Changes in functional capacity score by age and gender in 2000 and 2003 n=79 2000 2003 P-value mean±SD ≦74(n=36) Total score 12.4±2.0 12.0±1.2 0.169 Instrumental self-maintenance 4.9±0.2 4.9±0.4 0.711 Intellectual activity 3.7±1.1 3.5±0.8 0.201 Social role 3.8±0.9 3.5±0.7 0.244 ≧75(n=43) Total score 11.0±2.6 9.1±3.8 0.002 Instrumental self-maintenance 4.7±0.7 3.9±1.5 0.000 Intellectual activity 3.5±1.0 2.9±1.4 0.002 Social role 2.8±1.5 2.4±1.6 0.162 Males(n=16) Total score 12.1±1.7 11.9±1.7 0.606 Instrumental self-maintenance 4.8±0.7 4.6±1.1 0.188 Intellectual activity 3.9±0.3 3.8±0.4 0.580 Social role 3.5±1.0 3.6±0.8 0.843 Females(n=63) Total score 11.5±2.6 10.0±3.4 0.001 Instrumental self-maintenance 4.8±0.5 4.3±1.3 0.001 Intellectual activity 3.5±1.2 3.0±1.3 0.001 Social role 3.1±1.4 2.7±1.5 0.047 Males ≦74(n=8) Total score 13.0±0.0 12.3±1.2 0.111 Instrumental self-maintenance 5.0±0.0 5.0±0.0 ― Intellectual activity 4.0±0.0 3.8±0.5 0.170 Social role 4.0±0.0 3.5±1.1 0.227 ≧75(n=8) Total score 11.3±2.1 11.6±2.1 0.504 Instrumental self-maintenance 4.5±0.9 4.1±1.5 0.197 Intellectual activity 3.8±0.5 3.9±0.4 0.351 Social role 3.0±1.2 3.6±0.5 0.180 Females ≦74(n=28) Total score 12.2±2.2 11.9±1.3 0.404 Instrumental self-maintenance 4.9±0.3 4.9±0.4 0.713 Intellectual activity 3.6±1.3 3.5±0.9 0.415 Social role 3.7±1.0 3.5±0.7 0.515 ≧75(n=35) Total score 10.9±2.7 8.5±3.8 0.001 Instrumental self-maintenance 4.7±0.7 3.8±1.6 0.001 Intellectual activity 3.5±1.1 2.7±1.5 0.001 Social role 2.7±1.6 2.1±1.6 0.060
Total score≦10 point1) 20(25.3%) 29(36.7%)
1) the number of subjects (%) paired t-test
Table 3. Relationship between situation in 2003 and age, gender and functional capacity in 2000 Living alone
(n=80) Living with others/group home(n=7) (n=10)Death P-value
mean±SD, n % mean±SD, n % mean±SD, n %
Age 75.3±6.3 79.0±5.9 78.3±10.8 0.190
Female 63 78.8 6 85.7 9 90.0 0.801
Functional capacity 11.6±2.4 9.0±4.8 9.7±4.6 0.107
Table 4–1. Relationship between changes in functional capacity and other factors at the baseline survey Contents Lowered(n=40) Unchanged/improved(n=39) P-value
mean±SD, n % mean±SD, n % Sociodemographic factors Age 65–74 14 38.9 22 61.1 0.056 ≧75 26 60.5 17 39.5 Gender male 6 37.5 10 62.5 0.239 female 34 54.0 29 46.0
Years in living alonea 10.2±8.8 9.4±10.6 0.712
Functional capacity
TMIG Index of competence 11.7±2.5 11.5±2.4 0.768
Physical health factors
Admission to a hospital within one year yes 5 55.6 4 44.4 1.000
preceding baseline surveyb no 35 50.7 34 49.3
Current medical treatments yes 31 47.7 34 52.3 0.260
no 9 64.3 5 35.7
Self-reported diseases
Hypertension yes 18 50.0 18 50.0 0.918
no 22 51.2 21 48.8
Heart disease yes 8 53.3 7 46.7 0.816
no 32 50.0 32 50.0
Gastrointestinal disease yes 7 50.0 7 50.0 0.958
no 33 50.8 32 49.2
Eye disease yes 4 44.4 5 55.6 0.737
no 36 51.4 34 48.6 Osteoporosis yes 3 33.3 6 66.7 0.311 on 37 52.9 33 47.1 Diabetes yes 5 71.4 2 28.6 0.432 no 35 48.6 37 51.4 Hyperlipidemia yes 1 14.3 6 85.7 0.057 no 39 54.2 33 45.8
Articular rheumatism yes 4 57.1 3 42.9 1.000
no 36 50.0 36 50.0
Lumbalgia yes 4 66.7 2 33.3 0.675
no 36 49.3 37 50.7
Respiratory disease yes 2 50.0 2 50.0 1.000
no 38 50.7 37 49.3
Stroke yes 0 0.0 1 100.0 0.494
no 40 51.3 38 48.7
Liver disease yes 0 0.0 1 100.0 0.494
no 40 51.3 38 48.7
Other diseases yes 7 41.2 10 58.8 0.379
no 33 53.2 29 46.8
Degree of independence Independence 34 50.7 33 49.3 1.000
Rank J 6 54.5 5 45.5
Rank A 0 0.0 1 100.0
Basic activities of daily living 99.8±1.6 99.7±1.1 0.983
Visual impairment yes 3 60.0 2 40.0 1.000
no 37 50.0 37 50.0
Hearing impairment yes 12 75.0 4 25.0 0.029
no 28 44.4 35 55.6
Cognitive impairment yes 3 50.0 3 50.0 1.000
no 37 50.7 36 49.3
Physical performance 8.7±3.6 9.4±4.0 0.425
Self-rated healtha good 31 53.4 27 46.6 0.280
poor 7 38.9 11 61.1
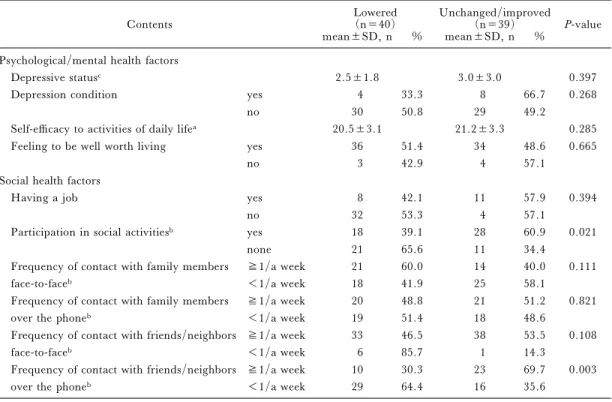
Table 4–2. Relationship between changes in functional capacity and other factors at the baseline survey Contents Lowered(n=40) Unchanged/improved(n=39) P-value
mean±SD, n % mean±SD, n % Psychological/mental health factors
Depressive statusc 2.5±1.8 3.0±3.0 0.397
Depression condition yes 4 33.3 8 66.7 0.268
no 30 50.8 29 49.2
Self-e‹cacy to activities of daily lifea 20.5±3.1 21.2±3.3 0.285
Feeling to be well worth living yes 36 51.4 34 48.6 0.665
no 3 42.9 4 57.1
Social health factors
Having a job yes 8 42.1 11 57.9 0.394
no 32 53.3 4 57.1
Participation in social activitiesb yes 18 39.1 28 60.9 0.021
none 21 65.6 11 34.4
Frequency of contact with family members ≧1/a week 21 60.0 14 40.0 0.111
face-to-faceb <1/a week 18 41.9 25 58.1
Frequency of contact with family members ≧1/a week 20 48.8 21 51.2 0.821
over the phoneb <1/a week 19 51.4 18 48.6
Frequency of contact with friends/neighbors ≧1/a week 33 46.5 38 53.5 0.108
face-to-faceb <1/a week 6 85.7 1 14.3
Frequency of contact with friends/neighbors ≧1/a week 10 30.3 23 69.7 0.003
over the phoneb <1/a week 29 64.4 16 35.6
Missing: a=77, b=78, c=71 x2test, Fisher exact test, t test, Mann-Whitney U test
Table 5. Odds ratios in the prediction of changes in functional capacity among older adults living alone: Multiple logistic regression analysis1)
Factors b P-value odds ratio 95%CI
Age2) 1.229 0.044 3.419 1.033–11.317
Gender3) 1.135 0.109 3.113 0.778–12.459
Hearing impairment4) 1.071 0.166 2.918 0.641–13.275
Participation in social activities5) 1.275 0.028 3.580 1.144–11.205 Contact with friends/neighbors over the phone6) 1.343 0.017 3.831 1.275–11.512 1) Odds ratio were calculated as the relative risk of changes in functional capacity associated with factors and were
adjust-ed for functional capacity score at the baseline survey. Forcadjust-ed entry: All variables are enteradjust-ed in a single step. 2) Age was coded as 0=65–74, 1=≧75. Odds ratio was the relative risk of lowered functional capacity associated with
≧75.
3) Gender was coded as 0=male, 1=female. 4) Hearing impairment was coded as 0=no, 1=yes.
5) Participation in social activities was coded as 0=yes, 1=none. The odds ratio was the relative risk of lowered function-al associated with none.
6) Contact with friends/neighbors over the phone was coded as 0=≧1/a week, 1=<1/a week. The odds ratio was the relative risk of lowered functional capacity associated with <1/a week.
no participation in social activities, and low fre-quency of contact with friends/neighbors over the phone compared with those in the ``Unchanged/Im-proved'' group. Moreover, ``Lowered'' showed a signiˆcantly high percentage of older adults aged 75
years and over when compared with ``Unchanged/ Improved''.
Based on the results of the analysis using two variates (``Lowered'' and ``Unchanged/Improved''), multiple logistic regression analysis was performed
by selecting the variables with a signiˆcant diŠerence and by adjusting the scores obtained for functional capacity at the baseline. The results showed a sig-niˆcant diŠerence as to age, participation in social activities, and frequency of contact with friends/ neighbors over the phone (Table 5). Signiˆcant fac-tors that caused decreased functional capacity were age (75 years and over), no participation in social activities, and contact with friends/neighbors over the phone less than once a week.
IV. Discussion
Our research established that ˆnding older adults who were actually living alone in a community is relatively di‹cult. Subjects of our 3-year lon-gitudinal research were selected from information given by welfare commissioners, and screening was performed by home visits. In this research, 6 persons who were thought to be eligible as subjects at the baseline survey in fact lived with others. Koyano8) reported, among single households of older adults registered on records, approximately only 60% of them to be actually living alone in a community. Changes in living arrangements have been reported to in‰uence health status, and future investigation will be needed regarding the transfer of households from older adults living with others to older adults living alone11).
In the present study conducted among older adults living alone, the rate for subjects who decreased 1 point or more in the functional capacity score as compared with the score of the baseline
survey was 50.6%. Haga36) estimated that the
decreased score in functional capacity among com-munity-dwelling older adults was one point in ˆve years, and 0.2 points in one year. In our results, the average scores of total subjects, males and females decreased by 1.2 points, by 0.2 points and by 1.5 points in three years respectively. In addition, the rate of subjects who had scores of ten points or less increased to 36.7%. They have to be considered as subjects who need preventive services for main-tenance of their functional capacity. We classiˆed ol-der adults living alone by group according to the changes in their scores (1 point or more) given in the baseline and follow-up surveys, and termed their functional capacity as ``Lowered'', or ``Unchanged/ Improved''. For application of individual evaluation among community-dwelling older adults, a recent study used test-retest methods with a month inter-val, and this indicated that change of one point in total scores may be within the range of measure-ment error37). Therefore, it is necessary to consider changes of two points or more in case of short term
observations. However, Koyano et al.5) indicated that a 1 point change in scores was associated with relative risk factors of mortality in their 1-year lon-gitudinal study. We therefore conclude that our group classiˆcation was appropriate for analysis be-cause our research was designed for a 3-year lon-gitudinal study.
For community-dwelling older adults, a number of authors have examined functional capacity by classifying into groups depending on their degree of independence; for example, independent older adults, frail older adults, and housebound older adults3,6,22,38,39). In longitudinal studies, age, mobili-ty, self-rated health, and contact with friends were clariˆed as factors relating to functional capacity in community-dwelling older adults3,23,36). Among these studies, only one report indicated that func-tional capacity decreased when older adults had few associations with friends36). In our research, the fre-quency of contact with friends/neighbors over the phone was signiˆcantly related to functional capaci-ty, but the frequency of contact with friends/ neighbors by face-to-face communication was not. Fees et al.40)reported that the frequency of telephone contact, and age, but not the frequency of face-to-face contact with others aŠects perceived loneliness. Gueldner et al.41)showed in their ˆndings that the telephone as an intervention decreased loneliness and increased feelings of connectedness among men-tally alert nursing home residents. There have hith-erto been no data showing associations between lack of participation of social activities and decrease in functional capacity among community-dwelling older adults. However, our study suggested that lack of participation of social activities could predict decline in functional capacity among older adults liv-ing alone. The role of social activities among older adults living alone has to be examined in further stu-dies. In addition, sensory impairment is an impor-tant factor in maintaining an independent lifestyle for older adults42,43), although multiple logistic re-gression analysis indicated no signiˆcant diŠerence in hearing impairment for changes in functional capacity in our study. It is necessary to carry out more research because participating in social activi-ties and having contact with others are naturally in-‰uenced by hearing impairment.
The limitations of our study are as follows: representativeness of subjects, validity of selecting variables. First, the number of subjects was limited and in only one locality. Because 101 people includ-ing the number of deaths were followed, our study population was small, although the total number of older adults living alone in one region was targeted. It is not clear whether the results of this research can
also be applied socially and culturally to urban areas or not because only one municipality of a province was studied. Second, factors not examined in this study such as smoking, serum albumin level, grip strength, time to stand with one leg, systolic blood pressure, alcoholic consumption are also related to changes in functional capacity3,23,36)and need to be taken into account into future investigations. Fur-thermore, we found that it is extremely di‹cult to perform measurement of strength tests or blood ex-aminations of all members when targeting older adults living alone in a community.
A uniform view of older adults has been rev-iewed, and support corresponding to the actual diverse lifestyle of older adults has begun to be exa-mined in recent years44). Problems of older adults are caused not only with reference to aging and physical independence, but also through living arrangements and social activities, and the diversiˆed lifestyles of older adults need to be examined. It is also important to a policy-making strategy that oŠers suitable sup-port for older adults living alone. This research has shown participation in social activities and contact with friends/neighbors to maintain a higher func-tional capacity in older adults living alone.
Acknowledgments
Sincere appreciation is extended to the par-ticipants of the survey and the welfare commissioners for their cooperation. We would like to thank public health nurses and certiˆed care workers in the town for coordinating the visit interviews.
This research was supported by a Grant-in-Aid for scientiˆc research from the Japan Society for the Promotion of Science in 2002–2003.
References
1) Cabinet O‹ce. Annual report on the aging society: 2002–2003. Tokyo: Gyousei, 2003; 2–20.
2) Lawton MP. Assessing the competence of older peo-ple. In: Donald P. Kent, et al., editors. Research, Plan-ning, and Action for the Elderly: the Power and Poten-tial of Social Science. New York: Behavioral Publica-tions, 1972; 122–143.
3) Haga H, Shibata H, Ueno M, et al. Competence and associated factors in the elderly living at home. Jpn J Gerontol 1990; 2: 182–198 (in Japanese).
4) Koyano W, Shibata H, Nakazato K, et al. Measure-ment of competence: reliability and validity of the TMIG index of competence. Arch Gerontol Geriat 1991; 13: 103–16.
5) Koyano W, Shibata H. Cross-validation of the TMIG index of competence: Invariability of factor structure and predictive validity. Jpn J Gerontol 1992; 14: 34–42 (in Japanese).
6) Koyano W, Hashimoto M, Fukawa T, et al. Func-tional capacity of he elderly: measurement by the TMIG index of competence. Jpn J Public Health 1993; 40: 468–474 (in Japanese).
7) World Health Organization: The uses of epidemiolo-gy in the study of the elderly: report of a WHO scientiˆc group on the epidemiology of aging WHO technical report series 706. Geneva: World Health Organization, 1984.
8) Koyano W. Social support system of the elderly living alone. Grant-in-Aid for Scientiˆc Research (B) 1993 (in Japanese).
9) Honda A, Saito E, Kanagawa K, et al. The relation between characteristics and activities of daily living of elderly living alone. Jpn J Public Health 2002; 49: 795–801 (in Japanese).
10) Sugisawa H. An analysis of the impact of living ar-rangements on health behavior among older adults. Jpn J Gerontol 1993; 15: 58–67 (in Japanese).
11) Winchester J, Liang BJ, Krause N. et al. Transitions in living arrangements among elders in Japan: does health make a diŠerence? J Gerontol Soc Sci 2002; 57B: S209–S220.
12) IliŠe S, Tai SS, Haines A, et al. Are elderly people living alone an at risk group? BMJ 1992; 305: 1001–1004.
13) Magaziner J, Cadigan DA, Hebel JR, et al. Health and living arrangements among older women: does liv-ing alone increase the risk of illness? J Gerontol Med Sci 1988; 43: 127–133.
14) Thompson EE, Krause N. Living alone and neighborhood characteristics as predictors of social sup-port in late life. J Gerontol Soc Sci 1998; 53B: 354–364. 15) Davis MA, Neuhaus JM, Moritz DJ, et al. Living ar-rangements and survival among middle-aged and older adults in the NHANES I epidemiologic follow-up study. Am J Public Health 1992; 82: 401–406. 16) Davis MA, Moritz DJ, Neuhaus JM, et al. Living
ar-rangements, changes in living arar-rangements, and sur-vival among community dwelling older adults. Am J Public Health 1997; 87: 371–334.
17) Sarwari AR, Fredman L, Langenberg P, et al. Prospective study on the relation between living arran-gement and change in functional health status of elderly women. Am J Epidemiol 1998; 147: 370–378. 18) Michael YL, Berkman LF, Colditz GA, et al. Living
arrangements, social integration, and change in func-tional health status. Am J Epidemiol 2001; 153: 123–131.
19) Yamagami M, Noyama O, Nishimura I. Vitamin A, B1 and C status of elderly living alone. Jpn J Public Health 1998; 45: 213–24 (in Japanese).
20) Yamashita K, Kobayashi S, Tsunematsu T. Depressed mood and subjective sensation well-being in the elderly living alone on Oki island in Shimane prefec-ture. Jpn J Geriat 1992; 29: 179–84 (in Japanese). 21) Watanabe M, Kono K, Kawamura K, Matsuura T.
Factors In‰uencing admission to nursing homes among frail and bedridden elderly persons receiving public health and welfare services. Jpn J Public Health 1998;
45: 45–55 (in Japanese).
22) Koyano W, Shibata H, Nakazato K, et al. Measure-ment of competence in the elderly living at home: de-velopment of an index of competence. Jpn J Public Health 1987; 34: 109–114 (in Japanese).
23) Haga H, Shibata H, Kumagai S, et al. Factors con-tributing to longitudinal changes in high level of func-tional capacity of the elderly living in a community. In: Shibata H, editors. Facts, Research and Intervention in Geriatrics 1997: Longitudinal Interdisciplinary Study on Aging, 2nd Edition. Paris: Serdi Publisher, 1997; 53–61.
24) Ministry of Health, Labor and Welfare: An o‹cial document of ministry secretariat of health and welfare for the elderly bureau. Criteria for evaluating the degree of independence (degree of ``bedriddenness'') of disability elderly persons in performing activities of dai-ly living. Tokyo: Ministry of Health, Labor and Wel-fare, 1991.
25) Mahoney FI, Barthel DW. Functional evaluation: the Barthel index. Maryland State Med J 1965; 14: 61–65.
26) Kinugasa T, Nagasaki H. Reliability and validity of the motor ˆtness scale for older adults in the communi-ty. Aging (Milano) 1998; 10: 295–302.
27) Haga H, Shibata H, Ueno M, et al. Relationship of self-rated health to mortality among the community el-derly. Jpn J Public Health 1991; 8: 783–789 (in Japanese).
28) Haga H, Shibata H, Suyama Y, et al. Self-rated health as a predictor of active life in the community el-derly. J Epidemiol 1995; 5: 11–15.
29) Brink TL, Yesavage JA, Lum O, et al. Screening tests for geriatric depression. Clin Gerontol 1982; 1: 37–43.
30) Yesavage JA, Brink TL, Rose TL. et al. Develop-ment and validation of a geriatric depression screening scale: A preliminary report. J Psychiat Res 1983; 17: 37–49.
31) Yesavage JA. The use of self-rating depression scales in the elderly. In: Poon LW, editor. Clinical Memory Assessment of OlderAdults. Washington D. C.: Am Psych Asso, 1986; 213–217.
32) Yatomi N. The factor structure and item characteris-tics of the GDS (Geriatric Depression Scale) short ver-sion in a Japanese elderly sample. Jpn J Gerontol 1994; 16: 29–36.
33) Bryman A, Cramer D. Analyzing Data with
Com-puters. Bryman A, Cramer D, editors. Quantitative Data Analysis with SPSS Release 8 for Windows: a guide for social scientists. London and New York: Routledge, 1999; 42–54.
34) Tinetti ME, Powell L. Falls e‹cacy as a measure of fear of falling. J Gerontol Soc Sci 1990; 45B: 239–243. 35) Rowe JW, Kahn RL. Successful Aging. New York:
Dell Publishing Company, 1999; 36–52.
36) Haga H. Characteristics and associated factors of functional capacity of the elderly living in a community. In: Shibata H, editor. Long Term Project Research Report: Longitudinal Interdisciplinary Study on Aging from Middle Age. Tokyo: Tokyo Metropolitan In-stitute of Gerontology, 2000; 86–93 (in Japanese). 37) Fujiwara Y, Shinkai S, Amano H, et al. Test-retest
validation in the Tokyo Metropolitan Institute of geron-tology index of competence in community-dwelling ol-der people independent in daily living toward individ-ual assessment of functional capacity. Jpn J Public Health 2003; 50: 360–367 (in Japanese).
38) Fujiwara Y, Shinkai S, Kumagai S, et al. Longitudi-nal changes in higher-level functioLongitudi-nal capacity of an ol-der population living in a Japanese urban community. Arch Gerontol Geriat 2003; 36: 141–153.
39) Imuta H, Yasumura S, Ahiko T, et al. Predictors of functional status among independent and homebound community dwelling elderly: physical, psychological, and social parameters. Jpn J Public Health 2002; 49: 483–496 (in Japanese).
40) Fees BS, Martin P, Poon LW. A model of loneliness in older adults. Journal of Gerontology: Series B, Psych Sci Soc Sci 1999; 4: 2312–39.
41) Gueldner SH, Smith CA, Neal M, et al. Patterns of telephone use among nursing home residents. J Geron-tol Nur 2001; 27: 35–41.
42) Miyakita T, Ueda A. Evaluation of hearing disorders and social support among the middle aged and elderly in the community I: Analysis on the relationship be-tween hearing di‹culties and social participation, and self-rated health. Jpn J Public Health 2000; 47: 571–579 (in Japanese).
43) Wallhagen MI, Strawbridge WJ, Shema SJ, et al. Comparative impact of hearing and vision impairment on subsequent functioning. J Am Geriat Soc 2001; 49: 1086–1092.
44) Cabinet O‹ce: Annual report on the aging society: 2001–2002. Tokyo: Ministry Finance Printing Bureau, 2002; 34–47.