Dynamic analysis of the neighborhood effect in urban geosimulation:
A case of the Tokyo metropolitan area
Yaolong ZHAO and Yuji MURAYAMA
Abstract:
近隣効果は、セル・オートマタ(CA)に基づいた都市ジオシミュレーションモデルを構築する際の重要な要素である。近隣効果の把握には、多くの方法が提案されたが、いまだ研究途上にある。本研究の目的は、東京大都市圏を事例研究として近 隣効果がどのように推移したかを明らかにすることである。趙―村山の近隣相互作用モデルを用いて、1974-79、1979-84、1984-89、
1989-94 における近隣効果を測定した。その結果、土地利用タイプによって近隣効果が異なることが判明した。土地利用タイプによ って、回帰係数が各時期で異なる場合があるが、一般的な傾向は類似性が見られる。このことは時系列的にみて、近隣効果には安 定性があることを示唆している。本分析によって、都市形態と構造を予測することに都市ジオシミュレーションモデルが有効であるこ とが示された。
Keywords:
セル・オートマタ(cellular automata);都市ジオシミュレーション(urban geosimulation);近隣効果(neighborhood effect)1. Introduction
Urban geosimulation is an effective approach to discern, interpret, and especially forecast the change in urban land-use pattern and urban form in the process of urban dynamics (Benenson and Torrens, 2004; Torrens and David, 2001; Batty, 1995). This approach, generally which is based on Geographic Information Systems (GIS) and Cellular Automata (CA), also becomes a hot issue in the field of Geographical Information System and Science (Batty et al., 1999; Clarke and Gaydos, 1998;
Goodchild, 1992).
The local spatial interaction between neighborhood land-use types (i.e. neighborhood interaction) is an important component in urban geosimulation models (Zhao and Murayama, 2007; White et al., 1997). It affects the transformation of land-use types in the process of urban simulation. Traditionally, neighborhood effect in CA-based urban geosimulation models is always assumed as a constant, which keeps stable in past and future process of urban dynamics (White and Engelen, 1993; Wu, 2002). However, question of whether neighborhood interaction keeps stable or not in the process has not been fully examined at both aspects of theoretical and empirical. This status undoubtedly affects user’s confidence in simulated results for the
趙 耀龍:日本学術振興会外国人特別研究員
〒305-8572茨城県つくば市天王台 1-1-1 筑波大学大学院生命環境 科学研究科地球環境科学専攻空間情報科学分野
Tel: 029-853-4502 Fax: 029-853-6879 Email: [email protected]
future of urban development using such models. This research aims at providing an empirical analysis of the dynamics of neighborhood effect in the process of urban growth to support urban geosimulation models using the Tokyo metropolitan area as a case study.
2. Methodology
2.1 Study area and data
The Tokyo metropolitan area comprises most areas of 5 prefectures of Tokyo, Saitama, Ibaraki, Chiba and Kanagawa, with 143 towns and cities. Total area reaches 6383 km
2. The data set of “Detailed Digital Information (10m Grid Land Use) Metropolitan Area” of Tokyo is used, which was produced by the Geographical Survey Institute of Japan, and surveyed in 1974, 1979, 1984, 1989, and 1994. The data set was released in 1998 (Geographical Survey Institute 1998). Herein, 10m grid was grouped into 100m in a majority rule, and original land-use classification was set up into 10 categories.
Where, vacant, industrial, residential, and commercial land are active features; road, public, and special are active passively; Forest & wasteland and cropland are passive; and water is fixed.
2.2 CA-based urban geosimulation
CA has led urban modeling to a new era of
geosimulation (Benenson and Torrens, 2004). The CA is
a rule-based algorithm that has been long employed in
computer science to explore social and physical
phenomena (Wolfram, 2002). CA has many advantages
for modeling urban phenomena, including their decentralized approach, the link they provide to complexity theory, the connection of form with function and pattern with process, the relative ease with which model results can be visualized, their flexibility, their dynamic approach, and also their affinities with GIS and remotely sensed data (Torrens, 2000). For some time now, CA has been in popular use for urban geosimulation (White et al., 1997; White and Engelen, 2000; Yeh and Xia, 2002, 1998; Xia and Yeh, 2000; Wu, 1998, 2002;
Batty, 1998; Batty et al., 1999; Barredo et al., 2003;
Clarke et al., 1997; Clarke and Gaydos, 1998).
Fig 1 illustrates the conceptual framework of urban geosimulation models.
Fig. 1: Urban geosimulation modeling: conceptual framework
2.3 Neighborhood interaction model
Zhao and Murayama’s neighborhood interaction model was used for analyzing the dynamics of neighborhood effect. This model has been well verified in simulating urban growth of the Tokyo metropolitan area (Zhao and Murayama, 2007). The integrated model is based on the theory of Tobler’s first law of geography, Reilly’s law of retail gravitation as well as logistic regression approach. As shown in Fig 2, the extended neighborhood consisting of total 196 cells within the radius of 8 cells from the central cell. It is assumed that
in cellular environment all the cells in the neighborhood contribute to the conversion of developable cell i (central cell). The contribution of one cell is associated with the state of itself and the distance to the developable cell i. It can be expressed as follows:
2 ji j kh
kh
d
G A
f = (1)
Where, f
kh: constribution of one cell j with land-use k in the neighborhood to the transformation of the developable cell i to land-use h for next stage; A
j: area of the cell j; d
ji: the Euclidean distance between the cell j in the neighborhood area and the developable cell i, and G
kh: constant of the effect of land-use k on the transition to land-use h. + stands for positive, – repulsive.
Then the aggregated effect of the cells in the neighborhood can be expressed as:
∑
==
mj kj ji
j kh
kh
I
d G A F
1
2
(2)
Where, m: total number of the cells in the neighborhood, and I
kj: index of cells. I
kj=1, if the state of cell j is equal to k; I
kj=0, otherwise.
Logical regression approach was selected to calculate the probabilities of the transition of cell i under neighborhood effect. The contribution of neighborhood effect to the probability (N
i) of conversion to land-use h of a cell is described as a function of a set of aggregated effect of different land-use types:
mk
m mi
m k
ikh i
ih
ih
I
d A N
Log − N = + ∑ ∑ 2 ' '
)
0( 1 β β (3)
Where, β'
oiand β'
ikhare the coefficients which should be calibrated.
2.4 Significance of regression coefficients
Regression coefficients β'
ikhin formula 3 stand for the effect of different land-use types in the neighborhood on the change of transformation odds (N
ik/(1-N
ik)) of central cell i to land-use type k. If β'
ikhis positive, the odds will add with the increase of aggregated effect of land-use type k; and vice versa. If one of the coefficients does not pass hypothesis test at 0.05 level, β'
ikh= 0. This indicates that corresponding land-use type does not affect the transformation of central cell i. In addition, value of the coefficients represents the intensity of effect on the odds.
The bigger the value is, the more intensity of the effect.
It is obvious that the coefficients are such indices to analyze the effect of land-use types in neighborhood on
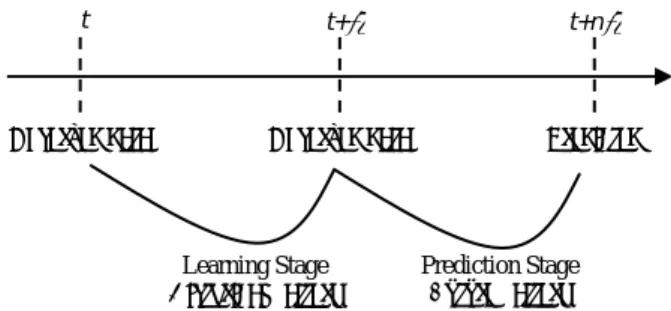
t t+∆t t+n∆t
Observed data Observed data Predicted
Learning Stage Historical pattern
Prediction Stage Future pattern
Fig. 2: An extended neighborhood, consisting of cells at Euclidean distance less or equal to 8 from a central cell
i
Effect of urban land-use on change of vacant land
-0.5 0 0.5 1 1.5 2
vacant industrial residential commercial road public
Urban land-use category
Regression coefficient
1974-79 1979-84 1984-89 1989-94
Effect of urban land-use on change of industrial land
-0.5 0 0.5 1 1.5 2
vacant industrial residential commercial road public
Urban land-use category
Regression coefficient
1974-79 1979-84 1984-89 1989-94
Effect of urban land-use on change of residential land
-0.5 0.0 0.5 1.0 1.5 2.0
vacant industrial residential commercial road public
Urban land-use category
Regression coefficient 1974-79
1979-84 1984-89 1989-94
Effect of urban land-use on change of commercial land
-0.5 0.0 0.5 1.0 1.5 2.0
vacant industrial residential commercial road public
Urban land-use category
Regression coefficient
1974-79 1979-84 1984-89 1989-94
the transformation of cells. Herein, the coefficients were adopted to analyze the dynamics of neighborhood effect in the process of urban growth.
3. Results and discussions
Urban growth of the Tokyo metropolitan area was divided into four stages: 1974-79, 1979-84, 1984-89, and 1989-94. Obviously, increased urbanized area and pattern in one stage are different from that in other stages.
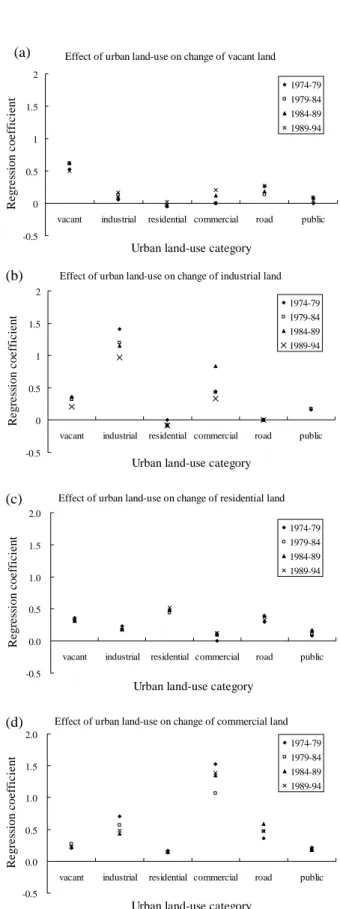
Neighborhood effect model was used to regress the coefficient β'
ikhof different land-use types in the neighborhood for every stage. The coefficients were compared among four stages (Fig 3). Where, horizontal-axis stands for the land-use types which affect the transformation of four active land-use types: vacant, industrial, residential, and commercial land in the neighborhood. Vertical-axis is the value of regression coefficients β'
ikh.
3.1 Characteristics of neighborhood effect
Fig 3 indicates that neighborhood effect is different for the transformation probability to every active land-use type at each stage. For the transformation to vacant land, values of the coefficient of land-use types are correspondingly small except that of vacant (Fig 3a).
This phenomenon comes from the complexity of definition of vacant land, location of which would be determined mostly by other factors rather than neighborhood effect. Fig 3b illustrates that at local interactions, the transformation to industrial land is mostly from the effect of vacant, commercial and itself.
Although effect of residential is low, residential land shows a little repulsive to the transformation. In Fig 3c, all the land-use types do not show strong effect on the transformation to residential land. For the transformation to commercial land (Fig 3d), commercial land shows stronger effect than other types. Effect of vacant, residential and public land shows slight compared with others.
In addition, no matter in which stage, the effect value of regression coefficient of each active land-use type on its own transformation is always more than that of other land-use types, especially industrial and commercial land.
This phenomenon represents the effect of spatial autocorrelation in the spatial process of urban growth in the Tokyo metropolitan area.
(a)
(b)
(c)
(d)
Fig. 3: Comparison of regression coefficient in neighborhood interaction model among stages of urban growth
3.2 Dynamics of neighborhood effect
Comparison of the values of coefficient among four
stages shows the dynamics of neighborhood effect.
Although increased urbanized area and pattern in one stage are different from that in other stages, values of regression coefficient of one land-use type do not shows very obvious variety among stages for every active land-use type generally. This phenomenon shows that neighborhood effect during certain long time period keeps stable in the process of urban growth of the Tokyo metropolitan area. The finding empirically supports the conceptual framework of urban geosimulation models in Fig 1. It indicates that such urban geosimulation models based on this neighborhood effect model have ability and confidence to forecast future urban form and land-use pattern.
Nevertheless, for industrial and commercial land, the differences of effect value of regression coefficient of some land-use types among stages are a little bigger. This maybe represents the change of neighborhood effect of some land-use types on the transformation to one land-use type along with time going. In addition, the tiny difference also would be derived from measure or computation errors. This needs further investigation at next step.
4. Concluding remarks
Neighborhood effect is an important component in CA-based urban geosimulation models. This research indicates that although neighborhood effect is different for the transformation probability of every active land-use type, during certain relatively long time period it keeps stable in the process of urban growth. The results empirically support the conceptual framework of urban geosimulation models, and confirm the ability and confidence of urban geosimulation models based on the calibration using past dataset for predicting urban form and land-use pattern for the future.
Acknowledgement
This research is funded by Japan Society for the Promotion of Science (JSPS) (Project No. 19·07003).
References
Barredo, J.I., Kasanko, M., McCormick, N., Lavalle, C. (2003) Modelling dynamic spatial processes: simulation of urban future scenarios through cellular automata. Landscape and Urban Planning 64, 145-160
Batty, M. (1995) New ways of looking at cities. Nature 377, 574-574 Batty, M. (1998) Urban evolution on the desktop: simulation with the
use of extended cellular automata. Environment and Planning A 30, 1943-1967
Batty, M., Xie, Y., Sun, Z. (1999) Modeling urban dynamics through GIS-based cellular automata. Computers, Environment and Urban Systems 23, 205-233
Benenson, I., Torrens, P.M. (2004) Geosimulation: Automata-based Modeling of Urban Phenomena. Chichester: John Wiley & Sons.
Clarke, K.C., Gaydos, L.J. (1998) Loose-coupling a cellular automaton model and GIS: long-term urban growth prediction for San Francisco and Washington/Baltimore. International Journal of Geographical Information Science 12, 699-714
Clarke, K.C., Hoppen, S., Gaydos, L. (1997) A self-modifying cellular automaton model of historical urbanization in the San Francisco Bay area. Environment and Planning B 24, 247-261
Goodchild, M.F. (1992) Geographical information science.
International Journal of Geographical Information Systems 6, 31-46 Torrens, P.M. 2000. How cellular models of urban systems work:
Centre for Advanced Spatial Analysis (CASA), University of
College London. Original edition, http://www.casa.ucl.ac.uk/how_ca_work.pdf.
Torrens, P.M., David, O.S. (2001) Cellular automata and urban simulation: where do we go from here? Environment and Planning B 28, 163-168
White, R., Engelen, G. (1993) Cellular automata and fractal urban form:
a cellular modelling approach to the evolution of urban land-use patters. Environment and Planning A 25, 1175-1199
White, R., Engelen, G. (2000) High-resolution integrated modelling of the spatial dynamics of urban and regional systems. Computers, Environment and Urban Systems 24, 383-400
White, R., Engelen, G., Uljee, I. (1997) The use of constrained cellular automata for high-resolution modeling of urban land-use dynamics.
Environment and Planning B 24, 323-343
Wolfram, S. (2002) A New Kind of Science. Champaign: Wolfram Media.
Wu, F. (1998) SimLand: a prototype to simulate land conversion through the integrated GIS and CA with AHP-derived transition rules. International Journal of Geographical Information Science 12, 63-82
Wu, F. (2002) Calibration of stochastic cellular automata: the application to rural-urban land conversions. International Journal of Geographical Information Science 16, 795-818
Xia, L., Yeh, A.G.O. (2000) Modeling sustainable urban development by the integration of constrained cellular automata and GIS.
International Journal of Geographical Information Science 14, 131-152
Yeh, A.G.O., Xia, L. (1998) Sustainable land development model for rapid growth areas using GIS. International Journal of Geographical Information Science 12, 169-189
Yeh, A.G.O., Xia, L. (2002) A cellular automata model to simulate development density for urban planning. Environment and Planning B 29, 431-450
Zhao, Y., Murayama, Y. (2007) A new method to model neighborhood interaction in Cellular Automata-based urban geosimulation. Lecture Notes in Computer Science 4488, 550-557