博士論文
Lipodystrophy and cold intolerance in mice lacking Cnot3 in
adipose tissue-specific manner
(脂肪組織特異的 Cnot3 欠損マウスに見られる脂肪異栄養症
と寒冷不耐症
)
Contents
Abstract 3-4
Introduction 5-8
Materials and Methods 9-18
Results 19-31
Discussion 32-37
References 38-50
Acknowledgements 51-53
Abstract
Lipodystrophy is a pathological state characterized by a complete or partial loss
of adipose tissue that, occurs in combination with lipid accumulation in ectopic sites in
the body. Patients with lipodystrophy suffer from metabolic consequences, including
severe insulin resistance, dyslipidemia, hepatic steatosis, and diabetes mellitus.
Elucidation of the mechanisms underlying lipodystrophy is expected to help develop
therapeutic strategies for lipodystrophy and related metabolic complications.
CNOT3 is a non-catalytic component of the mammalian CCR4-NOT deadenylase
complex, whose molecular and physiological functions remain to be established.
Accumulating data suggest that one role of CNOT3 may be related to the control of
energy metabolism. In this study, I depleted the Cnot3 gene specifically in mouse
adipose tissues to address its physiological significance in energy metabolism. The loss
of CNOT3 caused a marked reduction in the amount of white adipose tissue, by contrast,
loss of CNOT3 caused hypertrophy of brown adipose tissue containing fat-laden cells
resembling immature white adipocytes. Furthermore, depletion of CNOT3 from adipose
tissues induced hyperinsulinemia and hyperglycemia that were associated with insulin
elevated and lipids accumulated ectopically in the liver. These results suggested that
CNOT3 depletion in adipose tissues generated many of the features of lipodystrophy. I
further found that CNOT3 depletion increased apoptosis in peripheral adipocytes and
was associated with aberrant fat storage and lipid release; these changes could be a
direct cause of the lipodystrophic phenotype of adipose tissue-specific Cnot3 knockout
mice. Finally, to better define the observed lipodystrophic phenotypes, I compared the
gene expression profiles of adipose tissue-specific Cnot3 knockout mice and two
phenotypically similar lipodystrophic mouse models, aP2-nSrebp1c mice, which
overexpress SREBP1, and Ppargldi/+ mice, which conditionally overexpress PPARγ.
The results revealed a substantial overlap in gene aberrations that could define a
common signature of lipodystrophy.
By revealing the lipodystrophic phenotype caused by the deletion of Cnot3
specifically in adipose tissue, this study provides a novel fundamental basis for better
understanding the physiological significance of CNOT3 in the control of energy
metabolism Furthermore, the results of this study raise the intriguing possibility that
CNOT3 and the CCR4-NOT deadenylase complex could serve as therapeutic targets to
Introduction
Adipose tissue has two essential biological roles in controlling energy balance
and lipid homeostasis: first, it is the major storage site of excess energy in the form of
triglycerides and, second, it is an important endocrine organ that synthesizes and
secretes hormones and adipokines (Kershaw and Flier, 2004). Dysfunction of adipose
tissue can result in not only obesity (an excess of adipose tissue) but also lipodystrophy
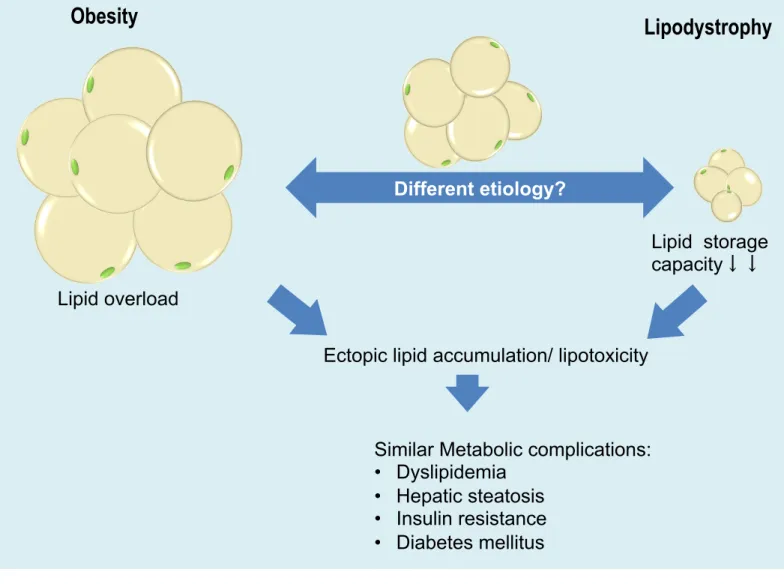
(a deficiency of adipose tissue). Although these two conditions are opposite
pathological states of adipose tissue mass, they are both accompanied by similar
metabolic consequences, including dyslipidemia, hepatic steatosis, severe insulin
resistance, and diabetes mellitus (Figure 1). Lipodystrophy can be caused by either
genetic or acquired factors and can be classified as either generalized or partial,
depending on the degree and locality of the fat (Garg A., 2000). Currently, the most
common form of lipodystrophy is induced by the protease inhibitors used to treat
HIV-infected AIDS patients (Hegele et al., 2007; Caron-Debarle et al., 2010) and
affects up to 50% of the patients. Thus, elucidating the mechanisms that underlie
lipodystrophy is extremely important for developing therapeutic strategies for not only
The CCR4-NOT complex is an evolutionarily conserved complex that has been
implicated in the control of multiple steps of mRNA metabolism, including repression
and activation of transcription, elongation of mRNA, and deadenylation and subsequent
degradation of mRNA (Collart, 2012). Given these diverse activities, it is not surprising
that this complex is relevant to a wide range of biological functions. The CCR4-NOT
complex plays important roles in cell proliferation, apoptosis, oogenesis and
embryogenesis, spermatogenesis, heart function, bone formation and energy metabolism
(Collart, 2003; Berthet et al, 2004; Nakamura et al., 2004; Nakashima et al. 2007,
Morita et al, 2007; Washio-Oikawa et al, 2007). Recent evidence shows that aberrant
regulation of this complex causes metabolic abnormality, heart disease, and
osteoporosis (Morita et al., 2011; Neely et al., 2010; Watanabe et al., 2014). CNOT3 is
a non-catalytic component of the CCR4-NOT complex and is involved in recruitment of
the CCR4-NOT to the 3' end of specific mRNAs (Morita et al., 2011) (Fig.2). Mice
haplodeficient in Cnot3 are lean because of poor fat accumulation. Liver size white and
brown adipose tissues (WAT and BAT, respectively) are reduced in these mice, and
adipocytes are smaller than those in wild-type mice (Morita et al., 2011). These data
reduction in CNOT3 levels affects the expression of mRNAs that encode proteins that
are important for lipid metabolism, glucose metabolism, oxidative phosphorylation, and
growth regulation in the liver (Morita et al., 2011). However, the mechanism by which
Cnot3 regulates the lipid metabolism in adipose tissue remains unknown.
In this study, to understand the role of Cnot3 in adipose tissue, and particularly
the relevance of CNOT3 in fat mass and energy metabolism, I specifically depleted
Cnot3 from mouse adipose tissue using the cre/loxP system. I show that mice with
adipose tissue-specific depletion of Cnot3 share many of the features reported in human
patients with Congenital Generalized Lipodystrophy (CGL) (Agarwal et al., 2006) and
in other lipodystrophy mouse models (Savage, 2009), such as aP2- nSrebp1c mice (Sr),
which express a truncated, constitutively active Srebp-1c transgene in adipocytes
(Shimomura et al. 1998). These features include a marked reduction in the amount of
white adipose tissue, hypertrophy of brown adipose tissue containing fat-laden cells
resembling immature white adipocytes, and hyperinsulinemia and hyperglycemia that
are associated with insulin resistance and glucose intolerance. Accordingly, plasma
insulin sensitive organs.
I further provide evidence that CNOT3 depletion increased apoptosis in
peripheral adipocytes and was associated with aberrant fat storage and lipid release,
which could be a direct cause of the lipodystrophic phenotype of mice lacking Cnot3 in
a manner specific to adipose tissue. To examine the underlying mechanisms, I have
compared the gene expression profiles of wild-type and mice that lack Cnot3in adipose
tissue. The results show that pathways involved in apoptosis and inflammation were
significantly up-regulated in mice in which Cnot3 is depleted in adipose tissue. The
microarray data also revealed that the expression of SREBP (SREBF) target genes was
up-regulated in the adipose tissues of mice in which Cnot3 is depleted. Taken together,
these data suggest that Cnot3 depletion in adipose tissue confers the lipodystrophic
phenotype on mice through apoptosis induction and inflammation and that
CNOT3-deficiency contributes to lipodystrophy by regulating a subset of mRNAs,
including Srebp1 mRNA. Thus, CCR4-NOT deadenylase may be a potential therapeutic
target for lipodystrophy and the metabolic disorders in HIV-associated lipodystrophy
Materials and Methods
Mice
Generation of Cnot3-deficient mice and mice with a floxed Cnot3 locus
(Cnot3lox/+) were described in previous study (Morita et al., 2011). The Cnot3lox/+ mice
were backcrossed to C57BL/6J mice for at least 8 generations before interbred to
generate Cnot3lox/lox mice. Cnot3ad-/- mice were generated by crossing Cnot3lox/lox mice
with transgenic mice expressing Cre recombinase under the control of the adiponectin
promoter (Eguchi et al., 2011). Cnot3lox/lox mice were bred with Adipoq-cre mice to
obtain initially heterozygotes Cnot3lox/+,cre/+. Cnot3lox/+,cre/+ mice were mated with
Cnot3lox/lox mice to generate Cnot3ad-/- mice. Genotyping was performed by PCR with
specific primers as follows: wild-type-5’: 5’-CCAGTCTATCTGATGTGGAATTCCTC
CATG-3’, wild-type-3’: 5’-AGGCTGGCAGCTCCTGGAAAGGCTAAGAGG-3’, Cre
-5’: 5’-AGCGATGGATTTCCGTCTCT-3’, Cre-5’: 5’-CACCAGCTTGCATGATCT
CC-3’. PCR amplification of genomic DNA was performed by cycling 30 s at 94 °C, 30
Mice were housed in cages and maintained on a 12-h light–dark cycle, and they
had access to water ad libitum. Mice were fed a normal chow diet (NCD) (CA-1, CLEA
Japan Inc.) or a HFD (HFD32, CLEA Japan Inc.). For fasting analysis, mice were
housed individually and deprived of food for 24 h.
For cold exposure experiments, mice were housed individually without food and
bedding immediately before the start of experiments. Mice were allowed free access to
water and placed at 4 °C while core body temperature was monitored every hour using a
rectal probe.
Unless indicated otherwise, male mice at 8–12 weeks of age were used for
experiments. Experiments were conducted according to the guidelines for animal use
issued by the Committee of Animal Experiments, Institute of Medical Science,
University of Tokyo, and Okinawa Institute of Science and Technology Graduated
School.
Blood analysis
For glucose tolerance tests, mice were fasted for 16 h. NCD and HFD mice were
tolerance tests, NCD mice and HFD mice were given human insulin (1 mU/g body
weight). Blood glucose was measured from tail blood using the glucose oxidase method
(Sanwa Kagaku). Levels of serum triglycerides and insulin were determined using a
Triglyceride E-Test (Wako) and a Mouse Insulin ELISA Kit (Morinaga), respectively.
Metabolic studies
Whole-body energy metabolism was evaluated using a Comprehensive Lab
Animal Monitoring System (CLAMS, Columbia Instruments). Animals were placed
individually in chambers at ambient temperature (25°C) with 12-h light/dark cycles,
VO2 is expressed as the volume of O2 consumed per kg0.75 weight per hour. VO2,
carbon dioxide production, and the respiratory quotient were analysed during a 24-h
time period. Continuous measurements were obtained over a 72-h time period. Mice
were acclimated in the chambers for 2 days before the experiment to minimize the
changes in housing environments.
For measurement of food consumption, 8-week-old Cnot3ad-/- mice and wild type
controls (n = 4 each) were housed individually, consumption of foods and body weight
electronic thermistor (Model BAT-12) equipped with a rectal probe (RET-3, Physitemp)
was used as described (Oike et al, 2005).
The high-fat diet study with 8-week-old Cnot3ad-/- mice and wild type controls (n
= 4 each) was followed for a period of 12 weeks.
Magnetic Resonance Imaging
Magnetic resonance imaging with an 11.7 Tesla Magnetic Resonance scanner
(Bruker, Billerica, MA, USA) was performed on 2% isofluorane-anaesthetized mice.
The software Fiji (NIH, USA) was used for image analysis.
Histological analysis of tissue
After dissection, all tissues were fixed in 10% formaldehyde overnight.
Paraffin-embedded sections were analyzed by haematoxylin and eosin staining.
Morphometric analysis of adipose tissues from 500 cells per genotype was performed
with Photoshop. For oil-red-O staining, the liver was frozen embedded.
Rabbit polyclonal antibodies against CNOT1, CNOT3, CNOT6L, CNOT7, and
CNOT9 were as described (Morita et al, 2007). Mouse monoclonal antibody against
CNOT3 was purchased from Abnova. Anti-Akt (#9272) and anti-phospho-Akt
(Ser-473) (#9271) antibodies were purchased from Cell Signaling Technology.
Anti-tubulin (T9026) and anti-GAPDH (#2118) were purchased from Sigma-Aldrich
Co. and Cell Signaling Technology, respectively. Anti-perilipin (#9349S) was
purchased from Cell Signaling Technology. Horseradish peroxidase-conjugated
anti-rabbit IgG and anti-mouse IgG were from Amersham Biosciences. Human insulin
was from Eli Lilly and Co.
Immunoblotting
Tissues were homogenized in lysis buffer (1% NP-40, 50mM Tris–HCl (pH 7.5),
150mM NaCl, 1mM EDTA, 1mM phenylmethylsulfonyl fluoride, 1mM NaF, 1mM
Na3VO4) using a glass homogenizer and centrifuged for 10 min at 4℃. Protein
concentrations were measured by the Bio-Rad protein assay. Proteins in the lysates were
electrophoresed in SDS-polyacrylamide gel and then transferred onto Immobilon-P
RNA analysis
For real-time PCR, total RNAs (1µg) were used for reverse transcription with
oligo(dT) 12–18 primer (Invitrogen) using the SuperScript III First-Strand Synthesis
System (Invitrogen). Real-time quantitative PCR reactions were carried out using
SYBR Premix Ex Taq (Takara) and the ABI PRISM 7900HT Sequence Detection
System (Applied Biosystems). 36B4 mRNA levels were used for normalization.
To measure mRNA stability, cells were treated with actinomycin D (5 mg/ml), and total
RNAs were extracted at the indicated time points and subjected to qPCR analysis. The
amount of reporter mRNAs was normalized to that of 36B4 mRNA.
Preparation of Primary MEF Cells
Primary MEF cells were isolated from E14.5 embryos. Embryos were removed
and separated from maternal tissues and yolk sack and were finely minced, digested
with 0.05% trypsin/ 1 mM EDTA for 30 min at 37°C, and centrifuged for 5 min at
1000g. The pellet was resuspended in culture medium before plating. Cells were
penicillin/streptomycin (Invitrogen). Experiments were performed at passage 2.
Adipocyte differentiation
White adipocyte differentiation was induced by treating confluent cells with
medium containing 10% FBS, 0.5 mM methylisobutylxanthine, 1µMdexamethasone
(DEX), 5 µg/ml insulin. Two days after induction, the medium was replaced with the
maintenance medium containing 10% FBS, 5 µg/ml insulin. Brown adipocyte
differentiation was induced by treating confluent cells with DMEM containing 10%
FBS, 0.5mM isobutylmethylxanthine, 125 mM indomethacin, 2 mg/ml dexamethasone,
5 µg/ml insulin, 1 nM T3 and 0.5 mM rosiglitazone. Two days after induction, cells
were switched to the maintenance medium containing 10% FBS, 5 µg/ml insulin, 1nM
T3 and 0.5 mM rosiglitazone. Medium was renewed every 2 days.
Oil-red-O staining.
After 8 days of differentiation, cells were washed once in phosphate-buffered
saline and fixed with 10% neutral buffered formalin solution (Sigma) for 15 min. The
isopropanol; before using, dilute six parts Oil Red-O stock with four parts distilled
water, after 1 h at room temperature, the staining solution was filtered and added to
dishes for 4 h. The staining solution was then removed, and cells were washed twice
with distilled water.
Immunohistochemistry
Immunohistochemistry was performed using 4µm thick formalin-fixed,
paraffin-embedded tissue sections. Briefly, slides deparaffinized in xylene were passed
through graded alcohols and into PBS. Slides were then pretreated with 10 mM sodium
citrate buffer, pH 6.0 kept at 121°C for 15 min using an autoclave (TOMY), followed
by washing in PBS. Subsequent steps were performed at room temperature in a
hydrated chamber. Slides were immersed in 3% H2O2 solution in absolute methanol at
RT for 15 min to quench endogenous peroxidase activity. For macrophage staining:
monoclonal rat anti-murine Mac2 (clone M3/38, Cedarlane) at 1:1000 was used. For
apoptosis: monoclonal rabbit anti-murine Caspase3 antibody (Cell Signaling #9664) at
1:100 was used. For perilipin, monoclonal rabbit anti-perilipin (Cell Signaling #9349) at
Simple Stain Rat or Rabbit MAX PO (M) respectively. After further washing, brown
immunoperoxidase staining was developed using a DAB chromogen (N-Histofine) and
counterstained with hematoxylin (blue). Slides were examined and images were
acquired with a fluorescence microscope (BZ-9000 All-in-one, KEYENCE).
Lipolysis assay
Epididymal fat pads from 4-5 mice were collected and digested in a digestion
buffer (121 mM NaCl, 4.9 mM KCl, 1.2mM MgSO4, 0.33 mM CaCl2, 12 mM HEPES)
containing dipase II (2.4 Uml-1), collagenese D (1.5 Uml-1), 3 mM glucose and 1 %
fatty-acid-free BSA (Sigma). After digestion for 40 min at 37 °C with shaking,
adipocytes were filtrated through nylon mesh and centrifuged at 200 g for 5 min.
Floating adipocytes were collected and incubated in DMEM containing 10 % FBS with
or without isoproterenol (1 mM) for 1.5 h at 37 °C. Glycerol released into the media
was determined by using a free glycerol reagent (Sigma), the amounts of glycerol were
normalized to the total protein content of the adipocytes by using a Pierce BCA Protein
Microarray analysis
Total RNAs were extracted with ISOGEN according to the manufacturer’s
protocol (Nippon Gene) and purified with an RNeasy Kit (Qiagen). cDNA and
biotin-labelled cRNA were synthesized according to the protocols from Affymetrix.
After fragmentation of cRNA, 20 mg biotin-labelled cRNA was hybridized to the
GeneChip Mouse Genome 430 2.0 Array. To determine the average difference for each
probe set, a global normalization method (Robust Multi-array Average) was used.
Selected probe set IDs were converted to the manufacture’s annotation. Enrichment of
pathway was analyzed by Fisher’s exact test followed by Bonferonni’s correction.
Microarray data of aP2- nSrebp1c mice (Sr) and Ppargldi/+ mice was obtained from the
Gene Expression Omnibus (GEO) database, www.ncbi.nlm.nih.gov/geo (accession no.
GSE9132).
Statistical analyses
All values represent mean values ± standard error of the mean (SEM).
Differences between groups were examined for statistical significance using Student’s
t-test (two tailed distribution with two-sample equal variance). P<0.05 was considered
Results
Targeted deletion of Cnot3 in mouse adipose tissues
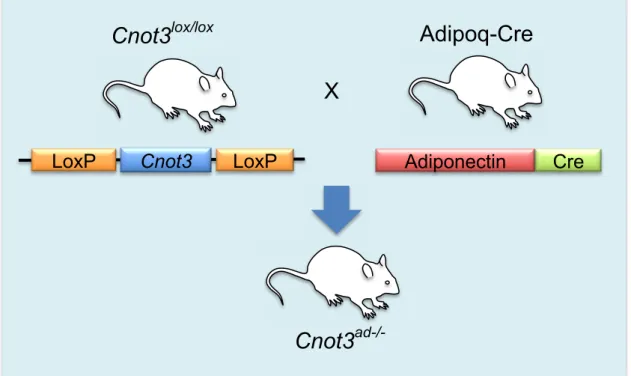
To understand the role of Cnot3 in adipose tissue, I generated mice in which Cnot3
was knocked out specifically in adipose tissues (hereafter referred to as Cnot3ad-/-).
LoxP sites were introduced on either side of exons 2-9 of Cnot3 to generate floxed
Cnot3 mice (Cnot3lox/lox) (Morita et al., 2011), and these mice were crossed with
Adipoq-cre mice that express Cre recombinase under the control of the
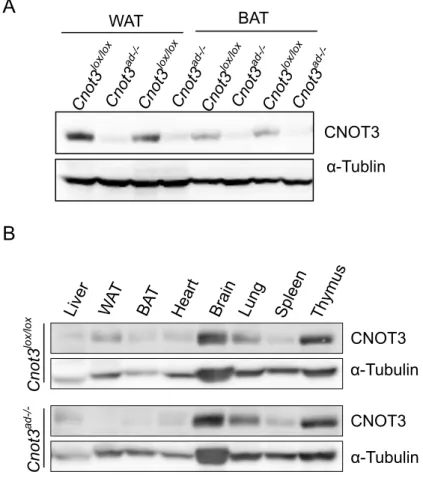
mouse adiponectin (Adipoq) promoter (Eguchi et al., 2011) (Figure 3). Immunoblotting
confirmed the absence of CNOT3 expression specifically in white adipose tissue
(WAT) and interscapular brown adipose tissue (BAT) (Figure 4A), with unaltered
CNOT3 expression in the liver, spleen and other tissues (Figure 4B).
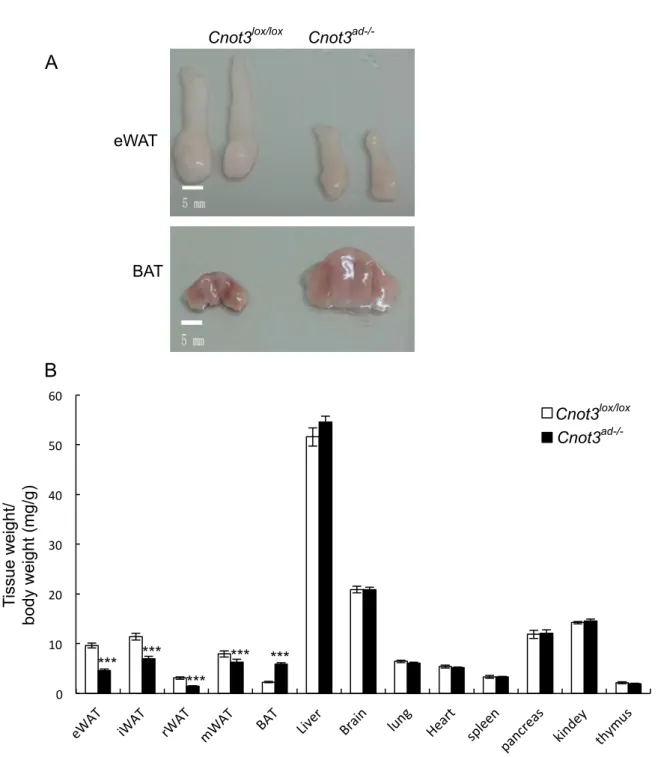
Cnot3ad-/- mice exhibit lipodystrophy
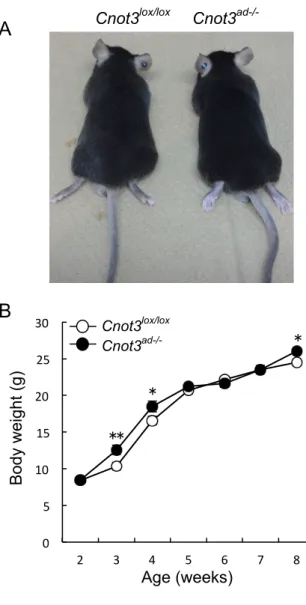
Cnot3ad-/- mice were born at the expected Mendelian frequency, and there were no
obvious morphological differences from control mice (Figure 5A). Although Cnot3
haplodeficient mice were lean, Cnot3ad-/- mice were unexpectedly normal in size on a
compared with controls (Figure 5B). Dissection of Cnot3ad-/- mice revealed the
following: (1) severely reduced epididymal WAT pads (eWAT) (Figure 6A) and
subcutaneous, retroperitoneal, and mesenteric WAT pads (scWAT, rWAT, mWAT)
(Figure 6B); and (2) markedly increased interscapular brown adipose tissue (BAT)
(Figures 7A and B) that was pale in appearance. The sizes of other tissues in Cnot3
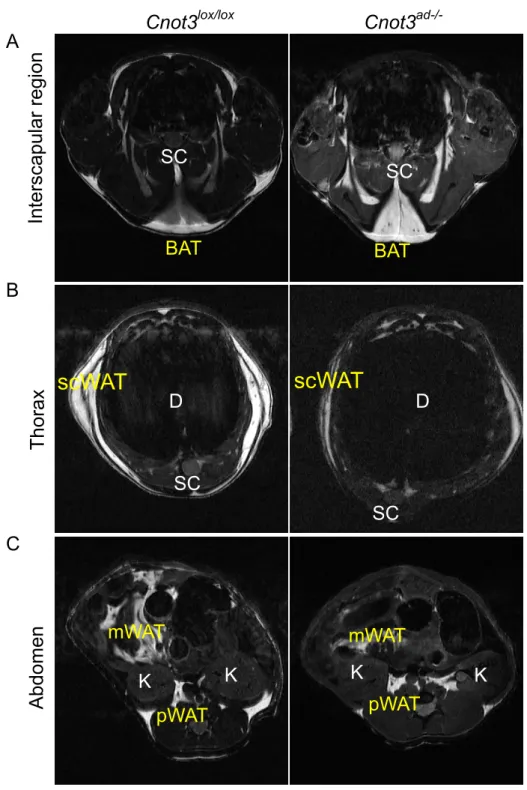
ad-/-mice were not different from wild-type ad-/-mice. Whole-body magnetic resonance imaging
(MRI) analysis revealed a significant and global reduction in white adipose tissue mass,
including subcutaneous, perigonadal, and mesenteric depots (Figures 7B and C). By
contrast to the gross loss of WAT, cross-sectional examination of the interscapular
region revealed enlarged BAT depots with increased lipid content (Figure 7A).
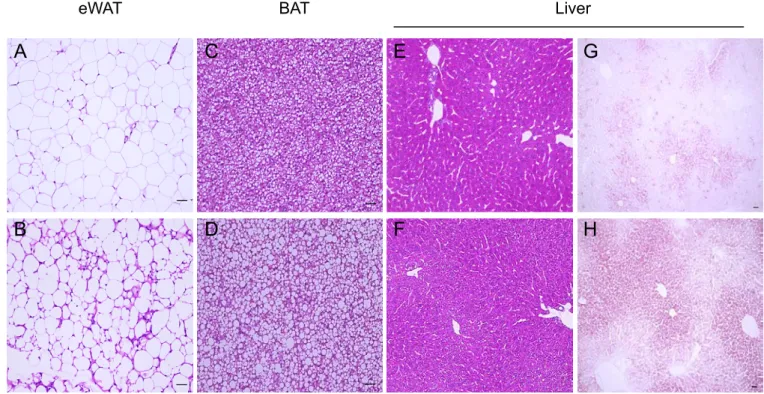
Comparison of Cnot3ad-/- mice and wild-type control mice by histological analysis
using hematoxylin and eosin (H&E) staining revealed the following: (1) Cnot3ad-/- mice
showed irregular sizes of white adipocytes and fibrotic WAT stroma (Figures 8A and
B); (2) brown adipocytes in Cnot3ad-/- mice contained unilocular lipid deposition similar
to that seen in immature white adipocytes (Figures 8C and D); and (3) increased lipid
droplet accumulation was observed in hepatocytes from Cnot3ad-/- mice (Figures 8E and
ad-/-mice compared with their wild-type littermates (Figures 8G and H). These observations
suggested abnormal lipid accumulation in the liver and BAT of Cnot3ad-/- mice. Notably,
these phenotypes of Cnot3ad-/- mice shared many of the features reported in human
patients with Congenital Generalized Lipodystrophy (CGL) (Agarwal et al., 2006) and
in mouse models of lipodystrophy, particularly aP2-nSrebp1c mice (Sr) (Shimomura et
al. 1998).
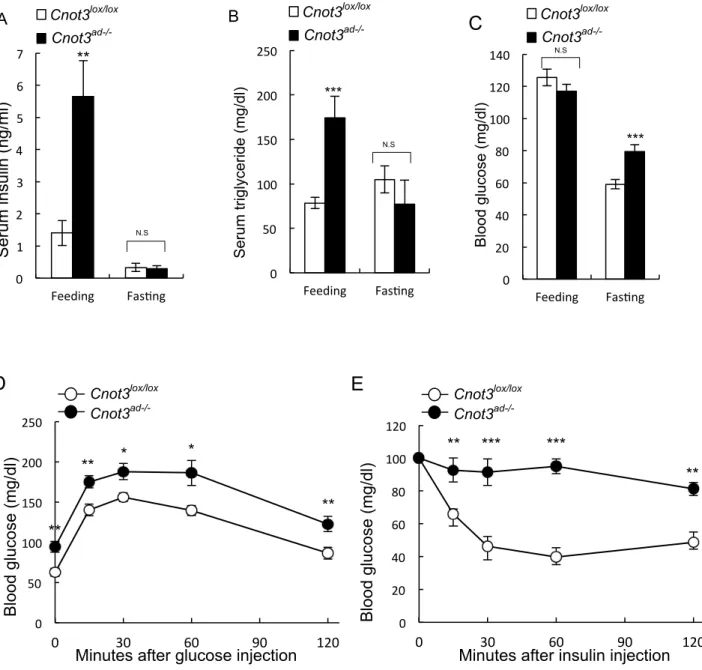
To further confirm the lipodystrophic phenotype of Cnot3ad-/- mice, I compared the
levels of circulating metabolic parameters between wild-type and Cnot3ad-/- mice.
Cnot3ad-/- mice displayed typical metabolic sequelae of lipodystrophy, including
hyperinsulinemia (Figure 9A), increased levels of circulating triglycerides (Figure 9B),
hyperglycemia under fasting condition (Figure 9C), glucose intolerance (Figure 9D) and
severe insulin resistance (Figure 9E).
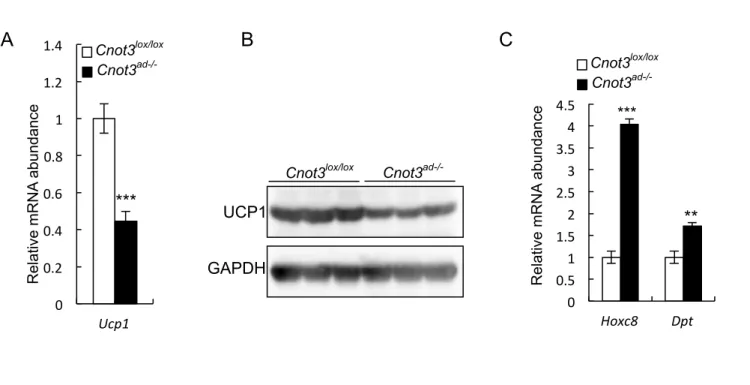
Impaired thermogenic responses in Cnot3ad-/- mice
In rodents, one of the key mechanisms for heat generation and energy dissipation
deposition in Cnot3ad-/- BAT, I hypothesized that BAT function was impaired. In the
BAT of Cnot3ad-/- mice, expression of the BAT-specific uncoupling protein gene Ucp1
was significantly decreased (Figures 10A and B). This change in BAT architecture
suggested that, in an effort to increase their fat storage capabilities, Cnot3ad-/- mice
transdifferentiate BAT to a more WAT-like phenotype. To address this possibility, the
expression of the white fat markers HoxC8 and Dpt in BAT were analyzed using
qRT-PCR (Sanchez-Gurmaches et al., 2012). Indeed, the BAT of Cnot3ad-/- mice
showed higher expression of the white fat markers HoxC8 and Dpt compared with
wild-type mice (Figure 10C).
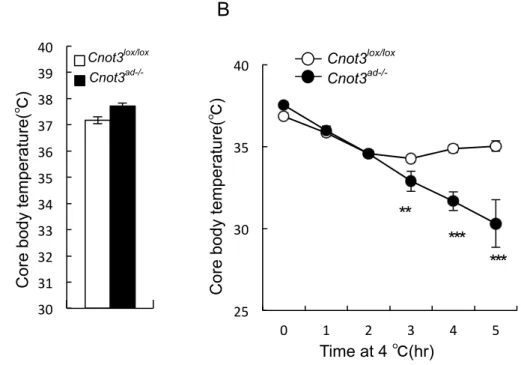
Because the BAT of Cnot3ad-/- mice appeared to be dysfunctional as a result of
excess lipid accumulation, I assumed that thermogenesis in Cnot3ad-/- mice was
impaired. Direct measurement of resting core body temperatures showed no significant
differences between Cnot3ad-/- and wild-type mice (Figure 11A). To further assess
thermogenic capacity and determine whether increased adaptive thermogenesis
contributes to the enhanced energy expenditure in Cnot3ad-/- mice, we exposed
8-week-old Cnot3ad-/- and wild-type mice to a 4°C environment. Whereas wild-type
exposure, Cnot3ad-/- mice were intolerant to cold exposure and their body temperature
dropped to 30°C by the end of a 5 h cold exposure (Figure 11B). These observations
suggest that Cnot3 deficiency impaired acute cold-induced thermogenesis.
Increased energy expenditure in Cnot3ad-/- mice
Because reduced adiposity indicates an energy balance disorder, it was necessary
to address whether the reduced white adipose tissue size in Cnot3ad-/- mice resulted from
increased energy expenditure. The energy available in food can be liberated in the body only as a result of oxidations, which ultimately depend on a supply of oxygen from the air, thus, a measurement of the oxygen uptake by the body is also a measure of energy expenditure (Durnin, 1984). Oxygen consumption (VO2) and carbon dioxide production (VCO2) occur during the oxidation of carbohydrate, protein, and fat. Heat production can be calculated from a measurement of VO2 and/or VCO2 (SparkNotes.com, 2014). I measured food intake and found that the rate of food intake per day was similar between Cnot3ad-/- and wild-type chow-fed mice (Figure 12). Next,
whole-body energy metabolism was measured by monitoring oxygen consumption.
carbon dioxide production compared with control mice (Figures 13A, B, C and D). The
respiratory exchange ratio (RER) did not show significant differences in fuel source
usage (Figures 13E and F). These observations demonstrated that the deletion of
CNOT3 in adipose tissues enhanced energy expenditure.
Because Cnot3ad-/- mice have smaller adipose stores (Figures 5 and 6), they
assumed to exhibit symptoms of cold stress even at 22°C. Indeed, Ucp1 mRNA levels
in the white adipose tissue of Cnot3ad-/- mice housed at 22°C were markedly elevated
(Figure 14), suggesting exaggerated cold stress. Thus, the increased metabolic rate in
Cnot3ad-/- mice might be a compensatory response to maintain normal body temperature
in the absence of white adipose tissue. An increased resting energy expenditure (REE)
also has been observed in human lipodystrophy syndromes (Cutler et al., 1991; Klein et
al., 1992; Kosmiski et al., 2001). The increased energy expenditure in human
lipodystrophy syndromes seems to be an adaptive response to an inability to store
triacylglycerol fuel in a normal manner, which may represent a defense mechanism to
protect non-adipose tissues from further lipid accumulation (Kosmiski et al., 2007).
Because an increased lipolysis rate results in reduced adiposity, I next performed
an ex vivo lipolysis assay to examine whether the lipolysis rate was increased in the
WAT of Cnot3ad-/- mice. Primary adipocytes from the epididymal fat pads of wild-type
and Cnot3ad-/- mice were isolated, and their lipolysis rates were compared.
Unexpectedly, primary adipocytes from Cnot3ad-/- mice showed severely impaired
lipolysis (Figure 15). These observations suggested that the reduced adiposity in
Cnot3ad-/- mice was not caused by increased lipolysis.
Adipose tissue inflammation and apoptosis in Cnot3ad-/- mice
The white adipose tissue of Cnot3 ad-/- mice was unusual, having mononuclear cell
infiltration and fibrotic stroma. The presence of inflammatory cell infiltration was
further evaluated using quantitative RT-PCR. The expression of mRNAs corresponding
to macrophage-related proteins were elevated in epididymal WAT and BAT from
Cnot3ad-/- mice; these proteins included the chemokine MCP-1, the surface antigen
Emr1 (recognized by an F4/80 antibody), and the macrophage transcription factor PU.1
(Figures 16A and B). Immunohistochemistry for MAC-2 (also known as galectin-3), a
inflammatory responses, identified an increased number of MAC-2-positive
macrophages in both epididymal WAT and BAT from Cnot3 ad-/- mice compared with
wild-type littermates. Macrophages in the surrounding remnants of lipid droplets of
adipocytes were sometimes observed to form crown-like structures (CLSs) in the WAT
of Cnot3 ad-/- mice, whereas these structures were almost absent from the WAT of
wild-type mice (Figures 16C and D). Dramatically increased numbers of macrophages
were also present and formed CLSs near adipocytes in the BAT of Cnot3 ad-/- mice
(Figures 16E and F).
The appearance of macrophages in the WAT and BAT of Cnot3 ad-/- mice
suggested the presence of at dead adipocytes. To confirm this, immunohistochemistry
was performed using an antibody against perilipin, an essential protein that coats lipid
droplets. The absence of perilipin staining indicates dead or dying adipocytes. The
results showed that the number of perilipin-negative cells in the epididymal WAT of
Cnot3ad-/- mice was increased compared with littermate controls (Figures 17A and B),
indicating that adipocytes were dying in the epididymal WAT of Cnot3ad-/- mice.
Perilipin immunohistochemistry demonstrated that CLSs were selectively formed near
I next tried to determine the causes of adipocyte death and the decrease in the
size of white adipose tissue in Cnot3ad-/- mice. Immunohistochemical staining with
anti-cleaved-caspase-3 antibodies revealed that the numbers of apoptotic cells in both
WAT and BAT from Cnot3ad-/- mice were increased compared with control littermates
(Figures 18A-D). The data suggested that adipocyte death was accelerated in the
diminished WAT and hypertrophic BAT of Cnot3ad-/- mice. The massive apoptosis of
metabolically active adipocytes clearly demonstrates that adipocyte destruction is the
dominant pathological process involved in the loss of adipose tissue. It was
hypothesized that increased apoptosis of peripheral adipocytes with impaired fat storage
and lipid release may cause the lipodystrophic phenotype of Cnot3 ad-/- mice. Microarray
analysis was conducted to compare the gene expression profiles of epididymal fat pads
in Cnot3ad-/- mice and their wild-type littermates. The results showed that pathways
involved in apoptosis and inflammation were significantly up-regulated in Cnot3
ad-/-mice (Table 1). The microarray data also revealed that expression of the
SREBP/SREBF target gene was up-regulated. I focused on this gene because mice
overexpressing the constitutively active Srebp-1c (one of the isoforms of Srebp1)
1998). Quantitative RT-PCR analysis confirmed that the expression level of Srebp1 was
significantly up-regulated in both WAT and BAT of Cnot3ad-/- mice (Figures 29A and
B).
Common alterations in gene expression between Cnot3ad-/- mice and other
lipodystrophy models
To further characterize the lipodystrophic phenotype in Cnot3ad-/- mice, compared
the gene expression profiles of Cnot3ad-/- mice with those of two lipodystrophy model
mice: aP2- nSrebp1c mice (Sr), which express the constitutively active Srebp-1c
transgene in adipocytes, and Ppargldi/+ mice, which are generated by inserting the Tet
activator (tTA) and a tTA-regulated Flag-Pparg1 transgene into the Pparg gene. In total,
772, 722 and 751 transcripts were up-regulated >2.5-fold in the WAT of Cnot3ad-/-,
Ppargldi/+ and Sr epididymal fat pads, respectively, relative to their wild-type littermates
(Figure 20). Of these, 100 genes were common among the three strains (Table 3). This
the molecular basis of the lipodystrophic phenotype among the three strains, and those
common genes may represent a typical signature of lipodystrophic fat.
Resistance to diet-induced obesity and enhanced energy expenditure in Cnot3ad-/-
mice
Because Cnot3ad-/- mice exhibited reduced fat mass and increased energy
expenditure under chow-fed condition, I next determined whether they would be
resistant to weight gain when challenged with a high-fat diet. Cnot3ad-/- mice and
wild-type littermates were fed a high-fat diet (HFD) for 3 months. During HFD feeding,
Cnot3ad-/- mice gained significantly less weight than their wild-type littermates (Figure
21A and B). At the end of the HFD period, the net weight gains of wild-type and
Cnot3ad-/- mice were 18.15 ± 0.68 g and 9.73 ± 1.39 g, respectively (Figure 21C).
Cnot3ad-/- mice fed an HFD exhibited exacerbated lipodystrophy symptoms; their white
adipose tissue size was dramatically reduced and brown adipose tissue was extremely
hypertrophic compared with their wild-type littermates (Figures 22A and B).
Whole-body magnetic resonance imaging (MRI) studies confirmed the exacerbated
The observed resistance to obesity in Cnot3ad-/- mice suggested altered food
intake or energy metabolism. Higher energy expenditure was observed by indirect
calorimetry during both day and night cycles in Cnot3ad-/- mice (Figures 24A and B),
even when their food intake was significantly increased (Figure 25A). The increase in
oxygen consumption on the high-fat diet was approximately 17.4±0.5% and 17.1±0.6%
during the light and dark phases, respectively. No differences were observed in the
respiratory exchange ratio (RER) (Figures 24E and F). Despite increased energy
expenditure, there was no difference in core body temperature between wild-type and
Cnot3ad-/- mice (37.1±0.3°C and 37.5±0.2°C, respectively) (Figure 25B). These
observations suggest that the Cnot3ad-/- mice were protected from obesity on a high-fat
diet because of a significant increase in energy expenditure. The maintenance of normal
body temperature despite increased energy expenditure indicated that because of the
exacerbated lipodystrophy, increased energy expenditure is an adaptation to maintain
body temperature in the absence of WAT.
Glucose and insulin tolerance tests were then performed in Cnot3ad-/- and
wild-type mice. Surprisingly, in contrast to other models of lipodystrophy that exhibited
2008), HFD-fed Cnot3ad-/- mice exhibited improved glucose tolerance and comparable
insulin resistance compared with their wild-type littermates (Figures 26A and B).
Morphological examination revealed that although the adipocytes of Cnot3ad-/- mice
WAT were significantly smaller than those of wild-type mice (Figures 27A and B),
lipid accumulation in the BAT and liver were at the same level compared with
wild-type littermates (Figures 27C-F). Taken together, these observations indicate that
although Cnot3ad-/- mice fed an HFD exhibited exacerbated lipodystrophy, but the
metabolic consequences, such as glucose intolerance, insulin resistance and ectopic
Discussion
The CCR4-NOT complex contains at least 10 subunits. Aberrant regulation of
several subunits of this complex, including CNOT1, CNOT3, CNOT6, CNOT6L,
CNOT7, and CNOT8, has been implicated in the development of metabolic disorders
(Morita et al., 2010; unpublished data). Whereas Cnot3+/- mice show defects in energy
metabolism (Morita et al., 2010), there is no information about the effects of complete
loss of Cnot3 in metabolic tissues. To better understand the role of Cnot3 in nutrient
signaling and energy metabolism, I generated a mouse strain lacking Cnot3 specifically
in adipose tissue using the cre/loxP system. Cnot3 deficiency in adipose tissues induces
lipodystrophy, a rare disease characterized by a deficiency of adipose tissue.
Lipodystrophy is caused by multiple factors. Recent studies showed that
lipodystrophy can result from either the suppression or the overexpression of various
genes; several lipodystrophic mouse models have been generated by disrupting
transcription factor-coding genes, including peroxisome proliferator activated receptor
(PPAR)γ (He W et al., 2003), sterol regulatory element binding protein (SREBP)1c
(Shimomura I et al., 1998), and CCAAT/enhancer-binding proteins (C/EBPs)
CCR4-NOT deadenylase complex, another regulator of gene expression, induces a
lipodystrophic phenotype. I further provide evidence that Cnot3 deficiency caused
massive inflammation and apoptosis in adipose tissues, which together at least partially
account for the lipodystrophic phenotype. Furthermore, Cnot3 might target mRNAs
related to lipodystrophy, such as Srebp1 mRNA, so that CCR4-NOT can deadenylate
these mRNAs.
Mice showing haploinsufficiency of the Cnot3 in whole body are lean with
decreased adiposity and have increased metabolic rates and enhanced glucose tolerance
(Morita et al., 2010). Deletion of Cnot3 in an adipose tissue-specific manner caused
massive fat loss, but these mice are not lean and show insulin resistance and impaired
glucose tolerance, suggesting that the balance of Cnot3 expression in adipose tissue has
a very important role in maintaining adipocyte viability and whole body metabolism.
Lipodystrophy is commonly ascribed to defective adipocyte differentiation (Garg
A et al., 2004; Capeau J et al., 2005; Moitra J et al., 1998; Shimomura I et al., 1998;
Peterfy M et al., 2001). Because the Cre transgenic mice I used to generate Cnot3
adipocytes should not have been impaired; therefor, the fat loss and subsequent
progressive lipodystrophy in Cnot3ad-/- mice are not due to defective adipocyte
differentiation.
The phenotype of Cnot3ad-/- mice is similar to that of the established
lipodystrophy model, aP2-nSREBP-1c transgenic mice (Shimomura et al. 1998) , which
have the unique combination of hypoplastic WAT and hypertrophic BAT. These traits
and their metabolic consequences resemble the HIV-associated lipodystrophy of
patients under combined antiretroviral therapy (cART) against HIV infection, in which
peripheral fat depots degenerate and visceral, neck (buffalo hump) and breast fat depots
expand (Carr A et al., 1998; Grinspoon et al., 2005). Our results demonstrate that
Cnot3ad-/- mice constitute an interesting experimental model to understand the molecular
basis of lipodystrophy induced by cART in humans. Further studies are required to
addres the relationship between hypoplastic WAT and hypertrophic BAT. BAT-specific
KO of Cnot3 would provide more conclusive evidence for the role of Cnot3 in this
tissue.
Cnot3ad-/- mice exhibited severe insulin resistance (Figure 10E). Alterations in
ectopic accumulation of lipids in tissues other than adipose tissue are considered to be
major causes of the development of insulin resistance (Shulman, 2000; Villena et al.,
2008). In addition, hyperlipidemia and the appearance of insulin resistance are often
associated with the activation of inflammatory pathways (Wellen et al., 2005).
Therefore, altered inflammatory pathways in Cnot3ad-/- mice may contribute to their
insulin resistance.
Cnot3ad-/- mice also exhibited increased energy expenditure. This finding is
consistent with other reports of increased resting energy expenditure (REE) in humans
with lipodystrophy syndromes (Cutler et al., 1991; Klein et al., 1992; Kosmiski et al.,
2001). Acute cold-induced thermogenesis was impaired in Cnot3ad-/- mice, suggesting
that the increased metabolic rate of Cnot3ad-/- mice may not be a direct consequence of
Cnot3 deficiency but rather a compensatory response to maintain normal body
temperature in the absence of white adipose tissue.
Furthermore, deletion of Cnot3 in adipose tissue prevents the body weight gain
and adipose tissue accumulation that are normally associated with high-fat diets. Unlike
feeding conditions (Agarwal et al., 2006; Villena et al., 2008), Cnot3ad-/- mice fed an
HFD exhibited exacerbated lipodystrophy, but the metabolic consequences of this
lipodystrophy, such as glucose intolerance, insulin resistance and ectopic lipid
accumulation, were not exacerbated compared with wild-type littermates. It was
hypothesized that the increased energy expenditure might be an adaptive response to an
inability to store triacylglycerol fuel in a normal manner, which may represent a defense
mechanism to protect non-adipose tissues from further lipid accumulation (Kosmiski et
al., 2007). The mechanism underlying this phenotype was not investigated further, but
deserves additional studies.
In conclusion, this study describes the lipodystrophic phenotype caused by the
deletion of Cnot3 specifically in adipose tissue. Microarray analysis revealed that a
reduction in CNOT3 levels specifically in adipose tissue affects the expression of
mRNAs that encode proteins important for lipid metabolism, inflammation, and
apoptosis. Thus, the Cnot3ad-/- mice may be a novel valuable animal model of partial
lipodystrophy and insulin resistance in humans. Overall, this study links CCR4-NOT
the intriguing possibility that CNOT3 and the CCR4-NOT deadenylase complex can
References
Aslam A., Mittal S., Koch F., Andrau J. C., Winkler G. S. (2009) The Ccr4-Not
deadenylase subunits CNOT7 and CNOT8 have overlapping roles and modulate cell
proliferation. Mol. Biol. Cell 20: 3840–3850.
Agarwal A. K., Garg A. (2006) Genetic basis of lipodystrophies and management of
metabolic complications. Annu. Rev. Med. 57: 297–310.
Bai Y., Salvadore C., Chiang Y. C., Collart M. A., Liu H. Y., Denis C. L. (1999) The
CCR4 and CAF1 proteins of the CCR4–NOT complex are physically and functionally
separated from NOT2, NOT4, and NOT5. Mol. Cell Biol. 19: 6642–6651.
Berthet C., Morera A. M., Asensio M. J., Chauvin M. A., Morel A. P., Dijoud F.,
Magaut J. P., Durand P., Rouault J. P. (2004) CCR4-associated factor CAF1 is an
essential factor for spermatogenesis. Mol. Cell Biol. 24: 5808–5820.
Capeau J., Magré J., Lascols O., Caron M., Béréziat V., Vigouroux C., Bastard J. P.
(2005) Diseases of adipose tissue: genetic and acquired lipodystrophies. Biochem. Soc.
Caron-Debarle M., Lagathu C., Boccara F., Vigouroux C., Capeau J. (2010)
HIV-associated lipodystrophy: from fat injury to premature aging. Trends Mol. Med.
16: 218–229.
Carr A., Samaras K., Burton S., Law M., Freund J., Chisholm D. J. (1998) A syndrome
of peripheral lipodystrophy, hyperlipidaemia and insulin resistance in patients receiving
HIV protease inhibitors. AIDS. 12: F51–F58.
Chatterjee R., Bhattacharya P., Gavrilova O., Glass K., Moitra J., Myakishev
M., Pack S., Jou W., Feigenbaum L., Eckhaus M., and Vinson C. (2010)
Suppression of the C/EBP family of transcription factors in adipose tissue
causes lipodystrophy. J Molecular Endocrinology. 46(3): 175-192.
Chen C., Ito, K., Takahashi A., Wang G., Suzuki T., Nakazawa T., Yamamoto T.,
Yokoyama K. (2010) Distinct expression patterns of the subunits of the CCR4-NOT
deadenylase complex during neural development. Biochem. Biophys. Res. Commun.
410: 360–364.
Collart M. A. (2003) Global control of gene expression in yeast by the Ccr4-Not
Collart M. A., Timmers H. T (2004) The eukaryotic Ccr4-not complex: a regulatory
platform integrating mRNA metabolism with cellular signaling pathways? Prog.
Nucleic Acid Res. Mol. Biol. 77: 289–322.
Collart M. A., Panasenko O. O. (2012) The CCR4-not complex. Gene 492: 42–53.
Consortium A. G. O. (2008) The Gene Ontology project in 2008. Nucleic Acids
Research 36: D440–444.
Cutler D. L., Kaufmann S., Freidenberg G. R. (1991) Insulin-resistant diabetes mellitus
and hypermetabolism in mandibuloacral dysplasia: a newly recognized form of partial
lipodystrophy. J. Clin. Endocrinol. Metab. 73: 1056 – 61.
Dupressoir A., Morel A. G., Barbot W., Loirreau P., Corbo L., Heidmann T. (2001)
Identification of four families of yCCR4- and Mg2+-dependent endonuclease-related
proteins in higher eukaryotes, and characterization of orthologs of yCCR4 with
conserved leucine-rich repeat essential for hCAF1/hPOP2 binding. BMC Genomics 2:
9S.
Durnin J. (1984) Measuring impact on physical activity and physical fitness: Chapter 8
by David E. Sahn, Richard Lockwood, and Nevin S. Scrimshaw. United Nations
University Press.
Eguchi J., Wang X., Yu S., Kershaw E. E., Chiu, P. C., Dushay J., Estall J. L., Klein U.,
Maratos-Flier E., Rosen E. D. (2010) Transcriptional control of adipose lipid handling
by IRF4. Cell Metab. 13: 249–259.
Fisher F. M., Kleiner S., Douris N., Fox E. C., Mepani R. J., Verdeguer F., Wu J.,
Kharitonenkov A., Flier J. S., Maratos-Flier E., Spiegelman B. M. (2012) FGF21
regulates PGC-1a and browning of white adipose tissues in adaptive thermogenesis.
Genes Dev. 26: 271–281.
Feldmann H. M., Golozoubova V., Cannon, B., Nedergaard J. (2009) UCP1 ablation
induces obesity and abolishes diet-induced thermogenesis in mice exempt from thermal
stress by living at thermoneutrality. Cell Metab. 9: 203–209.
Frayn K. N. (2002) Adipose tissue as a buffer for daily lipid flux. Diabetologia. 45:
12010210.
Garg A. (2000) Lipodystrophies. Am. J. Med. Sci. 108: 143–152.
1234.
Garg A. (2006) Adipose tissue dysfunction in obesity and lipodystrophy. Clin.
Cornerstone 8(Suppl4): S7–S13.
Garg A., Agarwal A. K. (2009) Lipodystrophies: disorders of adipose tissue biology.
BBA Mol. Cell Biol. L. 1791: 507–513.
Garg A. (2010) Lipodystrophies: genetic and acquired body fat disorders. J. Clin.
Endocrinol Metab. 96: 3313–3325
Grinspoon S., Carr A. (2005) Cardiovascular risk and body-fat abnormalities in
HIV-infected adults. N. Engl. J. Med. 352, 48–62.
Gupta R. K., Arany Z., Seale P., Mepani R. J., Ye L. (2010) Transcriptional control of
preadipocyte determination by Zfp423. Nature 464: 619–623.
He W., Barak Y., Hevener A., Olson P., Liao D., Le J., Nelson M., Ong E.,
Olefsky J.M., Evans R.M. (2003) Adipose-specific peroxisome
proliferator-activated receptor gamma knockout causes insulin resistance in
fat and liver but not in muscle. PNAS. 100: 15712–15717.
adipocyte biology. lipodystrophies: windows on adipose biology and metabolism. J.
Lipid Res. 48 : 1433–1444.
Herrero L., Shapiro H., Nayer A., Lee J., Shoelson S. E. (2010) Inflammation and
adipose tissue macrophages in lipodystrophic mice. PNAS. 107: 240–245.
Kershaw E. E., Flier J. S. (2004) Adipose tissue as an endocrine organ. J. Clin.
Endocrinol. Metab. 89: 2548–2556.
Klein S., Jahoor F., Wolfe R. R., Stuart C. A. (1992) Generalized lipodystrophy: in vivo
evidence for hypermetabolism and insulin-resistant lipid, glucose and amino acid
kinetics. Metabolism41: 893– 896.
Kosmiski L. A., Kuritzkes D. R., Lichtenstein K. A. (2001) Fat distribution and
metabolic changes are strongly correlated and energy expenditure is increased in the
HIV lipodystrophy syndrome. AIDS 15: 1993–2000.
Kosmiski L. A., Kuritzkes D. R., Sharp T. A., Hamilton J. T., Lichtenstein K. A.,
Mosca C. L., Grunwald G. K., Eckel R. H., Hill J. O. (2003) Total energy expenditure
and carbohydrate oxidation are increased in the human immunodeficiency virus
Liisberg Aune U., Ruiz L., Kajimura S. (2013) Isolation and differentiation of stromal
vascular cells to beige/brite cells. J. Visual. Exp. E50191.
Liu H. Y., Badarinarayana V., Audino D. C., Rappsilber J., Mann M., Denis C. L.,
(1998) The NOT proteins are part of the CCR4 transcriptional complex and affect gene
expression both positively and negatively. EMBO J. 17: 1096–1006.
Marshall B. A., Ren J. M., Johnson D. W., Gibbs E. M., Lillquist J. S. (1993) Germline
manipulation of glucose homeostasis via alteration of glucose transporter levels in
skeletal muscle. J. Biol. Chem. 268: 18442–18445.
Moitra J., Mason M. M., Olive M., Krylov D., Gavrilova O., Marcus-Samuels B.,
Feigenbaum L., Lee E., Aoyama T., Eckhaus M. (1998) Genes Dev. 12: 3168–318.
Morita M., Oike Y., Nagashima T., Kadomatsu T., Tabata M. (2010) Obesity resistance
and increased hepatic expression of catabolism-related mRNAs in Cnot3+/- mice. EMBO
J. 30: 4678–4691.
Morita M., Suzuki T., Nakamura T., Yokoyama K., Miyasaka T., and Yamamoto T.
(2007) Depletion of mammalian CCR4b deadenylase triggers elevation of the p27Kip1
Mallewa J. E., Wilkins E., Vilar J., Mallewa M., Doran D., Back D., Pirmohamed M.
(2008) HIV-associated lipodystrophy: a review of underlying mechanisms and
therapeutic options. J. Antimicrob. Chemother. 62: 648–660.
Nagy G. S., Tsiodras S., Martin L. D., Avihingsanon A., Gavrila A., Hsu W.
C., Karchmer A. W., Mantzoros C. S. (2003) Human immunodeficiency virus type
1-related lipoatrophy and lipohypertrophy are associated with serum concentrations of
leptin. Clin. Infect. Dis. 36: 795–802.
Nakamura T., Yao R., Ogawa T., Suzuki T., Ito C., Tsunekawa N., Inoue K., Ajima R.,
Miyasaka T., Yoshida Y. (2004) Oligo-astheno-teratozoospermia in mice lacking Cnot7,
a regulator of retinoid X receptor beta. Nature Gene. 36: 528–533.
Nakashima K., Noda T., Yamamoto T., Noda M. (2007) Cnot7-null mice exhibit high
bone mass phenotype and modulation of BMP actions. J. Bone Miner. Res. 22: 1217–
1223.
Neely G. G., Kuba K., Cammarato A., Isobe K., Amann S., Zhang L., Murata M.,
Elmen L., Gupta V., Arora S., Sarangi R., Dan D., Fujisawa S., Usami T., Xia C. P.,
Drosophila RNAi screen identifies NOT3 as a conserved regulator of heart function.
Cell 141042–153.
Ohno H., Shinoda K., Ohyama K., Sharp LZ., Kajimura S. (2013) EHMT1 controls
brown adipose cell fate and thermogenesis through the PRDM16 complex. Nature 504:
163–167.
Peterfy M., Phan J., Xu P., Reue K. (2001) Lipodystrophy in the fld mouse results from
mutation of a new gene encoding a nuclear protein, lipin. Nat. Gene. 27: 121024.
Phan J., Reue K. (2005) Lipin, a lipodystrophy and obesity gene. Cell Metab. 1: 73–83.
Sanchez-Gurmaches J., Hung C. M., Sparks C. A., Tang Y., Li H., Guertin D. A. (2012)
PTEN loss in the Myf5 lineage redistributes body fat and reveals subsets of white
adipocytes that arise from Myf5 precursors. Cell Metab. 16: 348–362.
Savage D. B. (2009) Mouse models of inherited lipodystrophy. Dis. Model. Mech. 2:
554–562.
Seale P, Lazar M. A. (2009) Brown Fat in Humans: Turning up the Heat on
Shimomura I., Hammer R. E., Richardson J. A., Ikemoto S., Bashmakov Y., Goldstein J.
L., Brown M. S. (1998) Insulin resistance and diabetes mellitus in transgenic mice
expressing nuclear SREBP-1c in adipose tissue: model for congenital generalized
lipodystrophy. Genes Dev. 12: 3182–3194.
Shimomura I., Hammer R. E., Ikemoto S., Brown M. S., Goldstein, J. L. (1999) Leptin
reverses insulin resistance and diabetes mellitus in mice with congenital lipodystrophy.
Nature 401: 73–76.
Shimomura I., Matsuda M., Hammer R. E., Bashmakov Y., Brown M. S., Goldstein J. L.
(2000) Decreased IRS-2 and increased SREBP-1c lead to mixed insulin resistance and
sensitivity in livers of lipodystrophic and ob/ob mice. Mol. Cell 6: 77–86.
Shulman G. I. (2000) Cellular mechanisms of insulin resistance. J. Clin. Invest. 106:
171076.
SparkNotes Editors. (2014) “Sparknote on nutritional assessment and profiling: Anthropometric.” SparkNotes.com. SparkNotes LLC. n.d.. Web.
Strissel K. J., Stancheva Z., Miyoshi H., Perfield J. W. II., DeFuria J., Jick Z. (2007)
Adipocyte death, adipose tissue remodeling, and obesity complications. Diabetes 56,
2910–2918.
Strickland L. R., Guo F., Lok K., Garvey W. T. (2013) Type 2 diabetes with partial
lipodystrophy of the limbs: a new lipodystrophy phenotype. Comment in Diabetes Care.
36: 2142–5.
Sutinen J., Yki-Järvinen H. (2007) Increased resting energy expenditure, fat oxidation,
and food intake in patients with highly active antiretroviral therapy-associated
lipodystrophy. Am. J. Physiol. Endocrinol. Metab. 292: E687–E692.
Kim S., Huang L. W., Snow K. J., Ablamunits V., Hasham M. G., Young T. H., Paulk
A. C., Richardson J. E., Affourtit J. P., Shalom-Barak T., Bult C. J., Barak Y. (2007) A
mouse model of conditional lipodystrophy. PNAS. 104: 16627–16632.
Temme C., Simonelig M., Wahle E. (2014) Deadenylation of mRNA by the
CCR4-NOT complex in Drosophila: molecular and developmental aspects. Front. Gene.
Tucker M., Valencia-Sanchez M. A., Staples R. R., Chen J., Denis C. L., Parker R.
(2001) The transcription factor associated Ccr4 and Caf1 proteins are components of the
major cytoplasmic mRNA deadenylase in saccharomyces cerevisiae. Cell 104: 377–
386.
Villena J. A., Choi C. S., Wang Y., Kim S., Hwang Y. H., Kim Y. B., Cline G.,
Shulman G. I., Sul H. S. (2008) Pref-1 confers resistance to diet induced obesity but
exacerbates insulin resistance in mice. a new model of partial lipodystrophy. Diabetes
57: 3258–3266.
Vergnes L., Beigneux A.P., Davis R., Watkins S.M., Young S. G., Reue K. (2006)
Agpat6 deficiency causes subdermal lipodystrophy and resistance to obesity. J. Lipid
Res. 47: 745–754.
Washio-Oikawa K., Nakamura T., Usui M., Yoneda M., Ezura Y., Ishikawa I.,
Nakashima K., Noda T., Yamamoto T., Noda M. (2007) Cnot7-null mice exhibit high
bone mass phenotype and modulation of BMP actions. J. Bone Miner. Res. 22: 1217–
Watanabe C., Morita M., Hayata T., Nakamoto T., Kikuguchi C., Li X., Kobayashi Y.,
Takahashi N., Notomi T., Moriyama K. (2014) Stability of mRNA influences
osteoporotic bone mass via CNOT3. PNAS. 101: 2692–2697.
Wellen K. E., Hotamisligil G. S. (2005) Inflammation, stress, and diabetes. J. Clin.
Invest. 105: 1010–1019.
Winkler G. S., Balacco D. L. (2013) Heterogeneity and complexity within the nuclease
module of the Ccr4-Not complex. Front. Gene. 4: 296.
Yamashita A., Chang T. C., Yamashita Y., Zhu W., Zhong Z., Chen C. Y., Shyu A. B.
(2005) Concerted action of poly(A) nucleases and decapping enzyme in mammalian
Acknowledgments
I give the greatest gratitude to my supervisors Professor Tadashi Yamamoto and
Professor Yuji Yamanashi for their continual guidance, words of wisdom, and
friendship. They have been by my side in every difficult moment and provided me with
much more support and understanding than one could possibly expect from a PhD
supervisor. During my PhD dissertation study, I have learned a lot from them, not only
scientifically, but also personally.
I acknowledge Dr. Toru Suzuki very much for friendly reviewing this thesis. His
constructive suggestions really helped me to improve this thesis in many aspects.
Sincere thanks to Dr. Masahiro Morita, Dr. Akinori Takahashi, Dr. Kentaro Ito,
Mr. Shin-ichi Ogawa, Dr. Naosuke Hoshina, Dr. Taku Kureha for their helpful
discussions and technical advices.
I am grateful to for Associate Professor Ohsugi Miho, Dr. Noriko
Tokai-Nishizumi, Dr. June Goto-Nakamura, Dr. Naoki Oshimori for kind
The great appreciation to Professor Kajimura Shingo at the University of
California, Assistant professor Takahisa Nakamura at Cincinnati Children's Hospital
Medical Center for valuable suggestions and helpful discussions, enriched my
knowledge.
I thank all my past and present members in the Yamamoto laboratory, who were
always there for help, suggestions and fruitful discussions. Thanks Ms. Yuki Sakaizumi
and Ms. Kaori Yamashiro for the help on daily events. Thanks Chisato Kikuguchi,
Miho Tokumasu, for sharing their pleasures in daily life. I appreciate my dear friends
Ms. Chihiro Arasaki, Ms. Qiong Huang, Dr. Shaofang Wang, Dr. Shun-Jen Yang for
their kind friendship and the help in many aspects.
To my father Mr. Peiguo Li and mother Ms. Wanmei Wang for their endless love
and encouragement. Without their strong support in both spirit and economy, I have no
encouragement to go abroad and to pursue what I want. Special thanks to my sister Ms.
Fujuan Li, for kind encouragement and strong personally support and for sharing parts
To my beloved husband Zhenghong Gao to whom this thesis is dedicated. Hong
has been there for me all the time, with a dedication that is beyond any words.
Lastly, I would like to thank Japan for being such a great country receiving me
Figure 1. Schematic illustration of lipodystrophy. Lipodystrophy and obesity are caused by
different etiology but accompanied by similar metabolic consequences including dyslipidemia,
hepatic steatosis, severe insulin resistance, and diabetes mellitus. Lipid overload
Lipid storage capacity↓↓
Lipodystrophy
Ectopic lipid accumulation/ lipotoxicity
Similar Metabolic complications: • Dyslipidemia • Hepatic steatosis • Insulin resistance • Diabetes mellitus
Obesity
Different etiology?ORF
m G7 AAAAA
3’ UTR
3’ UTR binding proteins
Deadenylation & decay CNOT6/6L CNOT7/8 CNOT2 CNOT1 CNOT9 CNOT10 CNOT3
Figure 2. Schematic illustration of the CCR4-NOT complex and the role of CNOT3. The CCR4–NOT complex is a major deadenylase that regulates mRNA degradation by catalyzing the removal of mRNA poly(A) tails. The CNOT3 non-catalytic component of the mammalian CCR4-NOT complex is involved in recruitment of the CCR4-NOT to the 3' end of specific mRNAs.
Cnot3
Adiponectin Cre LoxP
X
LoxPCnot3
lox/loxCnot3
ad-/-Adipoq-Cre
A Cnot3 lox/lox Cnot3 ad-/- CNOT3 CNOT3 α-Tubulin α-Tubulin WAT BAT CNOT3 α-Tublin B
Figure 4.(A) Western blot of CNOT3 and α-Tubulin protein by western blot in white adipose tissue (WAT) and brown adipose tissue (BAT) of Cnot3lox/lox control and Cnot3ad-/- mice. (B) Tissue distribution of CNOT3 protein by western blot in Cnot3lox/lox control and
Cnot3lox/lox
Cnot3ad-/-
Figure 5. There were no obvious morphological differences in Cnot3ad-/- mice. (A) Gross
appearance of 8-week-old Cnot3ad-/- mice and their wild-type littermates on ND feeding.
(B) Growth curve of Cnot3ad-/- mice and their wild-type littermates from 2 to 8 weeks
after birth. n=10 for each genotype. Results expressed as mean ± SEM, *p < 0.05, * * p < 0.01, * * * p < 0.001. A B Body weight (g) 0 5 10 15 20 25 30 2 3 4 5 6 7 8 ** * * Age (weeks) Cnot3lox/lox Cnot3ad-/-
BAT eWAT A
Figure 6. Severely reduced size of WAT and markedly enlarged BAT.(A) Fat pads morphology of wild-type and Cnot3ad-/- mice. (B) The relative weight of the indicated
organs. The weight of the organ was normalized to body weight. n=8-10 for each genotype. Results expressed as mean ± SEM, *p < 0.05, * * p < 0.01, * * * p < 0.001.
Cnot3lox/lox Cnot3ad-/- Tissue weight/ body weight (mg/g) 0 10 20 30 40 50 60 Cnot3lox/lox Cnot3ad-/- *** *** *** *** *** B
Figure 7. MRI imaging of wild-type (left) and Cnot3ad-/- (right) mice at 8 weeks on ND
feeding. Cross-section at the level of the interscapular region (A), thorax (B) and abdomen (C). D, diaphragm; scWAT, subcutaneous WAT; mWAT, mesenteric WAT; pWAT, retroperitoneal fat; BAT , Interscapular BAT; SC, spinal cord;. K, kidney.
Cnot3lox/lox Cnot3ad-/-
Abdomen Thorax Interscapular region D D K K K K pWAT pWAT SC SC SC SC BAT BAT
scWAT
scWAT
mWAT mWAT A B CFigure 8. An abnormal lipid accumulation in the liver and BAT of Cnot3ad-/- mice.
Histologic sections of WAT BAT and liver of 8-week-old wild type and Cnot3ad-/- mice. (A-F), HE staining of WAT BAT and liver, (G,H) oil-red-O staining of liver. Scale bar, 100μm. A B D C Cnot3 lox/lox Cnot3 ad-/-
eWAT BAT Liver
E
F
G
Figure 9. Typical metabolic sequelae of lipodystrophy in Cnot3ad-/- mice. (A) Serum
insulin concentration (B) Serum triglyceride concentration (C) Blood glucose levels in fed or fasted Cnot3lox/lox and Cnot3ad-/- mice. (D and E) Glucose tolerance tests (GTTs) (D)
and Insulin tolerance tests (ITTs) (E) in wild-type and Cnot3ad-/- mice fed on ND. Blood
glucose levels were measured at each indicated time point following intraperitoneal injection of 0.5 g glucose per kg body weight or 1.0 U insulin per kg body weight. n=6– 10 for each genotype. Results expressed as mean ± SEM, *p < 0.05, * * p < 0.01, * * * p < 0.001. C D E 0 50 100 150 200 250 Feeding Fas7ng Serum triglyceride (mg/dl) *** N.S Cnot3lox/lox Cnot3ad-/- 0 1 2 3 4 5 6 7 Feeding Fas7ng Serum insulin ( ng /ml) N.S ** Cnot3lox/lox Cnot3ad-/- 0 20 40 60 80 100 120 140 Feeding Fas7ng Blood glucose (mg/dl) N.S *** Cnot3lox/lox Cnot3ad-/- 0 50 100 150 200 250 0 30 60 90 120 * * 0 20 40 60 80 100 120 0 30 60 90 120 Blood glucose (mg/dl)
Minutes after insulin injection
Blood glucose (mg/dl)
Minutes after glucose injection
*** ** ** ** ** ** *** Cnot3lox/lox Cnot3ad-/- A B Cnot3lox/lox Cnot3ad-/-
Relative mRNA abundance 0 0.2 0.4 0.6 0.8 1 1.2 1.4 Ucp1 C *** Cnot3lox/lox Cnot3ad-/- UCP1 GAPDH
Cnot3lox/lox Cnot3ad-/-
B 0 0.5 1 1.5 2 2.5 3 3.5 4 4.5 Hoxc8 Dpt *** ** Relative mRNA abundance
Figure 10. (A) qRT-PCR analysis of Ucp1mRNA expression level in BAT of Cnot3ad-/-
mice and their wild-type littermates. (B) UCP1 protein expression level in BAT of
Cnot3ad-/- mice and their wild-type littermates. (C) qRT-PCR analysis of HoxC8 and Dpt
in BAT of Cnot3ad-/- mice and their wild-type littermates.*P<0.05; **P<0.01 and
***P<0.001.
A
Cnot3lox/lox Cnot3ad-/-
30 31 32 33 34 35 36 37 38 39 40 Cnot3lox/lox Cnot3ad-/-
Core body temperature(
℃
)
Figure 11. Cnot3 deficiency impaired acute cold-induced thermogenesis.(A) Core body temperature of Cnot3ad-/- mice and their wild-type littermates. (B) Time course of core
body temperature of Cnot3ad-/- mice and their wild-type littermates housed at 4°C. n=5 for
each genotype. *P<0.05; **P<0.01 and ***P<0.001.
A B
Core body temperature(
℃ ) Time at 4 ℃(hr) * * * * * * * * 25 30 35 40 0 1 2 3 4 5 Cnot3lox/lox Cnot3ad-/-
Cnot3lox/lox
Cnot3ad-/-
Figure 12. Average daily food was no different between Cnot3ad-/- mice and their wild-type littermates. Average daily food intake normalized to body weight. Daily food intake per mouse was measured over 7 days. n=10 for each genotype. n=10 for each genotype.
Food intake/day/BW (g/d/g) 0 0.02 0.04 0.06 0.08 0.1 0.12 0.14 0.16 0.18 N.S
Figure 13. Increased energy expenditure in Cnot3ad-/- mice. (A and B) Oxygen
consumption (VO2) over 24 hr (A) and average VO2 (B) in wild-type and Cnot3ad-/- mice
fed on ND. (C and D) CO2 production (VCO2) over 24 hr (C) and average VCO2 (D) in wild-type and Cnot3ad-/- mice fed on ND. (E and F) Respiration exchange ratio (RER)
over 24 hr (E) and average RER (F) in wild-type and Cnot3ad-/- mice fed on ND. The data
were normalized to body weight. n = 4 per group. (C and D) respiratory exchange ratio (RER) . n = 4 per group. *p < 0.05, **p < 0.01 *** p < 0.001
1500 2000 2500 3000 3500 4000 4500 5000 5500 6000 7:00 13:00 19:00 1:00 7:00 Light Dark VO2 (ml/kg/h) A Cnot3lox/lox B Cnot3ad-/- Cnot3lox/lox Cnot3ad-/- *** * *** *** 0 1000 2000 3000 4000 5000 Light Dark 0.75 0.8 0.85 0.9 0.95 1 7:00 13:00 19:00 1:00 7:00 RER Light Dark 0 0.2 0.4 0.6 0.8 1 Light Dark E F C 1500 2000 2500 3000 3500 4000 4500 5000 5500 7:00 13:00 19:00 1:00 7:00 Light Dark 0 1000 2000 3000 4000 5000 Light Dark *** *** *** * VCO2 (ml/kg/h) D
0 1 2 3 4 5 Ucp1 100 150 200 250 ** Cnot3lox/lox Cnot3ad-/- Relative mRNA abundance
Figure 14. Cnot3ad-/- mice exhibited symptoms of cold stress even at 22°C. qRT-PCR
analysis of Ucp1mRNA expression level in epididymal WAT of Cnot3ad-/- mice and
their wild-type littermates. n=5 for each genotype. *P<0.05; **P<0.01 and ***P<0.001.