九州大学学術情報リポジトリ
Kyushu University Institutional Repository
イネの矮性遺伝子Dwarf 1のマップベースドクローニ ング
芦苅, 基行
九州大学農学研究科遺伝子資源工学専攻
https://doi.org/10.11501/3150676
出版情報:Kyushu University, 1998, 博士(農学), 課程博士
Map-based cloning of Dwarf 1 gene in rice ( Oryza sativa L.)
Motoyuki Ashikari
1999
Contents
General Introduction ------- 1
Chapter 1. RFLP linkage mapping of dl locus Introduction ----- 6
Materials and Methods--- 7
Results ---13
Discussion ---20
Chapter 2. Physical mapping of Dl gene Introduction ---23
Materials and Methods---24
Results ---28
Discussion ---36
Chapter 3. Cloning of Dl gene Introduction ---39
Materials and Methods ---40
Results ---43
Discussion ---49
Summary and conclusion---54
Acknowledgment ---57
References ---59
Appendix --- - ---6 7
( i)
General Introduction
Rice ( Oryza sativa
L.)
is the most important food crop in the world, since it provides the main source of food for 50 °/o of the world's population. Especially in Asia, rice has become the staple food and major cultivated crop for Asian people in long period because it is an excellent food source that grows favorably in warm and humid climate. In fact more than 90 °/o of all rice is produced and consumed in Asia. But now, Asian population is growing at 1.7 °/o a year (53 million annually) in 1 990s. During the 1990-2025 period, the demand for rice is projected to be increased by another 70 °/o, which will require an increase in production from 480 million ton to 810 million ton by 2025 (Hossain 1 995).Therefore, it is necessary to increase the rice production for supplying the future demand. Since rice production is still greatly affected by adverse environmental factors including low temperature, drought, wind, disease and harmful insects so that elucidating the basic mechanisms of rice plant growth at molecular level and innovative improvements are necessary to ensure increasing rice production.
Information obtained from the studies of higher-plant genetics is essential for molecular genetics and for application of techniques of molecular genetics to crop improvement. Knowledge of fundamental genetics of rice lagged behind that of other major crops such as maize, barley and tomato.
However, during the last decade, rapid advances of molecular genetics have made rice a model crop for genomics. There are some factors as the reasons
can be regenerated from protoplasts, and can be transformed by exogenous DNA. In addition, rice has a vast germplasm of cultivated and wild species. With the recent progress in rice genomics, a great number of eDNA clones have been isolated and sequenced. High density linkage map with molecular markers have been constructed (Causse et al. 1994, Kurata et al. 1994, Harushima et al.
1998), and YAC (Yeast Artificial Chromosome) (Umehara et al. 1995) and BAC
(Bacterial Artificial Chromosome) (Wang et al 1995, Zhang et al. 1996) libraries were constructed to develop physical map of large region of genomic DNA. The progress of rice genomics such as construction of the linkage map and physical map made it possible to isolate the genes such as Xa21 and Xa 1, both resistance genes to rice bacterial blight disease, by map-based cloning strategy (Song et al. 1995, Yoshimura et al. 1998).
In Plant Breeding Laboratory, Kyushu University, dwarf chimeric rice plant has been maintained for more than 50 years. This mutant shows chimeric morphology about dwarfism in many parts of the plant body. Allelic and progeny tests of this mutant revealed that the chimerism frrequently occured at d1 locus (Ashikari 1997). To elucidate a mechanism of this chimerism, a cloning of 01 gene allelic to recessive allele d1 is essential. With understanding the above, cloning of 01 gene through map-based cloning strategy was conducted in this study. A rice dwarf mutant Daikoku carrying d1 gene was first identified as a spontaneous mutant that exhibited not only short plant height, but also broad, dark green leaves, compact panicles, and small round grains (Akemine 1925;
Fig. 1 ). These phenotypes were all induced by a recessive allele d1. Dwarf mutant in plants is crucial for elucidating the mechanisms for plant growth and
2
development. Isolating and characterizing the rice 01 gene will also contribute to elucidating the physiological mechanisms of plant growth and development. It is also important for rice-breeding program to understand dwarfism, because dwarfism is one of the most important agricultural traits.
Fig.1-1. Plant type of d1 mutant, Daikoku.
left; Daikoku dwarf, right; wild-type (Nipponbare).
4
(1)
(2)
Fig.1-2. Phenotypes of panicle and seeds in d1 mutant, Daikoku.
(1)
Panicle. left; Compact panicle in Daikoku dwarf. right; Normal panicle in wildtype (Nipponbare). (2) Seeds. left; Small round grains in Daikoku dwarf. right;
Normal grains in wild-type (Nipponbare).
Chapter 1
RFLP linkage mapping of d11ocus
Introduction
The first rice linkage map consisting of 12 linkage groups were constructed based on morphological markers, corresponding to the haploid number of rice chromosomes (Nagao and Takahashi 1963, Takahashi and Kinoshita 1968). The locus of d1 was belonged to linkage group VI. The translocation and trisomic analysis revealed that d1 was located on chromosome 2 (Iwata et al. 1970). In the decade of 1970, the correspondence between chromosomes and linkage groups was elucidated. The linkage group VI was agreed to chromosome 2 (Iwata and Omura 1971, Iwata and Omura 1975). Since the numbering system of chromosomes and linkage groups was established (The Second International Rice Genetics Symposium in 1990), the
d1 gene was assigned to chromosome 5.
In 1988, the first rice RFLP (Restriction Fragment Length Polymorphism) linkage map was constructed in rice (McCouch et al. 1988). Now, a total of about 3500 DNA markers with mainly RFLP markers have been mapped on several rice linkage maps (McCouch et al. 1988, Saito et al. 1991, Causse et al. 1994, Kurata et al. 1994, Chen et al. 1997, Harushima et al. 1998). The results made it possible to isolate the genes such as Xa21 and X a 1, both resistance genes to rice bacterial blight disease, by map-based cloning strategy (Song et al. 1995, Yoshimura et al. 1998). For map-based cloning in plants, assignment of the
6
exact map position of a target gene (high-resolution RFLP linkage map), construction of physical map of the region including the gene and accumulation of molecular markers tightly linked to the gene are required. The construction of high-resolution linkage map is essential for construction of physical map in the second step of map-base cloning.
In this chapter, construction of a high-resolution RFLP linkage map of d 1 locus was described. As the first step of map construction, map position of the d1 was approximately determined using the small and large-scale population.
Secondly, the exact map position of the d1 was determined by high-resolution mapping.
Materials and Methods
Mapping population and sampling
1. Mapping population for a small scale mapping
Ninety-seven F2 plants derived from the cross between an Indica variety IR24 and a Japonica marker line FL423 carrying d1 were used for analyzing the linkage between d1 gene and 14 RFLP markers located on chromosome 5
(Saito et al.1991, Kurata et al. 1994). For DNA extraction, ten mature leaves from each plant were collected and frozen in liquid nitrogen.
2. Mapping population for a large scale mapping
The d1 plants that were selected from F2 population derived from the cross between IR24 and FL423 (d1) was backcrossed with IR24. The resultant
BC3F2 population (Appendix 1) was used for a large scale mapping of d1 gene.
Out of approximately 2600 BC3F2 seeds sown in nursery, 640 dwarf ones (homozygous recessive) were selected at the seedling stage and transplanted in the paddy field. In every five plants, wooden labels were stood to discriminate each pool (Fig. 2-1 ). To reduce the laborious work for DNA extraction, pooled sampling method (Churchill et al. 1993) was adopted and the procedures are shown in Appendix 2-1 and 2-2. Two leaves of each individual were collected.
Leaves of five plants were combined as one pool. Total 128 pooled leaves were frozen in liquid nitrogen and used for DNA extraction.
3. Mapping population for a high-resolution mapping of d1 gene
F2 population from the cross of d1 (Japonica) and Kasalath (Indica) showed large variations of phenotypes and seed sterility (Fig. 2-2). In this population, it is difficult to identify whether the plant carries d1 gene or not. It is also difficult to obtain a large amount of F3 seeds due to sterility. Therefore, this population is not good to use for high-resolution mapping. On the other hand, F2 population derived from the cross between FL2 carrying d1 and a substitution line (SL 18) which replaced of chromosome 5 of Kasalath for Nipponbare (Japonica) (Appendix 3) showed clear phenotypic differences and high seed fertility (Fig. 2-3). In this population, the plants carrying d1 gene could be easily recognized. Each plant in the population produced normal sets of F3 seeds.
Based on these observations, the F2 population from the cross of FL2 and SL 18 was used for a high-resolution mapping of d1 gene.
8
I
(2)
(1)
(3)
Fig.2.(1 ). Dwarf plants were selected and transplanted in paddy field. Wooden labels were stood in every five plants. (2). Phenotypic variation in F2 population derived from the cross of the FL2 and Kasalath. (3). Phenotypic variation in F2 population derived from the cross of the FL2 and SL 18.
About
13000F2 seeds were sown in a nursery. At the seedling stage,
3185
dwarf plants were selected and transplanted in a paddy field. Pooled sampling method that was described in large-scale mapping was employed.
There were
638pools of leaves, which were frozen in liquid nitrogen and used for DNA extraction.
DNA extraction
DNA was extracted using the cetyltrimethylammonium bromide (CTAB) method as described by Murray and Thompson (1980) with small modifications (Appendix 4).
RFLP marker
RFLP markers located on chromosome 5 in the linkage map
(Harushima et al. 1998) were used for linkage analysis of
d1.RFLP markers were indicated in italic in figures, not in text.
Southern hybridization
Total genomic DNA was digested with six restriction enzymes (EcoRI, EcoRV, Hindlll, BamHI, Bgnl and Oral). Two micrograms of each digested DNA was loaded on a
0.8°/oagarose gel, run for
16h at
20V and blotted onto a nylon membrane. Southern hybridization (Southern 1975) was done with 32P labeled RFLP markers or horseradish-peroxidase-labeled (HPL) RFLP markers
10
according to the protocol for the Enhanced Chemiluminescent (ECL) Direct Nucleic Acid Labeling and Detection System (Amersham). The banding pattern of 32P labeled RFLP markers was detected on X-ray film at -80
OCfor three days.
The banding pattern of HPL labeled RFLP markers was detected on X-ray film at room temperature for three hours.
Linkage analysis
In small scale mapping, the recombination values were calculated by the maximum likelihood method (Allard 1956) and converted into genetic distances (eM) using the Kosambi function (Kosambi 1944). In large scale mapping and high resolution mapping, map distance was calculated based on the following formula;
r=-(1 /2k)ln[1-(yA/n)],
r :the approximate maximum likelihood estimator of genetic distance from the target locus, k: the number of individuals per pool, yA: a total number of recombinant pools, n :the number of pools (Churchill et al. 1993). In these experiments, the number of individuals per pool (k ) was five. The number of pools (n ) was 128 in large scale mapping and 637 in high resolution mapping. Total numbers of recombination between
dtgene and RFLP markers were counted as the recombinant bands of Southern
hybridization with the RFLP markers around
01locus (Fig. 3). Recombinant
bands in pools indicated by arrowheads were observed at the same size of S L
band.
Pooled M dl SL Fl
r- N rn 7 LnDNA
<..0 . . . .
<..0 "'"' rn rn
<..0 <..0
Fig.3. Southern hybridization in pools including the recombinant plants.
Recombinant bands in pools were indicated by arrowheads. M : A marker, d1 : FL423 (d1), SL: Substitution line 18, F1 : F1 plant derived from cross of FL423 and SL 18.
12
Results
A small-scale mapping of d 1
DNA of 97 F2 plants derived from the cross between IR24 and marker line FL423 with d 1 was extracted individually and RFLP analysis was done with 16 RFLP markers located on chromosome 5 (Saito et al. 1991, Kurata et al.
1994). RFLP markers C309, Npb251, G1458 and G3010 were linked to d1 at 3.9
+2.0 eM, 7.1 +2.7 eM, 6.5+2.5 eM and 14.9+3.9 eM, respectively (Fig. 4 and
Appendix 5). The order of d1 and RFLP markers was determined as C309 - d1- Npb251- G1458 - G3010 by the relationship of genetic distance between all markers. The locus of d1 was in the distance of 8.8+2.2 eM between RFLP
markers C309 and Npb251. Approximate map position of d1 gene determined by small scale mapping was useful for construction of a high-resolution map of
d1 gene.
A large-scale mapping of d 1
DNA of 128 pools for d 1 homozygotes in BC3F2 population was extracted and RFLP analysis was performed with three RFLP markers
C309,S2351 and G 1458. Out of 128 pools, 10 recombinant pools were detected for RFLP marker C309 and the genetic distance between the d 1 gene and the marker was 0.8 eM. In the same manner, 10 and 41 recombinant pools were detected for RFLP marker 82351 and G 1458, respectively.
...
�
XNpb 292
XNp XNp XNpb XNpb b208 b146 139 387
XNpbG3010 XNpb XNpb 251
\
105 327 XNpbC309
(cfi) \
G 1458I /'"
366XNpb 81
� 3.9+2.0
----t----7.1 +2.7
8.8+2.2
--
h .6+0.9 � 4.0+1.5
I
6.5+2.5
5.9+1.8
I I
10.1 +2.3
---
1
14.9+3.9
Genetic distance (eM)
Fig.4. Small scale linkage map of d1 with RFLP markers on chromosome 5.
XNpb 297
Linkage relationship of d1 with all analyzed RFLP markers were shown above. The linkage map in the vicinity d1 was indicated below. The genetic distance was indicated under the map in thevicinity of d1.
The genetic distances between the
d 1
gene and the markers S2351 and G 1458 were 0.8 eM and 3.9 eM, respectively. RFLP marker G1458 instead of Npb251 was used for pooled-sample mapping, because Southern hybridization pattern of G1458 was clearer than that of Npb251. In large scale mapping, thed1
genewas located between RFLP marker C309 (S2351) and G 1458 with 4. 7 eM (Fig.5). Nine RFLP and six RAPD markers existed between C309 and G1458 on the rice RFLP linkage map using the population derived from the cross of
Nipponbare and Kasalath (Kurata et al. 1994). But these markers could not be utilized in the BC3F2 population derived from the cross of FL423 and IR24, because of no polymorphism between Japonica marker line FL423
(d1)
andIndica variety IR24.
In this pooled-sample mapping, determination of an exact number of recombinants in a pool was difficult to determine. To determine the exact number of recombinants for the closest RFLP marker, DNA of 640 dwarf plants was individually extracted and Southern hybridization was done using RFLP markers C309, S2351 and G 1458. As the result, 10, 10 and 41 recombinant plants were detected for C309, S2351 and G1458, respectively. Those results were consistent with the results of the pooled sampling. As the RFLP marker C309 was tightly linked to S2351 at 0 eM. The genetic distance between
d1
andthe flanking RFLP marker C309 (S2351) was less than 1 eM, the C309 was efficient marker as a starting point for chromosome walking. However, the other flanking marker G 1458 was far from
d 1.
Because the RFLP markers between C309 and G 1458 showed no polymorphism, these markers could not be used for this mapping.1--'
0\
0')
� �
(() CX) ,.... """
,_
0') ,.... ("') CX) """
(() ,.... 0.. 0.. 0..
,.... �
0.. CX) CX) � 0') 0') CQ
0')
�
,.... CX) CX) lt) CX) (() lt) c c � """ ("') <::)
�
(() (() 0') lt) ("') ("') �lt)CX) co(() c """ <::),.... (() ,....
�
�lt) (() � c ("') ,.... ,.... �C\1 C\1 ("') C\1 C\1,.... � <::)� � ("')
�
lt)�
("')� �
ua:a:oa: a:(!)S: ,.... lt),....�
("') ,.... ...a: a: u ::::a. (!)::E a: (/)(!)
52351 C30 9 v
@
G1458
'1 I I
� 0.8--+--- 3.9
genetic distance (eM)
Fig.5. Large scale linkage map of d1 gene.
The high density RFLP linkage map of centromere region of chromosome 5.
(Harushima et al.1998) was shown in above. Centromere region was indicated in box.
Large scale linkage map of d1 gene constructed by using BC3F2 population was shown below.
To solve this problem, it is necessary to construct other mapping population in which polymorphisms between crossing parents can be detected for RFLP markers between C309 and G 1458 .. Polymorphism between a Japonica marker line FL2
(d1)
and a substitution line (SL 18) for the RFLP markers was observed.New mapping population was constructed by crossing these two lines (FL2 and SL 18).
A high-resolution mapping d 1 gene
Out of about 13000 F2 plants derived from the cross between Japonica marker line FL2
(d1)
and a substitution line (SL 18), 3185 dwarf plants (homozygous ford1)
were selected. DNA of the 637 pools was extracted for pooled-sample mapping, Southern hybridization and linkage analysis were done with 13 RFLP markers between R569 and G1458 on chromosome 5 (Harushima et al. 1998)(Fig. 6). The number of pools containing the recombinant alleles betweend1
and the respective RFLP markers were as follows; 420 (1 0.8eM)
with R569, 306 (6.5eM)
with C309, 255 (5.1eM)
withR413, 243 (4.8
eM)
with R448, 241 (4.8eM)
with C288A, 235 (4.6eM)
with G260, 225 (4.4eM)
with R2059, 198 (3.7eM)
with R3069, 37 (0.6eM)
with V14 7, 71 (1.2eM)
with G5004, 291 (6.1eM)
with R3313 and 365 ( 8.5eM)
with S 1780, respectively. Consequently,d1
locus was located between flanking RFLP markers V14 7 and G5004 with the map distance of 1.8eM.
Out of 637 pools, 37 and 71 recombinant pools were identified with RFLP markers V147 and G5004, respectively....
00
�
0)0) �co
0) 0) C'l)
co co �
lt) (Q I'..c
C'l)c
lt)(Q
� ;�coC\Icc
�c � � �
�I 0�'\0j�� . &!
.. . � ;: dt<£ � U) (!)
I I IIIII .. _ __) . I ( I I I
I ---- - I I IIIII _I I t I I I
Fig.6. High resolution mapping of d1 gene.
G5004
High resolution RFLP linkage map of d1 was shown in above. The linkage map between V147 and G5004 was focused in below. The number of recombinant plant between d1 and RFLP markers were indicated under the map. Genetic distances between adjacent markers are shown in parentheses.
Pool-63 7
Fig.?. Southern hybridization in pool DNA with the RFLP marker V147.
Recombinant plant in each pool were indicated by arrowheads. d1 : FL423
(
d1),
SL : Substitution line 18, F1 : F1 plant derived cross of FL423 and SL 18.To select the individual recombinant plants from each pool, DNA was extracted from individual 540 plants (5 plants X1 08 pools). S outhern hybridization was
done with the marker V147 (Fig. 7). Recombinant plants in the pools were detected by RFLP fragment from S L 18. Thirty-seven recombinant plants heterozygous for the locus V14 7 and 71 recombinant plants heterozygous for the locus G5004 were identified. Total recombinant plants (1 08) in the pooled sampling method were the same as the total recombinant plants in the 540 individual sampling method. The plants in which the recombination were occurred between V147 and G5004 were confirmed in 3185 F2 plants. These plants were used and significant for further linkage mapping.
Discussion
In integrated linkage map of rice (ldeta et al. 1996) d1 gene was
mapped very roughly on chromosome 5. It was located between RFLP markers Npb387 and Npb1 05 with the distance about 40 eM. Small- scale mapping in this study revealed that the d1 gene was mapped between C309 and Npb251 with the distance about 8.8 eM. The order of the d 1 gene and the RFLP markers in this small-scale map was verified.
Large scale mapping made possible to precisely map d1 between C309 (S2351) and G 1458. Though 15 markers existed in the region between C309 (S2351) and G1458, no polymorphisms were observed in the population when we used many kinds of restriction enzymes. This suggested that d1 region of
20
both parents FL2 and IR24 might be identical.
The d1 gene was mapped between V147 and G5004 with the distance 1.8 eM in the high-resolution mapping. Of the 3185 plants, 37 recombinant plants between d1 and RFLP marker V147 (0.59 eM), and 71 recombinant
plants between d1 and G5004 (1.2 eM) were observed. Many plants in which the recombination occurred between tightly linked RFLP markers sandwiching d 1 (recombinant plants) were obtained. They were very useful for chromosome walking described in chapter 2.
The d 1 plants were easily distinguished from normal plants when we used the substitution line as a parent of the mapping F2 population. In a high
resolution mapping, the substitution lines were useful materials for high
resolution mapping. High-resolution mapping is depended on the size of mapping population. It is difficult to estimate optimum size of mapping population, but the population size of this high-resolution mapping were consequently adequate as seen in chapter 2.
Handling more than 1000 F2 plants for high-resolution RFLP linkage map is very laborious work. To facilitate the procedure of high-resolution mapping, utilization of PCR markers should be considered. Once we find the tightly linked RFLP markers sandwiching a target gene using small scale mapping population (about 100 F2 plants), replace the two RFLP markers by PCR markers. The replacement of RFLP markers by PCR markers can be achieved by designing PCR primers based on the sequence of the RFLP markers and subsequent digestion analysis with many restriction enzymes.
Using the PCR markers, the recombinants between the two markers are
selected in more than 1 000 F2 plant from cross of the mutant and appropriate S L line and only the recombinants are used for high-resolution mapping. The
procedure mentioned above would economize consuming time and planting space.
22
Chapter 2
Physical mapping of d1 gene
Introduction
For map-based cloning in plants, construction of the high-resolution RFLP linkage map is essential (described in chapter 1 ). In addition,
accumulation of molecular markers tightly linked to a target gene and
construction of physical map which consists of continuously overlapping contigs of a large insert genomic DNA covering the target gene are also required. In recent years, yeast artificial chromosome (YAC) libraries have been constructed for human (Burke et al. 1987), Arabidopsis (Ward and Jen 1990, Grill and
Somerville 1991 ), tomato (Martin et al. 1992), maize (Edwards et al. 1992), barley (Kleine et al. 1993) and rice (Umehara et al. 1995). An another bacterial artificial chromosome (BAC) system to clone large DNA fragments, was
described (Shizuya et al. 1992), and rice BAC libraries were also constructed (Wang et al. 1995, Zhang et al. 1996, Zhang and Wing 1997). Those YAC and BAC libraries provide powerful tools to generate molecular physical maps for gene tagging.
A YAC library constructed by RGP (Rice Genome Research Program) containing 6934 clones with an average insert size of 350 kb and covered six times of the haploid genome of rice (Umehara et al. 1995). The YAC library contributed to product of physical map of the large region containing the gene
(Antonio et al. 1996, Shimokawa et al. 1996, Saji et al. 1996, Wang et al. 1996, Umehara et al. 1996, Tanoue et al. 1997 and Koike et al. 1997).
This chapter described the construction of a physical map of d 1 region using YAC library, the identification of the YAC clones carrying d1 gene and the accumulation of molecular makers around d 1 .
Materials and Methods
DNA extraction from.YAC clones
DNA was extracted from YAC clones cultured for three days in AHC medium. (lmai and Olsen 1990) (Appendix 6).
A YAC library and DNA markers
A YAC library (Umehara et al. 1995) was used for construction of physical map of d1 region. All YAC clones were blotted on five filters and multiplied on many replica filters. DNA markers including RFLP, sequence
tagged site (STS) and YAC-end clones, which are located around d 1 gene on chromosome 5, were used for screening of a YAC libraly.
Screening of YAC library 1. For Colony hybridization
The replica filters blotted with YAC clones were hybridized with 10 ng I ml of a probe labeled by enhanced chemiluminescent (ECL) hybridization system (Amersham). YAC clones hybridized to the probe (Fig.
8)
were selected,24
cultured for three days in AHC medium and DNA was extracted from the clones.
The DNA was digested with the some restriction enzymes, electrophorested overnight and transferred to nylon membranes. These DNAs was hybridized with the specific probe to confirm the YAC clones containing the same sequences of the RFLP marker in each candidate YAC clone.
2. Three-step PCR screening
A screening system of three-step polymerase chain reaction (PCR) to isolate YAC clones with STS markers (Jones et al. 1 994) was carried out with modification (Umehara et al. 1996, Wu et al. 1 997). This system was employed for the screening of YAC clones using YAC-end DNA fragments. The procedures were illustrated in Appendix 7. The 20 bp primers were designed from the sequences of YAC-end DNA fragments. In the first screening, a PCR reaction (2 minutes at 96°C and followed 25 cycle of 1 minutes at 94.5 OC, 2
minutes at 58°C and 3 minutes 72°C) was done with the nine W superpools of
Y AC DNA, DNA of yeast host strain AB 1380 and DNA of a rice variety
Nipponbare. Each W superpools contained DNA mixture of about 800 YAC
clones. In the second screening, 29 subpools (8
Xpools, 12 Y pools and 9
Zpools) of each W pools that showed positive in the 1st PCR were screened by
the 2nd PCR. The YAC clones screened through 1st and 2nd PCRs were
considered as candidates, finally, the positive clones were confirmed by 3rd
PCR using the individual YAC clone DNA as a template.
Fig.B. Screening of YAC clones by colony hybridization.
Positive Y AC clones were indicated by arrowheads.
26
Isolation of YAC end DNA fragment
YAC end DNA fragments were obtained by a cassette-PCA method with slight modification (lsegawa et al. 1992). The procedures were illustrated in Appendix 8. The inserted rice genomic DNA including yeast genomic DNA was extracted (described above) and digested with restriction enzyme (A/ul, Haelll, Oral, EcoRV) at 37°C for 45 minutes. An Oligo cassette adapter of double strand
was designed: 5'GTACATATTGTCGTAGAACGCGTAATACGACTCAC TATAGG GAGA3'. The cassette adapter was ligated to digested Y AC DNA fragments. The cassettes ligated to YAC-end fragments (containing sequences at both the outsides of YAC vector and the cassette fragments) were amplified in the first PCR with YAC vector arm specific primer S 1 (TVL319 for left arm : 5'TTCGCTACTTGGAGCCACTA3', R120 for right arm: 5'TTCGCTCTTG GAGCCACTA3') and cassette primer C1 (C1: 5'GTACATATTGTCGTTAG AACGC G3'). Then YAC-end fragments were amplified in the successive PCR with the YAC vector arm specific primer 82 (VL3 for left arm:
5'GGTTTAAGGCGCAAGACTGTA3', R521 for right arm: 5'GGTTTAAGG CGCAAGACTGTA3') and cassette primer C2 primer (C2: 5'TAATACGACTCA CTATAGGGAGA3'). PCR reaction was done for 2 minutes at 96°C and followed 25 cycle of 1 minutes at 94.5°C, 2 minutes at 58°C and 3 minutes at 72°C.
Amplified DNA fragments was purified and cloned to TA cloning vector (Invitrogen ).
Similarity search
Computer searches for homologous sequences were carried out against the public databases Genpept, PDB, Spupdate and PIR using the BLAST algorithm (Altschul et al. 1990, Altschul and Lipman 1990).
EST mapping
In RGP the large-scale rice EST mapping has been carried out (Wu et al.
1997). Primer pairs were designed from the 3'-end (3'UTR) sequences of random and selected eDNA and the PCR screening was done by 3-step PCR screening method (described above).
Results
A rice yeast artificial chromosome (YAC) library was screened for construction of YAC contigs covering the d1 region. Colony hybridization was done with the RFLP markers V14 7 and G5004 as probes. YAC clones carrying the sequence of markers (V14 7 and G5004) were identified as positive clones on the X-ray film. Four YACs (Y5483, Y3401, Y 4480 and Y 4336) were identified using the RFLP marker V147, and two YACs (Y2287 and Y4611) were identified using the RFLP marker G5004. S outhern hybridization using V147 and G5004 as probes confirmed that these YAC clones apparently contained the sequences of the markers (Fig. 9).
28
1 2 3 4 5 6 7 8 9 10 11 12 13
Fig.9 Southern hybridization of YAC clones using V147 as a probe.
1 ;A./Hindi! I 2; Nipponbare, 3; Yeast, 4; Y3401, 5; Y4480, 6; Y5483, 7;Y4336,8;Y1988, 9;Y3745, 10;Y4480, 11;Y2287, 12;Y4611, 13; Y507 4, 13; Y5078,
Four YACs (Y5483, Y3401 Y4480 and Y4336) showed the band at the same size of the Nipponabare band with the V147. Similarly, two YACs (Y2287 and Y4611) showed the band at the same size of Nipponbare with G5004. Both end sequences of these YACs were amplified by the cassette-PCA method. Both of the end DNA fragments of four YAC clones containing V147 sequences (Y5483, Y3401, Y4480, and Y4336) did not hybridize to two YAC clones containing G5004 sequences (Y2287 and Y4611) and vice versa. These results indicated these YAC clones did not cover the region between V147 and G5004. Both of the end DNA fragments were also used for RFLP linkage mapping. The right end DNA fragment of Y5483 (Y5483R) was mapped between d1 and G5004 and was tightly linked to d1 with 0.03 eM. Nucleotide sequence of Y5483R was determined (procedures were described in chapter. 3), and the oligo primers (5483U: CCTGCTGGTGTTGATTCTGG, 5483L: GTACCGAAGGGGATCT TCAG) were designed. The YAC library was screened by the 3-step PCR method using these primers. Three YACs (Y1988, Y3745 and Y4488) were newly identified (Fig. 1 0). In the first PCR, three positive superpools (W3, WS and W?) were identified and the 2nd and the 3rd PCR screenings appeared four YAC clones (Y1988, Y3745, Y4488 and Y5483) carrying the sequence of Y5483R. DNA of four YAC clones was extracted and Southern hybridization was performed using Y5483R as a probe (Fig. 11). Four YACs (Y1988, Y3745, Y4488 and Y5483) showed the band at the same size of the Nipponabare, indicating that these Y AC clones contained the Y5483R sequences.
30
W3 W5 W7 NK
(A)
XG
(B) I II
�
1 2 3 4 5 6 7 8 910111213
(C)
Fig.1 0 Identification of YAC clones by 3-step PCR method.
A)
1st PCR. Three super pool (W3,W5,W7) contained the positive YAC clones.B)
2nd PCR.
I;
In W3 pool, XH, Y 4, Y6, Z2 pools contained the positive YAC clones.II;
In W5 pool, XD, XH, Y 4, Y9, Z2, zg pools contain the positive YAC clones.Ill;
In W7 pool, XG, Y11, Z1 pools contain the positive YAC clones.
(C)
3rd PCR, 1:Nipponbare, 2: yeast DNA, 3: Y1988, 4: Y1990, 5: Y3745, 6: Y3740, 7: Y3776, 8:
Y3793, 9:Y4440, 10:Y4445, 11:Y4488, 12:Y4493, 13:Y5483. N: Nipponbare, K:
Kasalath.
1 2 3 4 5 6 7 8 9 10
Fig.11 Southern hybridization of YAC clones using Y5483R as a probe.
1; Nipponbare, 2; Yeast, 3; Y5483, 4; Y1988, 5; Y3745, 6;Y4488, 7;Y6083, 8;Y6183, 9;Y6645,10; Y6683.
32
a: ...J
�
0')
0 ,... .,... I.C)
0 CX) 0 � 0 C'\1
a: a:
CX) I.C) M
CX) � M
� 1'- I ,,,,,,,,,,,, .... .I 0')
a: .,...
CX)
C'\1
...J CX)
.,... I.C)
�
CX) �
0
C'\1
M � � ,... I.C) M 0
() ;: �
> UJ (/)-+(( J)'
-\ v
� M
> >
18 - 5
T8
T2
T59
C'\1
>
10
,...
C'\1 (!l
I.C)
>
(!l
((+-
))
VJ VJ
I . ' I
(0.28) (0.07)(0.12) (0.03) (0.9)
I I I
Y54831
I I I
Y3401
L
I I
I
Y4480
I I I
Y4336
I
I I I
I
Y1988
I I I
I
I
Y3745
I I I
Y4488
I •
(0.16)
I I I
I I
�
I I
Y2287
O-o---
Y4611
Fig. 12. High-resolution RFLP linkage map and YAC clone contigs at the d1 locus on chromosome 5.
RFLP markers are shown above the linkage map, and the numbers of recombinants are under it. Genetic distances between adjacent markers are shown in parentheses. 0: End-fragment DNA of Y AC clone.
0:
RFLP markers or Y AC end-fragment DNA are contained in the Y AC clone.For ordering each YAC clones in this region, Southern hybridization was done using both the end-fragment DNA of YAC clones in this region as a probe. The left end DNA fragment of Y 4336 (Y 4336L) hybridized to YAC clone Y3401 and Y4480 (Fig. 12). The left end DNA fragment of Y3401 (Y3401
L)
hybridized to Y4480 and was mapped between C309 and V147. The right end DNA fragment of Y37 45 (Y37 45R) hybridized to YAC clones (Y 4488, Y1988 and Y5483). And Y4488R hybridized to Y1988 and Y5483. Y3745R and Y4488R were both mapped each other between d1 and V14 7 with genetic distances of 0.12 and 0.19 eM from d1, respectively. Y1988R hybridized to Y5483. Based on these results, the order of these YAC clones was determined. And d1 gene was included in four YAC clones (Y5483, Y1988, Y3745 and Y44889) and at least located in the region of 0.15 eM between Y3745R and Y5483R (Fig. 12). In RGP, insert size of all of clones of the YAC library was estimated by electrophoresis with CHEF and blot-analysis. According to the data, Y3745 was 350 kb in length, but three YAC clones (Y5483, Y1988 and Y 4488) had not been determined.In RGP, a large-scale expressed sequence tag (EST) map has been constructed (Wu et al. 1997). According to the EST map, three ESTs (E50508, S32 and S5933) were onto the YAC clone (Y5483) in the d1 region. To confirm weather the ESTs are located on YAC clones in d1 region or not, Southern hybridization was done using E50508, S32 and S5933 as probes (Fig. 13).
Using E50508 and S32 as probes, YAC clones Y5483, Y1988, Y3745 and Y 4480 showed the same size of band as that of Nipponbare.
34
1 2 3 4 5 6 7 8 91011 1213 14
-
- -
A
1 2 3 4 5 6 7 8 91011 12 13 14
- -
8
1 2 3 4 5 6 7 8 91011 12 13 14
c
Fig.13 Southern hybridization of YAC clones located on d1 region using ESTs as probes.
Probes A. 832, B. E50508, C. 85933
1; Nipponbare, 2; Yeast, 3; Y3401, 4; Y4480, 5; Y5483, 6; Y4336, 7;Y1988,8;Y3 745, 9;Y4480, 10;Y228 7, 11;Y4611, 12;Y5074, 13;Y5078, 14;Y6553
While in 85933 as a probe, YAC clones Y5483, Y1988, Y3745 and Y4488 showed the same size of band as that of Nipponbare. These results indicated that each YACs (Y5483, Y3401, Y4480 and Y4336) carried the sequences of E50508 and 832. On the other hand, the sequence of 85933 was included in YACs (Y5483, Y1988, Y3745 and Y4488) (Fig. 12). The three E8Ts were used for genetic mapping in the population of high-resolution mapping described in chapter 1. As the results, E50508 and 832 were mapped with 0.5 eM between d1 and V147. The 85933 was cosegregated with d1 in the 3185 d1 segregants.
The eDNA 85933 (350-bp insert) was derived from green shoots, and its amino acid sequence completely coincided with the sequence from Phe332 to Th�80 of the a subunit of rice GTP-binding protein RGA 1 (8eo et al. 1995, Ishikawa et al.
1995, Iwasaki et al. 1997).
Discussion
The YAC library contained a lot of chimeric clones by insertion of two segment of genomic DNA or deletion of a part of inserted genomic DNA.
Although 40 °/o of clones in the YAC library were estimated as chimeric, most YAC clones with EcoRI fragment below 400 kb were intact colinear clones (Umehara et al. 1995). Four YAC clones (Y5483, Y1988, Y3745, and Y 4488) carrying the 0 1 gene were identified and 01 gene was located between Y37 45R and Y5483R within 0.15 eM. Because Y37 45R and Y5483R that were very tightly linked and both sides of 0 1 locus, the connection of two fragments of
36
genomic DNA between Y3745R and Y5483R was improbable. The deletion between Y37 45R and Y5483R was possible very low frequency. Because the four YACs (Y5483, Y1 988, Y3745, and Y4488) contained both of Y3745R and Y5483R, These YACs seemed to carry the 01 gene. Based on this physical map, three EST appeared to be located on around 0 1locus. One of the EST S5933 was cosegragated in 3185 d1 segragants by a high-resolution mapping.
The EST S5933 indicated the high homology to a subunit of
heterotrimeric GTP-binding protein TGA 1 in tomato (Ma et al. 1991) and GPA 1 in Arabidopsis (Ma et al. 1990, Weiss et al. 1 993). Hetrotrimeric GTP-binding protein consists of a, � and y subunits. In recent years a lot of evidence that the
protein plays an important role of signal transduction has been accumulated in animals and microbes (Gilman 1987, Kaziro et al. 1991, Neer 1995, Hamm 1 998). a subunit of GTP-binding protein is converted into active form that bound GOP to be replaced with GTP and dissociated to � and y dimer. Then the
activated a subunit was transmitted as the first signal from receptor to effector.
Heterotrimeric GTP-binding proteins have been identified in several plant species (Terryn et al. 1993, Ma 1 994). Gibberellins (GAs) are a large family of tetracyclic diterpenoid plant growth hormones and are associated with
regulation of a-amylase expression in the cereal aleurone layer (Baulcombe
and Buffard 1983, Nolan and Ho 1 988). Since d1 mutant did not produce alpha-amylase in cereal aleurone layer with application exogenous GA, the mutant was classified into gibberellin insensitive mutant (Mitsunaga et al. 1 994).
It was speculated that d1 mutant lost the function of GA signal transduction. The function of GTP-binding protein associated with signal transduction fit well the speculated function of d1 gene. The EST S5933 might encode the 01 gene.
Accumulating the DNA markers around the target gene and locating the target gene between the DNA markers, as minimum genetic distances as
possible were important for map based cloning. In this study, several DNA markers tightly linked to d1 gene could be identified. Because large number of plants (3185 dwarf plants) were used for linkage analysis, d1 gene could be mapped between two DNA markers Y3745R and Y5483R with 0.15 eM,
precisely. In addition, the EST S5933 cosegregated to d1 gene was appeared as candidate of D 1 gene. To confirm that the EST S5933 encodes 01 gene, Southern and Northern analysis of a series of d 1 mutants using S5933 as a probe are described in chapter.3.
38
Chapter 3
Cloning of the D 1 gene
Introduction
High-resolution RFLP linkage mapping and physical mapping in the d1 region revealed a possible candidate EST of 01 gene in chapter 2. The EST cosegregated 3185 d1 segregants and encoded a subunit of GTP binding
protein. The GTP-binding protein plays the very important role of signal transduction of adenyl cyclase in mammal (Gilman 1987). Recent evidences that the protein also has the role of the same function in plants has been reported (Ma 1994). Since the d1 mutant was classified into gibberellin insensitive mutant (Mitsunaga et al. 1994), the 01 gene is possibly to encode protein associate with GA signal transduction. The role of GTP-binding protein and predicted function of d1 gene seem to be associated mutually. For
elucidating the association between the EST and 0 1 gene, analyzing the gene structure and the expression of EST in d1 mutants were required. In Kyushu University, nine d1 mutant lines have been maintained. In this chapter, Southern analysis and Northern analysis in the d 1 mutant lines were performed, and the region of the EST was partially sequenced. The association between the EST and GA signal transduction was also discussed in this chapter.
Materials and Methods
Plant materials
Nine dt mutant lines, FL2, H0532, H0533, H0537, H0538, H0541, H0552, CM392 and CM1729 maintained in Kyushu University, were used.
Wild-type varieties, Nipponbare and Kasalath were employed in the experiment.
Extraction of total RNA
Rice total RNA was extracted from frozen two-weeks-old seedlings using the single-step method (Chomczynski and Sacchi 1987) with
modifications.
Seven grams of seedlings were ground in liquid nitrogen with a mortal and a pestle and. Ground well after addition of 50 ml guanidium thiocyanate solution. Subsequently 25 ml TE-saturated phenol and 25 ml of CIA (chloroform and isoamyl alcohol; 24:1) were added to the homogenized sample and it was centrifuged at 5,000 rpm under room temperature for 1 0 minute. After addition of 60 ml PC IA (TE saturated phenol and CIA; 1 : 1 ), the upper aqueous phase was shaken and centrifuged at the same condition. This step was repeated again. To the upper aqueous phase, 160 J.LI acetic acid, 5 ml of 3 M NaOAC (pH 5.2) and 30
ml of isopropyl alcohol were added and the tube was centrifuged at 7,500 rpm and 4 OC for 30 minutes. The pellet was suspended in the 6 ml
40
guanidiumthiocyanate solution. After addition of 2.4 ml PCI to the tube, the sample was shaken and centrifuged at 15000 rpm under room temperature for 15 minutes. After addition of 0.8 ml CIA to the upper phase, the sample was shaken and centrifuged at 15,000 rpm under room temperature for 5 minutes.
The upper aqueous phase, 300 1-11 3M sodium acetate (pH 5.2) and 7.5 ml of
99.5°/o ethanol was added to it and it was centrifuged at 15,000 rpm under room temperature for 15 minutes. The pellet was dried up in air and resolved 2 ml of diethylpyrocarbonate (DEPC) water.
Purification of messenger RNA
Messenger RNA was purified from total RNA by Oligotex-dT30 super (Takara). 500 1-11 The Elution buffer (10 mM Tris-HCL (pH 7.5), 1 mM EDTA and 0.1 °/o SDS) was added to ajust 250 1-11 of total RNA (2 1-1g/ml). After 500 1-11
Oligotex-dT30 super was added to it, incubated 67 OC for 7 minutes and placed on ice for 3 minutes. After 250 1-11 5M NaCI was added to it, the sample was
shaken gently at 37 OC for 10 minutes and centrifuged at 5,000 rpm under room
temperature for 5 minutes. The pellet was washed with 1 ml washing buffer (1 0 mM Tris-HCL (pH 7.5), 1 mM EDTA, 0.5M NaCI and 0.1 °/o SDS), centrifuged at 5,000 rpm under room temperature for 5 minutes. And 500 1-11 DEPC water was added to the pellet and the sample was mixed, the mixture was incubated 67 OC for 7 minutes and placed on ice for 3 minutes. The sample was centrifuged at 5,000 rpm under room temperature for 5 minutes. The supernatant was
transferred to a new tube and 1 ml of 99°/o ethanol and 40 J.LI of 3M NaOAc (pH 5.2) were added to it and the sample was centrifuged at 15,000 rpm under 4 OC
for 5 minutes. The pellet was washed with 70°/o ethanol and resolved in 20 Jll DEPe water.
Northern hybridization
Three micrograms of mRNA was electrophoresed on 1 .0°/o agarose containing 18 °/o formaldehyde for 3 hours at 75 V and blotted onto a nylon membrane. Northern hybridization was done in the rapid hybridization buffer (Amersham) at 65 OC overnight with 32P-Iabeled eDNA as a probe. The nylon membrane was washed twice in 1 X SSe buffer containing the 1 °/o SDS 65 OC for 20 minutes, then twice in 0.1 X SSe buffer containing the 1 °/o SDS 65 OC for 30 minutes. The banding patterns of labeled eDNA s were detected on X-ray film at -80 OC for 1 week.
DNA Sequencing
Nucleotide sequencing of the cloned DNA was performed by the dideoxy chain-termination method using the Taq dye primer cycle sequencing kit (Amersham) with an Applied Biosystem 377 automatic DNA sequencer.
DNA extraction and Southern hybridization These procedures were described in chapter. 1
42
Results
To confirm the allelic relationships among the nine d1 mutants FL2, H0532, H0533, H0537, H0538, H0541, H0552, CM392 and CM1729, allelic tests were done. All of F1 hybrids from the crosses between FL2 and each of H0532, H0533, H0537, H0538, H0541, H0552, CM392, and CM1729 showed d1 dwarf phenotype. These results confirmed that 9 mutant lines were caused by the mutation occurred in the d1locus.
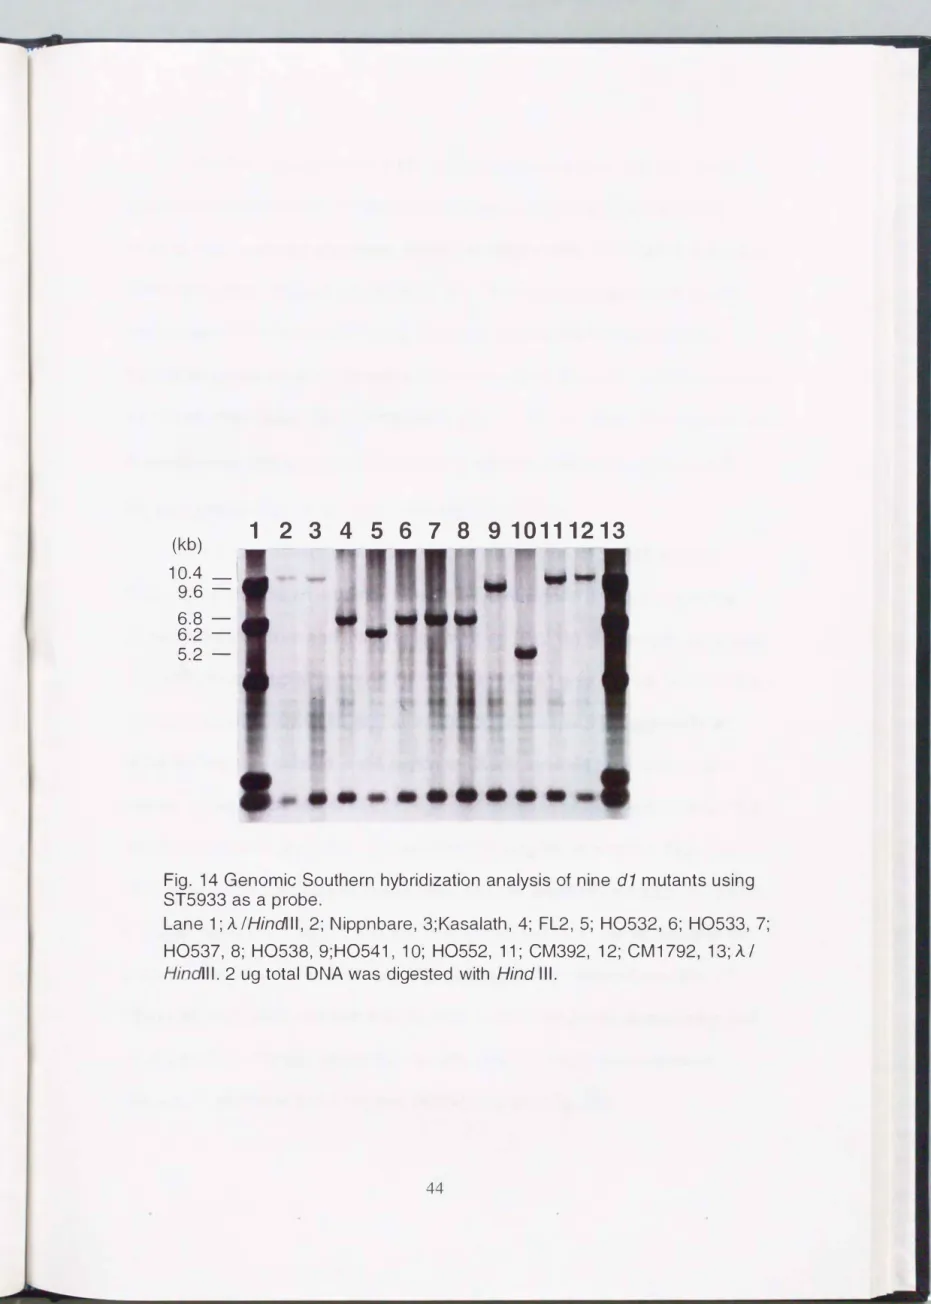
Genomic Southern hybridization analysis of these d 1 mutant lines and two wild-type varieties, Nipponbare (Japonica) and Kasalath (Indica), was done using 85933 as a probe (Fig. 14). The 1 0.4 kb band was observed in the two wild types, but there was no polymorphism between them. On the other hand, five different banding patterns were observed in 9 d 1 mutant lines ; the 6.8 kb bands were observed in FL2, H0533, H0537 and H0538, a 6.2 kb band in H0532, a 9.6 kb band in H0541 and a 5.2 kb band in H0552, 10.4 kb bands in CM392 and CM1729. In general, RFLPs were easily observed between
Japonica variety and Indica variety, but hardly detected among Japonica varieties. These results strongly suggest that several types of structural variations had occurred in the region of S5933 in the d1 mutant lines.
Messenger RNAs were extracted from the two wild types, Nipponbare, Kasalath and the four d 1 mutants FL2, H0532, H0541 and H0552 that showed different types of banding patterns in genomic Southern hybridization with S5933 as a probe.
(kb) 10.4 _I
9.6- 6.8-6.2- 5.2-
1 2 3 4 5 6 7 8 9 10111213
Fig. 14 Genomic Southern hybridization analysis of nine
d1
mutants using ST5933 as a probe.Lane 1;
A /Hindlll,
2; Nippnbare, 3;Kasalath, 4; FL2, 5; H0532, 6; H0533, 7;H0537, 8; H0538, 9;H0541, 1 0; H0552, 11; CM392, 12; CM1792, 13;
A I Hindi II.
2 ug total DNA was digested withHind Ill.
44
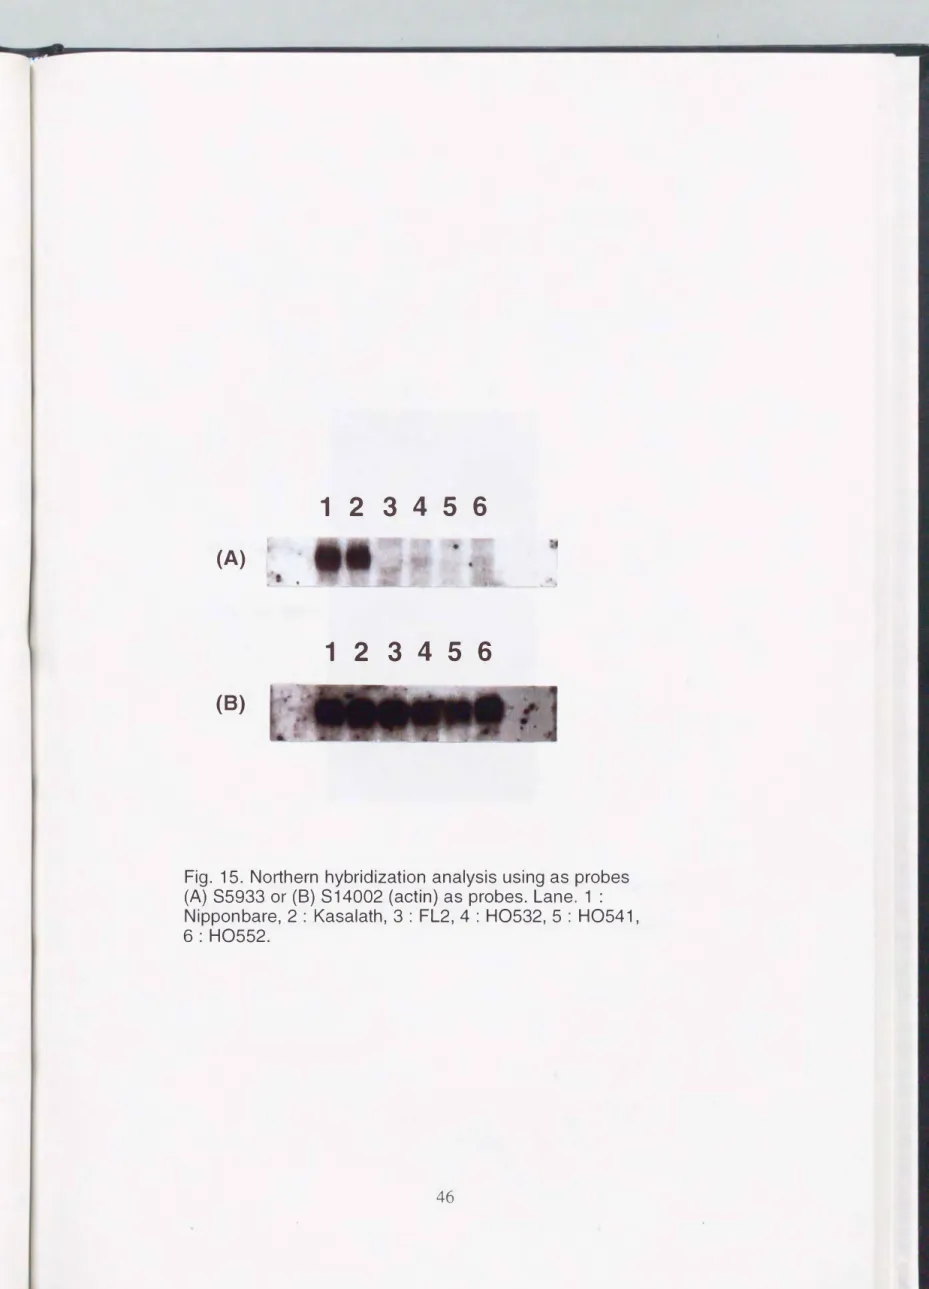
Northern analysis was done with 85933 as a probe (Fig. 15). As a positive control, 814002 (actin) was also used as a probe. The translated product was observed with equal density in Nipponbare, Kasalath and the four
d1 mutants when probed with S 14002 (Fig. 15-B), indicating that volume of
messenger RNAs on the filter were all equal. On the other hand, a 1 .8-kb
translated product was observed in Nipponbare and Kasalath but not in the four d1 mutant lines using 85933 as a probe (Fig. 15-A). The size of the product was
in accordance with size for mRNA of the a subunit of rice heterotrimeric GTP-
binding protein (Seo et al. 1995, Ishikawa et al. 1995).
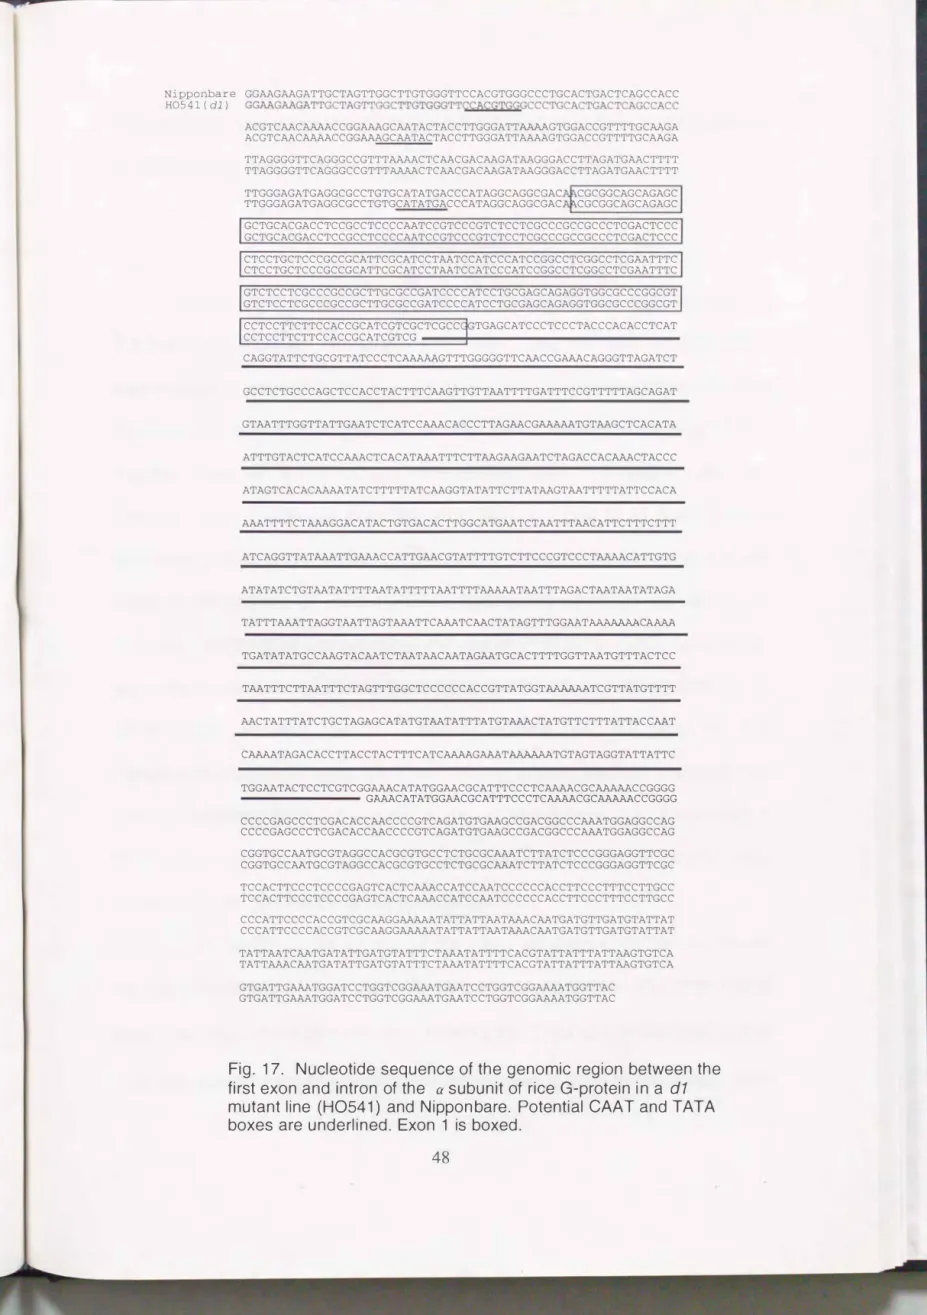
To detect differences of sequence in the region of 85933 among Nipponbare and the d1 mutants, primers were designed and the sequence between the first exon and intron was amplified (Fig. 16). The amplified product was 1550 bp in Nipponbare and FL 2. That in H0541 was 700 bp. No amplified product was observed in H0532 and H0552. These results suggested that about 850 bp was deleted in the region of 85933 in Ho541 and primer site change or large deletion of 85933 region occurred in H0532 and H0552. The structural mutation of another region of 85933 may be occurred in FL2. The 1550 bp amplified product in Nippon bare and the amplified products of 700 bp in H0541 were inserted to TA vector and sequenced. Nucleotide between the first exon and intron in H0541 was 833 bp shorter than Nipponbare (Fig. 17).
This result coincides well with the genomic Southern hybridization pattern that used 85933 as a probe; about 800-bp difference in length was observed between Nippon bare (1 0.4 kb) and H0541 (9.6 kb) (Fig. 14).
123456 (A)
123456 (B)
Fig. 15. Northern hybridization analysis using as probes
(A)
85933 or(B)
814002 (actin) as probes. Lane. 1 : Nippon bare, 2 : Kasalath, 3 : FL2, 4 : H0532, 5 : H0541, 6: H0552.46
1 2 3 4 5
1550 bp �
700bp �
Fig. 16. Amplification of the genomic region between the first exon and the first intron in 85933.
lane 1: Nippon bare, 2: FL2, 3: H0532, 4: H054 1, 5: H0552.
Nipponbare GGAAGAAGATTGCTAGTTGGCTTGTGGGTTCCACGTGGGCCCTGCACTGACTCAGCCACC H0541(d1) GGAAGAAGATTGCTAGTTGGCTTGTGGGTTCCACGTGGGCCCTGCACTGACTCAGCCACC ACGTCAACAAAACCGGAAAGCAATACTACCTTGGGATTAAAAGTGGACCGTTTTGCAAGA ACGTCAACAAAACCGGAAAGCAATACTACCTTGGGATTAAAAGTGGACCGTTTTGCAAGA TTAGGGGTTCAGGGCCGTTTAAAACTCAACGACAAGATAAGGGACCTTAGATGAACTTTT TTAGGGGTTCAGGGCCGTTTAAAACTCAACGACAAGATAAGGGACCTTAGATGAACTTTT TTGGGAGATGAGGCGCCTGTGCATATGACCCATAGGCAGGCGAC CGCGGCAGCAGAGC TTGGGAGATGAGGCGCCTGTGCATATGACCCATAGGCAGGCGAC CGCGGCAGCAGAGC GCTGCACGACCTCCGCCTCCCCAATCCGTCCCGTCTCCTCGCCCGCCGCCCTCGACTCCC GCTGCACGACCTCCGCCTCCCCAATCCGTCCCGTCTCCTCGCCCGCCGCCCTCGACTCCC CTCCTGCTCCCGCCGCATTCGCATCCTAATCCATCCCATCCGGCCTCGGCCTCGAATTTC CTCCTGCTCCCGCCGCATTCGCATCCTAATCCATCCCATCCGGCCTCGGCCTCGAATTTC GTCTCCTCGCCCGCCGCTTGCGCCGATCCCCATCCTGCGAGCAGAGGTGGCGCCCGGCGT GTCTCCTCGCCCGCCGCTTGCGCCGATCCCCATCCTGCGAGCAGAGGTGGCGCCCGGCGT CCTCCTTCTTCCACCGCATCGTCGCTCGCC TGAGCATCCCTCCCTACCCACACCTCAT CCTCCTTCTTCCACCGCATCGTCG
CAGGTATTCTGCGTTATCCCTCAAAAAGTTTGGGGGTTCAACCGAAACAGGGTTAGATCT
GCCTCTGCCCAGCTCCACCTACTTTCAAGTTGTTAATTTTGATTTCCGTTTTTAGCAGAT GTAATTTGGTTATTGAATCTCATCCAAACACCCTTAGAACGAAAAATGTAAGCTCACATA ATTTGTACTCATCCAAACTCACATAAATTTCTTAAGAAGAATCTAGACCACAAACTACCC
ATAGTCACACAAAATATCTTTTTATCAAGGTATATTCTTATAAGTAATTTTTATTCCACA AAATTTTCTAAAGGACATACTGTGACACTTGGCATGAATCTAATTTAACATTCTTTCTTT
ATCAGGTTATAAATTGAAACCATTGAACGTATTTTGTCTTCCCGTCCCTAAAACATTGTG
ATATATCTGTAATATTTTAATATTTTTAATTTTAAAAATAATTTAGACTAATAATATAGA TATTTAAATTAGGTAATTAGTAAATTCAAATCAACTATAGTTTGGAATAAAAAAACAAAA
TGATATATGCCAAGTACAATCTAATAACAATAGAATGCACTTTTGGTTAATGTTTACTCC TAATTTCTTAATTTCTAGTTTGGCTCCCCCCACCGTTATGGTAAAAAATCGTTATGTTTT AACTATTTATCTGCTAGAGCATATGTAATATTTATGTAAACTATGTTCTTTATTACCAAT
CAAAATAGACACCTTACCTACTTTCATCAAAAGAAATAAAAAATGTAGTAGGTATTATTC
TGGAATACTCCTCGTCGGAAACATATGGAACGCATTTCCCTCAAAACGCAAAAACCGGGG --- GAAACATATGGAACGCATTTCCCTCAAAACGCAAAAACCGGGG CCCCGAGCCCTCGACACCAACCCCGTCAGATGTGAAGCCGACGGCCCAAATGGAGGCCAG CCCCGAGCCCTCGACACCAACCCCGTCAGATGTGAAGCCGACGGCCCAAATGGAGGCCAG CGGTGCCAATGCGTAGGCCACGCGTGCCTCTGCGCAAATCTTATCTCCCGGGAGGTTCGC CGGTGCCAATGCGTAGGCCACGCGTGCCTCTGCGCAAATCTTATCTCCCGGGAGGTTCGC TCCACTTCCCTCCCCGAGTCACTCAAACCATCCAATCCCCCCACCTTCCCTTTCCTTGCC TCCACTTCCCTCCCCGAGTCACTCAAACCATCCAATCCCCCCACCTTCCCTTTCCTTGCC CCCATTCCCCACCGTCGCAAGGAAAAATATTATTAATAAACAATGATGTTGATGTATTAT CCCATTCCCCACCGTCGCAAGGAAAAATATTATTAATAAACAATGATGTTGATGTATTAT TATTAATCAATGATATTGATGTATTTCTAAATATTTTCACGTATTATTTATTAAGTGTCA TATTAAACAATGATATTGATGTATTTCTAAATATTTTCACGTATTATTTATTAAGTGTCA GTGATTGAAATGGATCCTGGTCGGAAATGAATCCTGGTCGGAAAATGGTTAC
GTGATTGAAATGGATCCTGGTCGGAAATGAATCCTGGTCGGAAAATGGTTAC
Fig. 17. Nucleotide sequence of the genomic region between the first exon and intron of the a subunit of rice G-protein in a d1 mutant line (H0541) and Nippon bare. Potential CAA T and TAT A boxes are underlined. Exon 1 is boxed.
48
These results may suggest a d 1 mutant H0541 is caused by lack of expression of GTP-binding protein by a structural deficiency in the gene.
Discussion
A sries of d1 mutant lines as well as wild type variety were analyzed by Southern and Northern hybridization analysis using the EST (S5933) which was a possible candidate gene of 01 as a probe. Southern analysis showed that five different polymorphisms among thed1 mutant lines (Fig.14). By Northern analysis, a 1.8-kb translated product was observed in wild type varieties, was not observed in the four d1 mutant lines (Fig.15-A). In addition, the sequencing analysis indicated that the region between the first exon and first intron of S5933 in a d1 mutant H0541 lacked 833 bp sequence. Based on Southern, Northern and sequencing analysis of d1 mutant, S5933 encodes 01 gene and transcription of S5933 is not be transcribed in four d1 mutant lines. To verify strictly whether the EST S5933 encode the 01 gene or not, complementation test is required. Therefore, the cosmid clones carrying the 01 gene is screened from the cosmid library of Nipponbare, and the clones is transformed into the d 1 mutant. Subsequently, observation of transformants showing normal phenotype or not is required.
Rice dwarf mutant d1 shows the dwarf phenotype as well as shows various phenotypes of dark green leaves, compact panicles and short round grains. As these characters are all induced by the d1 gene, the rice a subunit of heterotrimeric GTP-binding protein that 0 1 encodes is likely to play a key role in
controlling growth and development. In addition to the genetic and molecular evidence described above, the modulation technique of gene expression supports our conclusion that d1 is caused by a structural deficiency in the a
subunit of GTP-binding protein; that is, the antisense eDNA of wild-type RGA 1 caused a dwarf phenotype
(Y.
Iwasaki, personal communication).Since d1 mutant in rice was classified into gibberellin insensitive dwarf mutant (Mitsunaga et al.
1 994),
01 gene may associate with gibberellins (GAs) signal transduction. Gibberellins (GAs) are large families of tetracyclicditerpenoid plant growth-hormones, It involved in a number of plant growth and development processes such as seed germination, stem elongation, flowering and fruit development (Crozier
1 983).
Gas also regulate expression of alphaamylase in the cereal aleurone layer (Baulcombe and Buffard
1983,
Nolan and Ho1 988).
There were many mutants with respected to gibberellins. They were classified into several types of dwarf mutant with GA deficient; non-response to GA, reduced response to GA, weak response to GA, and over sensitiveresponse to GA (constitutive response and enhanced response)(Ross et al.
1 997).
GA biosynthetic pathways have been investigated well by characterizingGA-deficient mutant plants, and several genes coding enzymes catalyzing steps in GA biosynthesis were isolated from these mutants (Sun et al.
1992,
Sun andKamiya
1 994,
Xu et al.1 995,
Chiang et al.1995,
Winkler and Helentjaris1 995).
For example, in GA-sensitive dwarf mutant /e in pea, first identified by Gregor Mendel, phenotype is reversed by treatment GA1 and the mutant was shown to be deficient in gibberellin-3-beta-hydroxylase which converts GA20 to GA1 in the
50
GA biosynthetic pathway (Lester et al. 1997, Martin et al. 1997).
On the other hand, since insensitive, constitutive and enhanced GA mutants possibly lack the signal or made errors in the signal transduction pathway of GAs, and therefore analysis of these mutants can open the cue to clarify molecular mechanisms of signal transduction by GAs. Several mutants were defined as non response GA mutants, for example, GAl in Arabidopsis (Koornneef et al. 1985, Peng and Harberd 1993), DB and 09 in maize (Harberd and Freeling 1989, Winkler and Freeling 1994), Rht3 in wheat (Ho et al. 1981 ), as constitutive GA respond mutants spy and rga in Arabidopsis (Jacobsen and Olszewski 1993, Silverstone et al. 1998), sin in barley (Chandler 1988, Lanahan and Ho 1 988). GAl gene (gibberellin insensitive) and spy gene (elongated constitutive activating GA signal) were isolated in Arabidopsis (Jacobsen et al.
1996, Peng et al. 1997). Spy containing a tetratricopeptide (TPC) repeat region acts to suppress GA signal transduction, and it is epistatic to gai included Spy acting on downstream of GAl (Jasobsen et al. 1996). But the mechanisms of signal transduction triggered by GAs are still not clear. Because the rice mutant d1 has been characterized as GA-insensitive (Mitsunaga et al. 1994), the identification of the gene responsible for the phenotype might contribute to the elucidation of the signal transduction pathways related to GA if the dwarfing is caused by a deficiency in these pathways. Very recently, it has been shown that heterotrimeric G-proteins are associated with inducing the expression of the alpha-amylase in oat aleurone by gibberellin (Jones et al. 1998). This result is very significant, because alpha-amylase isregulated by gibberellic acids (GAs)
in the cereal aleurone layer (Baulcombe and Buffard1983, Nolan and Ho1988).
Recently, a putative G-protein-coupled receptor which influences sensitivity to one of the cytokinins (GPCR or GCR) has been identified in Arabidopsis (Josefsson and Rask 1997, Dymock et al. 1998). Since heterotrimeric GTP
binding protein plays an important role in signal transduction in animals and microbes (Gilman 1987, Neer 1995, Hamm 1998), in several plant species (Terryn et al. 1993, Ma 1994), the G-protein encoded by 01 gene in rice may associate with GA signal transduction.
In this study, it is concluded that rice dwarf 01 gene encodes a subunit
of heterotrimeric GTP-binding protein and the protein plays an important role of cellular growth, differentiation and development in plant. As the result of lack of the signal, d1 mutants may show abnormal phenotype such as dwarf, compact panicle and small round grain. Author suggested the a subunit of heterotrimeric
GTP-binding protein in rice was associated with GA signal transduction.
Characterization of the GTP-binding protein that definition the mutation caused by GA-insensitivity and analyses of the structure of plausible plant hormone receptors and the biochemical interactions between the receptor and G-proteins are required to clarify the G-protein-mediated signal transduction system in plants.
Dwarf mutants in plants are crucial for elucidating the mechanisms for plant growth and development. Dwarf mutants have been isolated in many plant species and have been extensively analyzed for their mode of inheritance and their response to plant hormones (Reid 1993, Hooley 1994, Ross et al. 1997). In
52
rice, at least 60 dwarf mutants were known (Kinoshita 1995), but only the 2 mutants, d 18 and d35, are known to have a deficiency in gibberellin biosynthetic pathways