Title An active transposon mPing facilitates the discovery of usefulflowering time mutant genes in rice( Dissertation_全文 )
Author(s) Xu, Quan
Citation Kyoto University (京都大学)
Issue Date 2014-03-24
URL http://dx.doi.org/10.14989/doctor.k18323
Right 学位規則第9条第2項により要約公開; 許諾条件により本文は2015-10-01に公開
Type Thesis or Dissertation
An active transposon mPing facilitates the
discovery of useful flowering time mutant
genes in rice
Xu Quan
2014
Contents
Chapter Ⅰ Introduction ... 2
Chapter Ⅱ Mapping and characterization of a novel flowering time gene Se15 ... 6
Introduction ... 6
Material and Method ... 7
Result ... 10
Chapter Ⅲ mPing SCAR marker is applicable to a cross combination between Gimbozu and its mutants ... 21
Introduction ... 21
Material and Method ... 22
Result ... 26
Discussion ... 36
Chapter Ⅳ The effects of the photoperiod insensitive alleles, se13, hd1 and ghd7, on yield components ... 38
Introduction ... 38
Material and Methods ... 40
Results ... 42
Discussion ... 48
Chapter Ⅴ Conclusions ... 51
Acknowledgments ... 53
Chapter Ⅰ Introduction
Rice (Oryza sativa) is a major cereal crop that provides a dietary staple for more than half of the world population. Rice is commercially planted in a wide range of latitude from 55°N to 35°S. This wide regional adaptability of rice was attained by the complex regulation system of flowering time. Flowering time of rice is controlled by the basic vegetative growth period (BVP) and photoperiod sensitivity (PS). BVP is a period of the photoperiod insensitive juvenile phase securing the sufficient vegetative growth under flowering inductive short day-length condition. PS is a degree of flowering retardation under long day-length condition. Recent molecular biological studies combined with quantitative trait locus (QTL) analyses of flowering time in rice have successfully revealed several key genes that involve with the natural variations of flowering time essential for the regional adaptability. Yano et al. (2000) successfully isolated Hd1 locus that promotes flowering under short day condition and suppresses flowering under long day condition. Xue et al. (2008) demonstrated the sequence analysis of allelic variants at one of the most important PS gene of Ghd7. According to their results, Ghd7 contributed to both productivity and adaptability of cultivated rice on a global scale. Wei et al. (2010) reported that the natural mutation of the DTH8 gene caused weak PS, and also indicated that DTH8 plays an important role in the signal network of photoperiodic flowering as a novel suppressor. Ghd7 control number of grains per panicle and plant height (Xue et al. 2008). The combined effects of Hd1 and Ehd1 reduce the number of primary branches in panicles (Endo-Higashi and Izawa 2011). Transgenic plants bearing Hd3a showed changes in multiple traits of vegetative organs, such as elongation of internodes and increased number of tillers (Tamaki et al. 2007).
In Arabidopsis (Arabidopsis thaliana), many studies on flowering time have been conducted by utilizing a rich resources of flowering time mutants induced in various ecotypes. Consequently, physiological and biochemical functions of many genes involving in photoperiodic response have been reported, and several genetic regulatory of the photoperiod sensitivity have been proposed (Reeves and Coupland 2001; Hayama et al. 2003; Baurle and Dean 2006). Thus, induced mutants are useful materials for the investigation of novel functions of flowering time genes in rice. Tanisaka et al. (1992) investigated the flowering time of the mutants HS lines derived from gamma-ray
irradiation seeds of japonica rice variety ‘Gimbozu’ (GB) (Fig 1). To find out the function of the mutant genes, QTL analysis and subsequent map-based cloning has been used. In QTL analysis, both GB and a HS line were crossed with indica rice variety Kasalath to clarify the chromosome location of the mutant gene locus (Yuan et al. 2009; Saito et al. 2012). In most cases, several loci were segregating in both cross combinations. However, QTL analysis revealed a specific QTL observed only in the cross combination of HS and Kasalath. This specific QTL indicated the location of mutant gene in a HS line. Based on the result of this rough mapping of a mutant gene, fine mapping of a mutant allele using the segregating population derived from the cross between the HS line and a chromosome segment substitution line (CSSL) that harbors Kasalath chromosome segment corresponding to the mutant allele in the genetic background of Japanese variety, ‘Nipponbare’ (NB). However, the use of such distant cross combinations to conduct QTL analysis disturbs efficient identification of the candidates because of hybrid seed sterility and the reference cross combination of GB and Kasalath. Therefore, it is important to develop an efficient method to narrow down the candidate gene causing flowering time mutation.
mPing was reported as the first active miniature inverted-repeat transposable element as well as the first active DNA transposon in rice (Jiang et al. 2003; Kikuchi et al. 2003; Nakazaki et al. 2003). A subsequent study revealed that mPing copy number was increased about 40 copy per plant per generation in GB (Naito et al. 2006). In addition, mPing copy number was amplified to over 1000 copies in GB and its closely related Aikoku land races, while mPing copy number was less than 50 in most of the Japanese cultivars (Naito et al. 2006). mPing SCAR (Sequence characterized amplified region) marker that is based on the polymorphic insertion of mPing between GB and other Japanese cultivars has been exhibited to usable for QTL analysis (Monden et al. 2009). Thus, cross combination of mutant lines originated from GB (HS lines) and NB is considered to be useful for rough mapping of mutant alleles through the linkage analysis with the polymorphic insertion of mPing SCAR marker and mutant allele.
In this study, I demonstrated the successful mapping and characterization of a novel flowering time gene Se15 with the use of mPing SCAR marker system (Chapter II). Furthermore, mPing SCAR markers could be used to map the mutant gene using the cross combination of mutant lines and their original variety, namely HS57 × GB and HS113 × GB (Chapter III). Lastly, I evaluated productivity of three photoperiod insensitivity mutant alleles induced in GB under ehd1 deficient genetic
background (Chapter IV). This exhibited the valuable usage of mutant induced in the same genetic background to investigate the effects of photoperiod insensitivity genes on the productivity in rice.
Figure 1
The variation of flowering time in HS lines and their original variety GB (indicated by gray bar). 0 20 40 60 80 100 120 140 H S 22 H S 26 3 H S 25 1 H S 66 H S 57 H S 52 H S 32 H S 11 0 H S 50 H S 10 5 H S 11 3 H S 11 2 H S 43 H S 25 4 H S 28 H S 21 8 H S 10 1 GB H S 11 8 H S 17 7 H S 23 H S 20 3 H S 63 H S 17 H S 27 6 H S 16 9 H S 24 Day s to flow e ring
Chapter Ⅱ Mapping and characterization of a novel flowering time
gene Se15
Introduction
Flowering time (also called heading time in cereals) plays a principal role in the regional adaptability of plant that determinates an optimum time to flower through environmental signals, such as water supply, nutrition conditions, temperature and day length. Among them, day length (= photoperiod) is one of the most important environmental signals for floral induction because of the constant seasonal change throughout the years. Rice is widely cultivated in the world from the equator to northern and southern latitude of 40°-50°. Thousands of varieties are cultivated in various environmental conditions and each variety is well adapted in their own environmental conditions. A photoperiodic response is the central characteristics for their regional adaptabilities. As results of many genetic analyses of photoperiodic response in rice, as many as 25 flowering time loci have been identified (Ichitani et al. 1998; Poonyarit et al. 1989). However, only a few genes were isolated to disclose their physiological functions.
In Arabidopsis, which is regarded as a model plant for a long day plant, many studies on flowering time have been made utilizing a large number of flowering time mutants induced from various ecotypes. Consequently, physiological and biochemical functions of many flowering time genes involving in photoperiodic response have been reported, and several genetic regulatory system including photoperiod sensitivity have been proposed (Koornneef and Peeters 1997; Reeves and Coupland 2001; Hayama et al. 2003; Baurle and Dean 2006). Thus, efficient analysis many mutant genes in rice is very important to investigate their roles in the adaptability and productivity.
Here I report the identification of an early flowering time mutant gene se15 using mPing SCAR marker which provide enough number of DNA markers even in japonica × japonica cross combination. Se15 encodes a Jumonji N (JmjN), a Jumonji C (JmjC) and a Zinc finger protein and acts as a critical regulator repressing flowering under long day condition. In addition to the effect of Se15 on flowering time, se15 also increased the grain number per panicle. Thus, this novel mutant allele
Material and Method
Plant materialIn this study, early mutant of HS254, its original variety GB and a F2 population derived from the cross between HS254 and the typical japonica variety Nipponbare (NB) were used. HS254 was induced by gamma-irradiation to the seeds of a japonica rice variety GB. Germinated seeds were sown in nursery beds in a green house. After 30 days from sowing, the seedlings were transplanted into a paddy field in Kyoto (35°01′N lat.). All seeds were sown on 26 April and transplanted on 23 May with plant spacing 10 cm by 30 cm. N, K2O and P2O5 fertilizers were applied in quantities of 60, 90 and 90 kg/ha, respectively. Flowering time was recorded for each plant when the first panicle emerged from the leaf sheath of the flag leaf.
Effects of se15 on photoperiod response
Two photoperiods of short day condition (10h light / 14h dark) and long day condition (14h light / 10h dark) were used. Photoperiod treatments were conducted using two growth cabinets without temperature control. Ten pots of each line were placed under each photoperiod after sowing. In
addition to natural daylight (8:00–18:00), artificial light of incandescent lamps (3.24 Wm−2 at soil
surface) was used for the supplemental irradiation for the 14h photoperiod treatments. The
experiment was conducted from May 1st to early October in 2010. Flowering time was recorded for
each plant when the first panicle emerged from the flag leaf sheath.
Mapping for Se15
HS254 was cross with NB and F2population of 96 plants was used for the rough mapping of mutant gene. Fifteen days after transplanting, the leaves of all F2 plants were sampled for DNA extraction. The flowering date was recorded for every F2 plant. The linkage analysis was conducted by using the mPing SCAR marker (Monden et al. 2009) which is polymorphic between GB and NB.
Sequence analysis of candidate gene
Following to the rough mapping, genes located at the candidate region were listed according to the Rice Annotation Project Database (RAP-DB: http://rapdb.dna.affrc.go.jp/). To narrow down the
candidate gene, listed genes were subjected to similarly search against flowering time related genes reported in Arabidopsis with the BLAST program. The flowering time related genes of Arabidopsis were selected. Then, the sequence analysis of candidate genes were conducted with the primer sets based on the genome sequence of a candidate gene in RAP-DB. Template DNA sample was extracted from the fresh leaves (about 100-200 mg) of the mutant lines and GB. After PCR amplification, the products were separated by electrophoresis on a 2% agarose gel. Then, amplicons were purified using a Qiaquick Gel Extraction kit for sequencing analysis.
Effect of se15 on yield components
GB and HS254 were grown in the paddy rice field at the experimental farm of Kyoto university (Osaka, Japan; 34o51’N, 135o37’E) during the summer of 2012. Seeds were sown in the seedling nursery on April 24th and transplanted to the paddy field with 30 cm × 15 cm density. Plots were arranged in a randomized block design with three replications. To measure the growth rate of the plants, leaf emergence was periodically observed on the main shoot in three plants per plot. Also, the number of tillers of three plants per plot was counted weekly. At the mature stage (35 days after the full heading stage), the above-ground parts of 12 plants were harvested from each plot. After counting the panicle number of these plants, the panicles were hand threshed. Harvested seeds were put into the water to separate sank grains (filled grains) and floated grains (unfilled grains). The filled and unfilled grains were then oven dried at 80oC for two days to measure their dry weight. The number of grains per panicle and grain filling percentage were calculated based on the above data. Three average sized panicles were taken from each plot to observe the number of primary branches, number of secondary branches, and number of spikelets on each branch.
Interactions between other flowering time genes.
The early flowering mutant HS110 and X61 which were induced from GB harbor a defective mutant allele at the Hd1 and Se13 locus, respectively. The late flowering mutant lines HS169 which were induced from GB harbors a defective mutant allele at Ehd1 locus (Saito et al. 2009). EG2 harbors a defective allele of Ghd7 in the GB genetic background. HS110, X61, HS169 and EG2 were crossed with HS254 to raise the double recessive lines, DMG26 (se15hd1), DMG27 (se15se13),
cultivated under natural condition and flowering time of all the plants was recorded when the first panicle emerged from the sheath of the flag leaf.
Result
HS254 conferring a weak photoperiod sensitivity
HS254 flowered about 2 weeks earlier (99.5 ± 0.7 d) than GB (114.0 ± 1.1 d) under field natural field condition (Fig.2). To investigate the effects of se15 on the photoperiod response, HS254 and GB were grown under short day-length SD condition and long day-length (LD) condition. Under SD conditions, HS254 flowered 3.1 d later than GB. Under LD condition, HS254 flowered 13.1 d earlier than GB. Thus, the difference between the LD and SD condition in HS254 was much smaller than that in GB (Fig.2). Thus, the normal function of Se15 enhances photoperiod sensitivity.
Mapping of Se15
The F2 population of the cross of HS254 × NB exhibited a segregated distribution of flowering time within the parental ranges and clearly divided into the early type (HS254 type) and late type (NB type) (Fig.3a). The ratio of early type (29 plants): late type (64 plants) fit to the expected 1 : 3 ratio (x2=1.96: 0.1 < P < 0.25) (Fig. 3a). This clearly indicated that the early flowering of HS254 is governed by a single recessive mutant gene. The linkage analysis showed that an mPing SCAR marker MK10_13 on chromosome 10 was closely linked with the mutant gene (Fig. 3b). Using additional markers, the location of the mutant gene was narrowed down into 1.2 Mb region from MK10_13 to the end of chromosome 10 (Fig. 3c). Among the listed genes at this region, Os10g0577600 showed significant similarity with ELF6 of flowering time related gene in Arabidopsis. The sequence analysis revealed a 7bp-deletion at the 6th exon of the Os10g0577600 in HS254. This deletion caused a frame shift mutation and a premature stop codon (Fig.3d). These results indicate that Os10g0577600 locus corresponds to Se15 and that the early flowering of HS254 is caused by the loss of function mutation induced at Os10g0577600.
Se15 encodes a JmjC and a Zinc finger domain
Based on the RAP_DB, Se15 encodes a JmjC domain(Fig. 4) and potentially functions as histone demethylases (Sun and Zhou 2008). Previous study has revealed 20 and 21 JmjC domain containing genes in rice and Arabidopsis, respectively. Moreover, Se15 contained a C5HC2 zinc finger and a
potential zinc ligand binding residues, and may bind DNA or RNA.
Effects of defective allele se15 on yield components
In comparison with GB, the weight of above ground biomass, number of panicles per plant, panicle length, and number of grains per panicle were increased in HS254. Especially number of grains per panicle was significantly increased in HS254. On the other hand, percentage of filled grains and 1000 grain weight were decreased in HS254 (Fig. 5). In the details observation of panicle architecture, the number of secondary branches was increased on most of the primary branches of HS254. This modification in panicle structure mainly caused the increase of number of grains per panicle (Fig. 6).
Plant height, number of leaf and number of tiller were observed every five days after the transplanting. Before the flowering, GB and HS254 emerged 16 leaves and 14 leaves, respectively. During the vegetative growth period, the leaf emergence rate of HS254 and GB was almost identical. However, HS254 showed rapid increase in plant height and number of tiller at the beginning of vegetative growth period. At the flowering stage, however, the significant difference between HS254 and GB was not observed in plant height and number of tiller (Fig.7).
Flowering time of DMG lines
DMG26 (se15hd1) flowered earlier (58 ± 1d) than HS110 (60 ± 1.2d) and HS254 (66.4 ±
0.9d). DMG28 (se15ehd1) flowered earlier (109.2 ± 0.7d) than HS169 (125.2 ± 0.9d) but later than HS254. DMG29 (se15ghd7) flowered earlier (62.4 ± 0.6d) than EG2 (64 ± 1.18d) and HS254(Fig. 8). DMG26 and DMG29 were both flowered earlier than single mutants, which suggesting that Se15 functions as an additive and independently affects on both Hd1 and Ghd7. DMG28 flowered earlier than HS169, which showed that Se15 does not repress flowering through Ehd1, and ehd1 deficient allele can elongate the flowering time of HS254. Thus, under LD condition, Se15 repress flowering independently of Hd1, Ehd1 and Ghd7. Interestingly, DMG27 (se15se13) flowered later(74.8 ± 0.9d) than HS254 but later than X61(71.6 ± 0.6d) (Fig. 8), suggesting that there is complex relationship between Se15 and Se13.
Figure 2
Phenotype of the HS254 and the GB. (a) Plants GB and its early mutant line HS254. (b) Flowering time of HS254 and GB under different day length conditions (means ± sd, n=5). ND means nature day length condition, SD means 10h light/14h dark, LD means 14h light/10 h dark
0 20 40 60 80 100 120 140 ND SD LD Day s to f low e ri n g GB HS254
GB HS254(
se15
)
a
b
Figure 3
Mapping of the Se15 gene.(a) Frequency distribution for days to flowering in the F2 population from the cross combination between HS254 and NB. White and black bars indicate the ranges of flowering date of HS254 and NB, respectively. (b) The mPing SCAR marker MK10_13 was closely linked with the mutant gene. (c) The result of mapping of mapping using the F2 population of cross combination between HS254 and NB . The black arrow indicates the candidate region of mutant gene. (d) Schematic representation of the genomic sequence of the Se15 gene. Gray and black boxes indicate the UTR region and exon region, respectively.
Figure 4
The gene structure of Se15. (a) Sequence of coding region and its amino acid sequence of Se15 in GN and HS254. (b) The deletion site at JmjC domain in se15 mutant allele
Figure 5
The effects of se15 on yield components. (a) Panicles of GB and HS254. (b) Grains from the main panicle of GB and HS254. (c) to (i) Comparisons of yield components between GB and HS254. Values are means ± s.d. (n=10).
Figure 6
Effects of Se15 on panicle architecture. (a) An example of the schematic diagram of panicle architecture. Each row indicates a primary branch. (b) A schematic diagram of the panicle architecture of GB and HS254.
Figure 7
Plant height, leaf emergence rate and number of tillers during the period from transplanting to flowering in GB and HS254. Asterisks indicate significant differences by Student’s t-test at the 0.05 level(n=18).
Figure 8
Days to flowering of original variety GB, single recessive lines and double recessive lines under natural day length condition.(means= ± s.d., n=5)
Discussion
In this study, I easily narrowed down the candidate region of Se15 with the use of mPing SCAR marker. Then, as the RAP-DB search for this region and sequence analysis, Os10g0577600 which is contained a JmjC domain was found to be encoding Se15 gene. JmjC domain containing proteins have been identified as histone lysine demethylases which regulated gene expression and plant development through influencing chromatin remodeling. There are 20 JmjC domain containing genes in rice genome and they are classified into five subgroups. Se15 belongs to the JMJD2 subgroup which contains one JmjN domain, one JmjC domain and one Zinc finger domain. In Arabidopsis, two genes of ELF6/JMJ11 and RLF6/JMJ12 were classified in JMJD2 subgroup and both genes regulate flowering time of Arabidopsis (Noh et al. 2004). In rice, Se15 might be a homologue gene of ELF6/JMJ11 and also regulating flowering time of rice.
JmJC domain containing protein can modulate brassinosteroid, Plant steroid hormone which is of great importance for plant growth and development in Arabidopsis. Mutations in ELF6 genes lead to brassinosteroid related phenotype, including impaired cell elongation and reduced the expression of brassinosteroid target genes. ELF6 can interacts with bri1-EMS-suppressor 1 (BES1) and that the expression of brassinosteroid-regulated genes decrease in elf6 mutants, suggesting that ELF6 were recruited by BES1 to modulated the expression of target genes (Yu et al. 2008). In rice, there is no report about how JmJC domain contained gene affects to Brassinosteroid, but several Brassinosteroid-insensitive or deficient mutants were identified. Loss of function of a rice brassinosteroid-insensitive 1 homolog prevents internode elongation and bending of the lamina joint (Yamamuro et al. 2000), a rice brassinosteroid deficient mutant ebisu dwarf showed erect leaf and semi-dwarf phenotype (Hong et al. 2003), the DWARF AND LOW TIKKERING mutant showed erect leaf, semi-dwarf and few tiller phenotype (Tong et al. 2009). The brassinosteroid mutants showed phenotype of semi-dwarf and erect leaf which are not observed in HS254. Thus, in rice, JmJC domain was not involved in brassinosteroid regulate pathway, or the function of JmJC domain to brassinosteroid was different between rice and Arabidopsis.
Previous study revealed that a T-DNA insertion mutant of Os10g0577600 (JMJ706) increases di-and tri-methlation of H3K9 and affects the spikelet development of rice. In JMJ706, altered floral morphology and organ number were observed (Sun and Zhou 2008), but it effect on the flowering
time was not observed. In addition, no abnormal spikelet development was observed in HS254. Thus, phenotypic effects in JMJ706 and that in HS254 are quite different. In JMJ706, the insertion of T_DNA at the promoter region of Os10g0577600 completely disturbs gene transcription. On other hand, the 7bp deletion at Os10g0577600 only changed the end of JmjC domain in HS254 (Fig. 12b). In order to clarify the function of incomplete transcript of Os10g0577600, further study should be conducted.
Rice was originally a short day plant well adapted to warm intermediate latitudes, therefore, commercial rice production had been impractical in high latitudes, such as in Hokkaidao(Japan) and HeiLongJiang province(China), until early flowering time variety with weak photoperiod sensitivity were developed in the early twentieth (Okumoto et al. 1996). Previous genetic analysis for flowering time demonstrated that varieties well adapted to high latitudes all harbor e1 at the E1 (Ghd7) locus, suggesting that e1 (ghd7) is an essential gene of the high latitude varieties. Therefore, the weak photoperiod sensitivity varieties are required in the high latitudes. Despite the weak photoperiod sensitivity, se15 mutant also showed several advantage in agronomic traits, such as the bigger panicle and the more number of grains per panicle. This makes se15 mutant has a great use value in rice breeding.
Chapter Ⅲ mPing SCAR marker is applicable to a cross combination
between Gimbozu and its mutants
Introduction
mPing is identified as the first active miniature inverted-repeat transposable element (Jiang et al. 2003; Kikuchi et al. 2003; Nakazaki et al. 2003). A subsequent study revealed that GB is acquiring almost 40 novel insertions of mPing per plant per generation. This indicates that additional 40 available mPing SCAR markers are produced per plant per generation (Naito et al. 2006). The HS lines were derived from the gamma-irradiated seeds of GB approximately forty years ago. Then, mPing has been increasing its copy number independently in GB and its mutant lines. Thus, mPing SCAR markers might be utilizable to identify the mutant gene(s) using the cross combinations between GB and its mutants. These populations are ultimate segregating population for mapping mutant gene(s) because only mutant allele is segregating.
In this study, I conducted mapping of HS57 and HS113 using the cross combination HS57 × GB and HS113 × GB.
Material and Method
Plant materialTwo mutant lines of HS57 and HS113 that were induced by gamma-irradiation to the seeds of
japonica rice variety GB and two F2 populations derived from cross combinations of HS57 × GB and
HS113 × GB were used. In 2009, germinated seeds of all the materials were sown in nursery beds in a green house. Thirty days after sowing, the seedlings were transplanted into a paddy field in Kyoto (35°01′N lat.). Parental lines (50 plants / line) were also planted with their F2 populations (96 plants / cross combination). All seeds were sown on 26 April and transplanted on 23 May with plant spacing 10 cm × 30 cm. N, K2O and P2O5 fertilizers were applied in quantities of 60, 90 and 90 kg/ha, respectively. Flowering time was recorded for each plant when the first panicle emerged from the leaf sheath of the flag leaf. All plants were sampled for DNA extraction.
Photoperiodic response for short and long day length
Seeds were disinfected by soaking in a benlate - methyl -1-[(buthylamino)carbonyl] – H – benzimidazol – 2 –y lcarbamate—solution (diluted with water 1000-fold) at 20 °C for 24 h, and were pre-germinated by soaking in water at 30 °C for 2 days. Ten seeds were sown on field soil in a 3.6-L pot, and were covered with granulated soil. Seedlings were thinned to 5 plants per pot 14 days after sowing. Every other week, 20 mL 0.2% (w/v) Hyponex (mixed fertilizer including 6% nitrogen, 10% water-soluble phosphoric acid and 5% water-soluble potassium; HYPONex Co. Ltd, Osaka, Japan) solution was applied to each pot as additional fertilizer. Plants were grown in a controlled-growth cabinet under short day length (SD) conditions (10-h light / 14-h dark) or long day length (LD) conditions (14.5-h light / 9.5-h dark). In addition to natural daylight (8:00–18:00), supplementary artificial light from incandescent lamps (3.24 Wm-2 at soil surface) was used for the LD conditions. Flowering time was recorded for each plant when the first panicle emerged from the leaf sheath of the flag leaf. Three replications were grown for estimating the average of days to flowering under each day length condition.
Estimation the number of mPing copy by quantitative PCR
The number of mPing copy in GB, HS57 and HS113 were estimated by real-time PCR based on the amplication of the genomic region of mPing. The real-time PCR was carried out in a total volume 20 μl containing 5μl genomic DNA (0.5~1ng/μl), 4μl sterile water, 10μM of each primer and 10μl Light cycler 480 SYBR Green I Master (Roche). At least 3 PCR reactions using the same template DNA were performed to obtain the average value for the number of mPing copy. The PCR cycle with Light cycler 480 was as followed: 2min at 50°C, then 10 min at 95°C, followed by 45 cycles of 5s at 95°C, 30s at 60°C and 1s at 72°C. Amplification data were standardized by the amplication of Actin as internal controls. The NB genomic DNA which has 51 copies of mPing was used as reference genome. The number of mPing copy was determined by relative quantities in each sample on the reference genome.
The diversity of mPing insertion by the transposon Display
Transposon display (TD) analyses for the original variety GB, HS57 and HS113 were conducted according to the protocol (Tsukiyama et al. 2013). 100 ng of the genomic DNA was digested with MseI (New England Biolabs) at 37°C for 16 hours, then ligated to an adapter. Primary PCR was carried out in a 10μl mixtures reaction which was containing 1μl of PCR buffer (10 mM Tris-HCl [pH 8.3], 50 mM KCl, and 0.1% Triton X-100), 200 μM dNTP, 1.5 mM MgCl2, 5% (v/v) DMSO, 500 nM first adapter- and TE-specific primers, 10 ng of adapter-ligated DNA, and 0.2 U of ex-Taq DNA polymerase (Takara). Primary PCR conditions were as follows: PCR started with pre-denaturation for 3 min at 94°C followed by 7 cycles of touchdown PCR, the 1st touchdown cycle consisted of a denaturation step for 30s at 95°C, an annealing step for 45s at 64°C, and an extension step for 45s at 72°C, from 2nd cycle, annealing step temperature was lower by 1°C per cycle until the temperature reached 58°C. Touchdown PCR was followed by 30 cycle of polymerization reaction, each containing of a denaturation step for 30 s at 95°C, an annealing step for 45 s at 58°C, and an extension step for 45 s at 72°C, with a final extension step for 7 min at 72°C. PCR products were diluted 10-fold with 1/10 TE buffer and used as templates for secondary PCR.
Secondary PCR was performed with the same reaction mixtures and same PCR condition as primary PCR except the primer. Second TE-specific primers were labeled with Cy3 to visualize bands in a 9% polyacrylamide gel. Primers and adapters are listed in supplemental Table 2.
Identification of the polymorphism of mPing SCAR marker
mPing SCAR markers were used to identify the polymorphism among GB, HS57 and HS113. Each DNA was extracted by TPS method (100mM Tris-HCl pH8.0, 1M KCl and 10mM EDTA). The PCR for mPing SCAR markers was performed in 5 µL containing 0.5 µL 10× PCR buffer, 0.5 µL dNTP mix (2 mM each), 0.25 µL DMSO, 0.02 µL Ex-Taq (TAKARA), l00 ng genomic DNA and 8 pmol of forward and reverse primers. The PCR cycling parameters were as follows: 94°C for 3 min; 30 cycles of 95°C for 30 s, 58°C for 45 s and 72°C for 3 min; 72°C for 3 min. Amplicons were electrophoresed in a 1.0% agarose gel, stained with ethidium bromide and visualized under UV light.
Mapping of the mutant genes
The F2 populations, comprising 96 plants for each cross combination (HS57 × GB and HS113 × GB) were grown under a natural photoperiod in Kyoto. The sowing date and the transplanting date were 11 May 2009 and 9 June 2009, respectively. flowering date was recorded for each plant when the first panicle emerged from the leaf sheath of the flag leaf. Linkage analyses were conducted using mPing SCAR marker for the rough mapping of mutant genes. In addition, the fine mapping of the HS113 mutant gene was done using the cross combination between HS113 and SL25. SL25 is one of the CSSL lines which carries a chromosome segment of Kasalath genome on the distal end part of the long arm of chromosome 5 in the genetic background of NB. For the fine mapping of the mutant gene, two SSR (simple sequence repeat) markers and 1 SNP marker were used in to narrow down the candidate region of the mutant gene.
Expression of Hd1 in GB and HS57
Total RNA was extracted from leaves by using the SDS–phenol method (Shirzadegan et al. 1991). Total RNA (2.5 – 3.0 μg) was primed with the dT18 primer by using Superscript II Reverse Transcriptase (Invitrogen), in accordance with the manufacturer’s instructions. qRT–PCR analysis was performed by the TaqMan qRT–PCR method using an ABI7900HT (Life Technologies Inc.). cDNA corresponding to 50 ng of total RNA was used as the template for each TaqMan qRT–PCR. The PCR conditions were 10 min at 95°C, followed by 45 cycles of 15 s at 95°C, 60 s at 65°C and 1 s at 72°C. To quantify the expression of, Hd1 and UBQ (internal control), I used the specific primers and probes.
Result
Photoperiodic responses of the mutant lines
Both HS57 and HS113 flowered 10-15 days earlier than GB under natural day length condition and LD conditions. Under SD condition, HS57 flowered slightly later than GB and HS113 and GB flowered at the same time (Fig. 9). These results indicate that HS57 and HS113 harbor mutations in the genes regulating PS.
Variations of copy number and insertion sites of mPing in GB HS57 and HS113
HS57 and HS113 were induced from GB over forty years ago. Then, they have self-pollinated several generation since then. Therefore, mPing insertions might be independently increased in each HS lines as well as GB. Experimental results of quantitative PCR exhibited that the copy numbers of mPing were not significantly different among GB, HS57 and HS113 (Fig.10, Fig. 12). However, the mPing insertion sites of three lines are quite different from each other (Fig. 11, Fig 12). This indicates that mPing SCAR markers based on the unique insertion sites of GB are available for mapping mutant gene in the cross combination between HS line and GB.
Mapping and Identification of mutant genes
Among 331 mPing SCAR marker that were prepared based on the mPing insertion site in GB, 140 and 141 markers were found to be polymorphic between GB and HS57, and HS113, respectively. At least three mPing SCAR markers are available on each chromosome.
The frequency distribution of flowering time in the F2 population of HS57 × GB exhibited a segregated distribution within the parental ranges and was clearly segregating early type (HS57 type) and late type (GB type) (Fig. 13a). The ratio of early type (19 plants): late type (74 plants) fit to the expected 1 : 3 ratio (x2=1.036: 0.25 < P < 0.50) (Fig. 13a). Thus, The early flowering of HS57 is governed by a single recessive mutant gene. The linkage analysis showed that an mPing SCAR marker, MK6_51, was closely linked with the mutant gene (Fig. 13b). Using additional markers, the chromosomal location of the mutant gene was narrowed down to 6.2 Mb region between MK6_47 and MK6_64 on the short arm of chromosome 6 (Fig. 13c). Among the candidate region, Hd1, which
sequence analysis of the exon regions of Hd1 gene could not find the difference between HS57 and GB. But, there is the HS57 specific insertion of a transposable elements Ping at the 239bp upstream of the Hd1 transcriptional start site (Fig. 13d).
Similarly, the frequency distribution of flowering time in the F2 population of HS113 × GB exhibited a segregated distribution within the parental ranges and was clearly segregating into early type (HS113 type) and late type (GB type) (Fig. 14a). The ratio of early type (30 plants): late type (64 plants) fit to the expected 1 : 3 ratio (x2=2.397: 0.10 < P < 0.25). This confirmed that early flowering of HS113 was governed by a single recessive mutant gene and was narrowed down into the 6 Mb region between MK5_16 to the end of chromosome 5 (Fig. 14b, c). According to RAP-DB, there are estimated 800 genes located in this region including no known flowering time related gene. Using the cross of HS113 × SL 25, I could narrow down the candidate region of mutant gene to 0.4Mb region (Fig. 14d). In this region, there are 35 estimated genes. Among them, I selected five genes considered as photoperiod sensitivity related genes and conducted the sequence analysis of these five genes. However, no sequence difference was found in ORF and promoter region between HS113 and GB. Therefore, I could not determine the mutated gene in HS113.
I also sampled about 10 early type (HS113 type) plant in the F2 population of the cross of HS113 × GB. The DNA of the 10 plants was extracted as bulked sample to conduct a transposon display. To find the mPing insertion site link to the early flowering phenotype, insertions specific to early type F2 plants and HS113 was picked up for sequence analysis. Only one mPing insertion site linked to the mutant gene, but this insertion was not the cause of the mutation in HS113 (data was not shown). However, it is possible to find a closely linked marker with the above mentioned method.
Expression of Hd1 in HS57 and GB
The expression level of Hd1 was decreased from ZT12 to ZT21 under long day condition which was caused by the ping insertion in the promoter region of Hd1 in HS57 (Fig. 15). Hd1 converted to flowering repressor from flowering promoter when the day length condition changed to long day from short day(Yano et al. 2000). Consequently, the decrease of Hd1expression level in HS57 may weak the repression of Hd1 under long day condition, which lead to an early flowering phenotype.
I also compared the flowering date of HS57 to that of another known Hd1 mutants HS110 which has a mPing insertion at the intro of Hd1 (Yano et al. 2000) at three different sowing date, Early
sowing (23 April), middle sowing (8 May) and late sowing (22 May). The results show that HS57 flowering date is later than HS110 in all three sowing time, especially in early sowing. This indicates that the photoperiod sensitivity of HS57 is stronger than that of HS110. Although HS57 and HS110 both have non-functional allele of Hd1 gene, the differences of gene structures among the alleles cause the slight change in phenotype.
Figure 9
Phenotype of the HS57 and HS113. (a) Plants of GB and mutants when mutant flowering under ND condition. (b) Flowering time of mutants and GB under different day length conditions (means±sd, n=5). ND means nature day length condition, SD means 10h light/14h dark, LD means 14h light/10 h dark
Figure 10
Copy numbers of mPing in the GB and HS lines estimated by quantitative PCR. 0 100 200 300 400 500 600 700 800 900 GB H S1 7 HS2 2 HS2 3 HS2 4 HS3 2 H S4 3 HS5 0 HS5 2 HS5 7 HS6 3 HS6 6 HS1 0 1 HS1 0 5 HS1 1 0 HS1 1 2 HS1 1 3 HS1 1 8 HS1 6 9 HS1 7 7 HS2 0 3 HS2 1 8 HS2 5 1 HS2 5 4 HS2 7 6 N o. of mPing copies
Figure 11
Figure 12
Results of transposon display in GB, HS57 and HS113. (a) Copy numbers of mPing estimated by quantitative PCR in the GB, HS57 and HS113. (b) Results of transposon display by using TCA and TAT selective base in GB, HS57 and HS113. The black arrow indicates the shared mPing insertion in GB, HS57 and HS113. The white arrow indicates the GB specific mPing insertion.
Figure 13
Mapping of the mutant gene in HS57. (a) Frequency distribution for days to flowering in the F2 population from the cross combination between HS57 and GB. White and black bars indicate the ranges of flowering date of HS57 and GB, respectively. (b) The mPing SCAR marker MK6_51 was closely linked with the mutant gene. (c) The result of mapping using the F2 population of cross combination between HS57 and GB. The black arrow indicates the candidate region of mutant gene on chromosome 6. (d) The insertion site of Ping at the up-stream region of Hd1. Gray and black boxes indicate the UTR region and exon region, respectively. The number besides the gray box indicates the insertion site of Ping counted from the transcript start site.
Figure 14
Mapping of the mutant gene in HS113. (a) Frequency distribution for days to flowering in the F2 population from the cross combination between HS113 and GB. White and black bars indicate the ranges of flowering date of HS57 and GB, respectively. (b) The mPing SCAR marker MK5_17 was closely linked with the mutant gene. (c) The result of mapping using the F2 population of cross combination between HS113 and GB. The black arrow indicates the candidate region of mutant gene on chromosome 5. (d) The fine mapping using the F2 population of cross combination between HS113 and SL25. The black arrow indicates the candidate region of mutant gene.
Figure 15
Quantitative RT-PCR analysis of Hd1 in GB and HS57. leaves were sampling at ZT0 from 21 d-old plant under long day condition. The rice UBQ gene was used as the internal control. Values are shown as mean ± s.d. of three independent experiments.
Discussion
Marker-assisted selection and quantitative trait locus (QTL) analysis are being routinely performed in crop genetics research. Although the use of DNA markers has become a powerful tool for crop breeding, low levels of DNA polymorphism which is often found among closely related rice cultivars has made it difficult to apply DNA analysis. Single nucleotide polymorphism (SNP) is one of the promising DNA markers as its high frequency of polymorphism between the closely related organisms. Since the high accuracy sequence data of NB became available (2005), detection of SNPs has become very effective by using NB sequence as a reference. Among Japanese varieties, however, they are sharing several chromosomal regions. These shared regions among varieties are unsuitable to apply SNPs as DNA markers. Wang et al. (2009) defined genome regions with low frequently of SNPs among rice cultivars as SNP deserts. Moreover, the detection of SNP requires genome wide re-sequencing analysis (McNally et al. 2009; Wang et al. 2009) and the utilization of SNPs for the genotyping in a large mapping population are still very expensive. These restrict the application of SNPs as a DNA marker in the cross combination between Japanese varieties.
As mPing is the active MITE element in GB and HS line, mPing has increased its copy independently among GB and its mutant lines in every generation. Thus, mPing SCAR markers are utilizable to identify the mutant gene(s) using the cross combinations between GB and its mutants. These populations are ultimate materials for mapping mutant gene(s) because no other genes are changed without the mutant gene(s). The general mapping strategy, however, is not able to be used due to no available polymorphic marker between mutants and its original variety. The mPing SCAR marker is an amazing marker which is utilizable to identify the mutant gene(s) using the cross combinations between GB and its mutants.
Recent molecular genetic studies and quantitative trait locus (QTL) analyses of flowering-time genes in rice have revealed several key genes involved in the natural variations for the regional adaptability. Yano et al. (2000) isolated Hd1 locus which promote flowering under short day condition, suppressed flowering under long day condition from the mutation of GB. Xue et al. (2008) demonstrated that Sequence analysis of allelic variants at the Ghd7 locus, which controls flowering time through its enhanced expression under long-day conditions, contributed greatly to
the natural mutation of the DTH8 gene caused weak photoperiod sensitivity, and also indicated that DTH8 probably plays an important role in the signal network of photoperiodic flowering as a novel suppressor. Thus, the natural variations of the regulatory in flowering time are good resources for genetic analysis of flowering time in rice. Time-consuming map-based cloning, however, are needed to address the candidate gene from the natural variants due to a lot of polymorphism are found in many genes in addition to the target gene(s). Further, it is quite difficult to identify the crucial genes responsible to the floral induction from the natural variants, because the plants harboring mutations in these genes would not be positively selected due to the low reproductive ability.
Large scale random mutagenesis has been utilized to successfully facilitate the identification of novel flowering time genes (Yuan et al. 2009; Saito et al. 2011). Once a polymorphism was found in a gene comparing between the mutants and its origin, the gene must be currently the target gene because mutation treatments typically introduce single nucleotide changes or small deletions in the genome. Further, the increasing availability of genome-wide information also promotes the identification of flowering time genes. Two complete plant genome sequences, one from a dicot and one from a monocot, have revealed that a floral induction mechanism is evolutionally conserved between rice, a short-day plant, and Arabidopsis, a long-day plant (Izawa et al. 2003; Hayama and Coupland 2004). In this study, homology searches of Arabidopsis flowering time genes against rice genes were able to extract the candidate genes and to make us identify the mutant genes efficiently.
Chapter Ⅳ The effects of the photoperiod insensitive alleles, se13, hd1
and ghd7, on yield components
Introduction
Flowering time is closely associated with the grain yield in rice (Oryza sativa L.). The seasonal change in day length (known as the photoperiod) is a key environmental cue to initiate floral induction(Hayama and Coupland 2004; Yano et al. 2001). The timing of flowering is an important agricultural trait not only for the successful reproduction, but also for the preferable balance between vegetative growth and reproductive growth duration. In rice, a facultative short-day plant, decreasing day length is a critical environmental signal for the phase transition from the vegetative to the reproductive phase(Itoh et al. 2010). In temperate regions, where seasonal changes in day length are distinct, most of the rice varieties exhibit appropriate photoperiod sensitivity to maximize their productivity. Therefore, photoperiodic sensitivity is a critical agronomic trait that can be exploited to improve the adaptability rice varieties to a wide range of latitudes, altitudes and seasons(Izawa 2007).
Recent studies have revealed the details of the genetic regulation of photoperiod sensitivity (PS). In rice, PS is determined by the antagonistic regulation of the inhibiting pathways under long day (LD) conditions and the promoting pathways that are suppressed by the inhibiting pathways(Komiya et al. 2009). Among the inhibiting pathways, Hd1 inhibits flowering by suppressing the expression of Hd3a that encodes the flowering signal called florigen(Kojima et al. 2002; Yano et al. 2000). Se13 encodes a key enzyme for the biosynthesis of the phytochrome chromophore that is indispensable for receiving the day-length signal via red and/or far-red light(Saito et al. 2011). Ghd7 inhibits flowering under LD by suppressing the expression of Ehd1 that is an activator of the florigen-like genes, Hd3a and RFT1(Xue et al. 2008; Doi et al. 2004; Komiya et al. 2008). Hd1 and Ghd7, which are known to be core PS genes, independently control PS and the pleiotropic effects on yield related traits of rice(Tsuji et al. 2011). The combined effects of Hd1 and Ehd1 reduce the number of primary branches in panicles(Endo-Higashi and Izawa 2011). Transgenic plants bearing Hd3a showed
number of tillers(Tamaki et al. 2007). Finally, Ghd7 affects the grain number(Xue et al. 2008). However, the genetic effects of these genes have not been investigated against the same genetic background to compare their effects on yield components.
Photoperiod insensitivity is an important trait to that can be exploited to breed a valuable rice variety adapted to a wide range of latitudes(Khush 2001). Up to now, several kinds of loss-of-function alleles at the PS gene loci have been used to make rice photoperiod insensitive. However, the effects of photoperiod insensitive alleles in yield traits should be clarified to utilize them for the breeding of a valuable photoperiod insensitive variety. In temperate regions, however, photoperiod insensitive lines flower too early to achieve sufficiently long vegetative growth periods. Their excessively short vegetative growth periods are accompanies by the abnormal development of their reproductive organs such as the panicle and the inflorescence. Thus, it is difficult to distinguish the exact effects of photoperiod insensitive alleles on yield components from their indirect effects caused by the shortened vegetative growth period.
To overcome this obstacle, I evaluated photoperiod insensitive alleles at the PS locus with the combined use of an ehd1 allele, which is a recessive non-functional allele of Ehd1. The ehd1 allele lacks the flower promoting effect, which ensures sufficient vegetative growth. In this study, I investigated the effects of three recessive photoperiod insensitive alleles, se13, hd1 and ghd7, on yield components by combining them with ehd1. I found that these three alleles have distinctly different effects on yield components.
Material and Methods
Plant materialsThree flowering time mutants, X61, HS110 and Hs169, which originated from the same japonica variety known as ‘Gimozu’ (GB) were used in this study(Table 1). X61 harbors a recessive non-functional allele at the Se13 locus and is completely lacking a photoperiodic response(Saito et al. 2011). HS110 harbors a photoperiod insensitive allele at the Hd1 locus(Yano et al. 2000) (Yano et al. 2000). HS169 is a late flowering time mutant with a recessive non-functional allele at the Ehd1 locus(Saito et al. 2009). In addition to the three mutant lines of GB, EG2 was also used for this study. EG2 is a tester line of flowering time genes derived from a cross between ‘Aikoku’ and GB. ‘Aikoku’ is a landrace that harbors a recessive photoperiod insensitive allele at the E1 locus, which is identical to the Ghd7 locus(Yamagata et al. 1986). GB was developed from ‘Aikoku’ by a natural mutation. Thus, the four lines in this study, X61, HS110, HS169 and EG2, share the same genetic background of GB. To create the double recessive line (DMG), I performed the following three cross combinations of X61×HS169, HS110×HS169 and EG2×HS169 to create DMG2, DMG3 and DMG10, respectively.
Field experiments
All the materials were grown in the paddy rice field at the Experimental Farm of Kyoto University, (Osaka, Japan; 34o51’N, 135o37’E) during the summer of 2012. Seeds were sown in the seedling nursery on 24 April and transplanted with one seedling per hill on 23 May. Each plot was 5.4 square metersand included 120 plants with planting densities (hill per m2) of 22.2 (30 cm╳15 cm intervals). Plots were arranged in a randomized block design with three replications. Fertilizers were applied with a basal dressing amount of 60 kg N per hectare, 90 kg P per hectare and 90 kg K per hectare.
Measurements of yield components
To measure the growth rate of the plants, leaf emergence was periodically observed on the main shoot in three plants per plot. Also, the number of tillers of three plants per plot was counted weekly. At the full heading stage, when 90% of the stems of each plant had emerged from the panicle, the above-ground parts of eight plants were measured from each plot. Then, these samples
mature stage (35 days after the full heading stage), the above-ground parts of 24 plants were harvested from each plot. After counting the panicle number of these plants, the panicles were hand threshed and put into water. The filled grains that sank in water were separated from unfilled grains that did not sink in water. The unfilled grains were further classified into empty (non-fertilized grains) and partially filled grains (poorly developed grains) with the naked eye. Seed sterility was determined by the ratio of non-fertilized grains to total grains. The filled and unfilled grains were then oven dried at 80oC for two days to measure their dry weight. The number of grains per panicle and grain filling percentage were calculated based on the above data. Three average sized panicles were taken from each plot to observe the number of primary branches, number of secondary branches, and number of spikelets on each branch. In addition to these morphological traits, the fraction of radiation interception (FRI) was measured by liner photosynthetically active radiation (PAR) ceptometer (AccuPAR, Decagon, USA) under a cloudy sky. The measurement of FRI was conducted from the transplant stage until the mature stage with one week intervals. The daily FRI was interpolated by two successive measurements. The daily intercepted radiation was calculated using the incident photosynthetically active radiation measured by the weather station located at the edge of the field.
Results
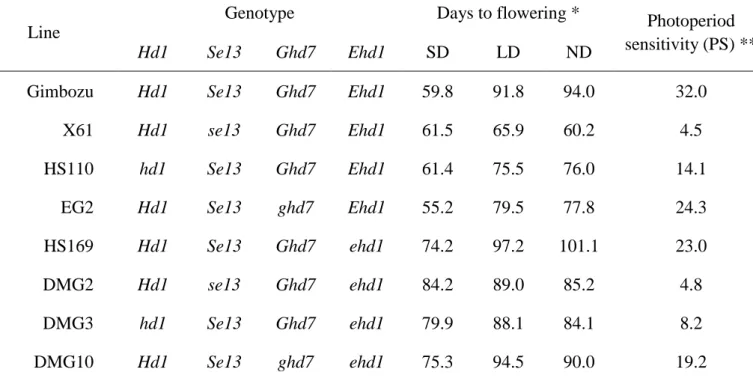
Under normal day-length conditions (ND), X61 (se13/Ehd1), HS110 (hd1/Ehd1) and EG2 (ghd7/Ehd1) headed (=flowered) earlier than GB, taking 33.8, 18.0 and 16.2 days, respectively. On the other hand, DMG2 (se13/ehd1), DMG3 (hd1/ehd1) and DMG10 (ghd7/ehd1) headed earlier than HS169 by 15.9, 17.0 and 11.1 days, respectively. The early flowering effects of the three photoperiod insensitive alleles were partly suppressed by the effects of ehd1 as expected (Table 1). The degrees of PS, which was measured by the differences in days to flowering between SD and LD, were 32.0, 4.5, 14.1 and 24.3 in GB, X61, HS110 and EG2, respectively. Among the three alleles, se13 exhibited a distinctly different effect on the reduction of PS in the presence of the functional Ehd1 allele. The degrees of PS were 23, 4.8, 8.2 and 19.2 in HS169, DMG2, DMG3 and DMG10, respectively. Thus, effects of the photoperiod insensitive alleles on PS tend to decrease when combined with ehd1.
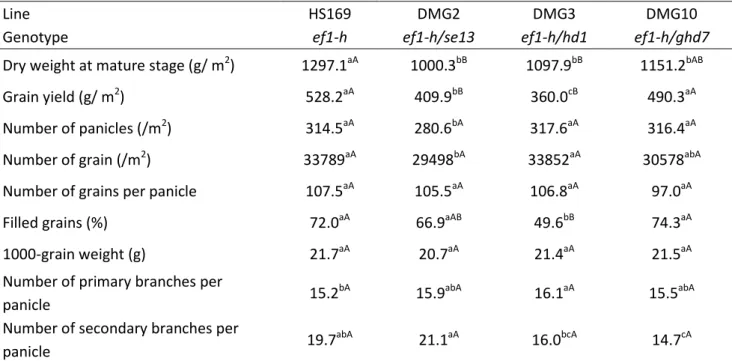
Table 2 shows above-ground biomass, grain yield and yield components of the four lines. Compared to HS169, all DMG lines showed a decrease in their total biomass at the mature stage. The grain yields of DMG2 and DMG3 were significantly decreased in comparison to HS169. The reduction in grain yield was observed in all DMG lines. However, the effects of three photoperiod insensitive alleles on yield components were not the same.
The grain yield of DMG2 was 19% lower than that of HS169. Main cause of this reduction is the reduction in the number of grains per square meter caused by the lower number of panicles (Table 2). The grain filling percentage and 1000-grain weight also tended to be decreased. The number of tillers of DMG2 was fewer than that of HS169 throughout the vegetative growth period (Fig. 16a). It was apparent that the leaf emergence rates and FRI of DMG2 were lower than that of HS169 (Fig. 16b and 16c). The intercepted radiation was also reduced in DMG2 compared to HS169 (Fig.17a). In DMG2, the total content of chlorophyll a and b in leaves was 4.48mg/g, while that of HS169 was 3.62mg/g. The deficiency of phytochromes reduced the chlorophyll content and the photosynthetic activity in HS169. This also led to a reduction in the grain filling percentage and the 1000-grain weight.
much higher than that of HS169, the low filled grain percentage of HS169 is likely caused by the failure of fertilization. Significant differences were not observed between DMG3 and HS169 in the number of panicles, the number of grains, the number of grains per panicle, or the FRI(Table 2 and Fig. 16f). Although the number of tillers in DMG3 was significantly less than that of HS169 during the 5th to 10th week after transplanting, the degradation of tillers in DMG3 during the late vegetative growth period was not as obvious as that of HS169(Fig. 16d). The number of primary branches per panicle was slightly increased, whereas the number of secondary branches tended to be decreased in DMG3. Thus, Hd1 promoted the development of the secondary branches during the panicle development period.
The grain yield of DMG10 was decreased by 9% in comparison to HS169, but this reduction was not significant (Table 2). The main cause of this reduction came from a reduction in number of the grains per square meter. The number of grains per panicle and the number of secondary branches also tended to be decreased in DMG10. In terms of panicle architecture, close observation revealed that the number of secondary branches was reduced on most of the primary branches in DMG10. The leaf emergence rate of DMG10 was almost indistinguishable from that of HS169 (Fig. 16h), whereas the number of tillers in DMG10 was less than that of HS169 during the first four weeks (Fig 16g). The FRI in DMG10 was higher than that in HS169 (Fig 16i), while the intercepted radiation in DMG10 was not different from that in HS169 (Fig 17c).
Table 1 Genotypes, days to flowering and photoperiod sensitivity under the three photoperiod conditions of the lines used in this study.
Line
Genotype Days to flowering * Photoperiod
sensitivity (PS) **
Hd1 Se13 Ghd7 Ehd1 SD LD ND
Gimbozu Hd1 Se13 Ghd7 Ehd1 59.8 91.8 94.0 32.0
X61 Hd1 se13 Ghd7 Ehd1 61.5 65.9 60.2 4.5
HS110 hd1 Se13 Ghd7 Ehd1 61.4 75.5 76.0 14.1
EG2 Hd1 Se13 ghd7 Ehd1 55.2 79.5 77.8 24.3
HS169 Hd1 Se13 Ghd7 ehd1 74.2 97.2 101.1 23.0
DMG2 Hd1 se13 Ghd7 ehd1 84.2 89.0 85.2 4.8
DMG3 hd1 Se13 Ghd7 ehd1 79.9 88.1 84.1 8.2
DMG10 Hd1 Se13 ghd7 ehd1 75.3 94.5 90.0 19.2
*: Days to flowering from sowing under short-day (10h light: SD), long-day (14.5h light: LD) and natural-day-length (ND) conditions.
Table 2 Effects of the photoperiod insensitive alleles se13, hd1 and ghd7 on yield components
Line HS169 DMG2 DMG3 DMG10
Genotype ef1-h ef1-h/se13 ef1-h/hd1 ef1-h/ghd7
Dry weight at mature stage (g/ m2) 1297.1aA 1000.3bB 1097.9bB 1151.2bAB
Grain yield (g/ m2) 528.2aA 409.9bB 360.0cB 490.3aA
Number of panicles (/m2) 314.5aA 280.6bA 317.6aA 316.4aA
Number of grain (/m2) 33789aA 29498bA 33852aA 30578abA
Number of grains per panicle 107.5aA 105.5aA 106.8aA 97.0aA
Filled grains (%) 72.0aA 66.9aAB 49.6bB 74.3aA
1000-grain weight (g) 21.7aA 20.7aA 21.4aA 21.5aA
Number of primary branches per
panicle 15.2
bA
15.9abA 16.1aA 15.5abA
Number of secondary branches per
panicle 19.7
abA
21.1aA 16.0bcA 14.7cA
Lower case letter difference indicates significance at 5% probability level,
capital letter difference means significance at 1% probability level by the Duncan’s new multiple range method.
Figure 16
Number of tillers (a, d and g), leaf emergence rate (b, e and h) and fraction of radiation intercepted (c, f and i) of HS169 in comparison to DMG2 DMG3 and DMG10 during the vegetative growth period (means ± s.d.). Asterisks indicate significant differences by the Student’s t-test at the 0.05 level.
Figure 17
The accumulation of the daily intercepted radiation at the flowering and the mature stage of DMG2 (a), DMG3 (b) and DMG10 (c) in comparison to HS169.
Discussion
Photoperiod insensitive alleles se13, hd1 and ghd7 promote flowering and reduce the biomass due to their short vegetative growth period (Tables 1 and 2). Interestingly, the reduction in yield of each DMG line was caused by distinct yield components other than reduced biomass. Reduction in the grain yield of DMG2 and DMG3 was attributed to the reduction in the grains per square meter and the grain filling percentage, respectively. Furthermore, in DMG2, the number of panicles per square meter, the grain filling percentage and 1000-grain weight were also decreased. The number of secondary branches also appeared to be decreased in DMG3 and DMG10. These findings suggest that each photoperiod insensitive allele has different effects on specific yield components.
Se13 encodes a protein involved in the phytochromobilin biosynthesis pathway, and an Se13-deficient mutant failed to produce the normal amount of the holo-protein of the phytochrome. As a result, the Se13-deficient mutant lost its light signal responses (Saito et al. 2011). DMG2, harboring a non-functional allele at the Se13 locus, loses the photoperiodic response and has pale green leaves due to a low content of chlorophyll a and b. Therefore, the decreased 1000-grain weight and grain filling percentage were caused by the low photosynthetic activity. Furthermore, the low Pfr/Pr ratio (a ratio of two types of phytochrome) enhances the apical dominant response and represses axillary shoot development (Deregibus et al. 1983; Casal et al. 1986; Smith and Whitelam 1997). Our results showed that the number of tillers in DMG2 was less than that of HS169 during the entire growth period (Fig. 16a). Thus, DMG2 is not able to receive the light signal because of the deficiency of phytochromobilin and its low Pfr/Pr ratio might inhibit tiller development.
Hd1, which is a rice ortholog of Arabidopsis CONSTANS (CO), encodes a protein with a zinc-finger domain containing a CCT motif (Yano et al. 2000). DMG3, which harbors a non-functional photoperiod insensitive allele due to the insertion of transposable element mPing at the intron of the Hd1 gene, flowered earlier than HS169 (Table 1). In DMG3, the grain filling percentage was significantly decreased due to the failure of fertilization. Such a drastic decrease in the grain filling percentage was not observed in other years or in its single recessive line of HS169 (Hd1/ehd1). Thus, the combined effects of hd1 and ehd1 cause genetic vulnerability in seed fertilization to
it appears that a sufficient amount of pollen did not fall on the stiGBa of DMG3, possibly due to the indehiscent anther. Further research should be done to clarify the combined effects of hd1 and ehd1 on seed fertility. I also found that the maximum number of tillers was significantly decreased in DMG3 from the 5th week to 10th week after transplanting, whereas the final number of tillers (= number of panicles) was not decreased (Fig. 16d). The deficiency of hd1 potentially reduces the number of ineffective tillers in the late vegetative growth period. The details of the pleiotropic effects of Hd1 need to be clarified much further.
Ghd7 not only regulates flowering time, but also has effects on plant height and number of grain per panicle. Ghd7 also changes the numbers of both primary and secondary branches (Xue et al. 2008; Xing and Zhang 2010). Our results showed that the number of secondary branches was decreased in DMG10, which harbors a recessive photoperiod insensitive allele, whereas the number of primary branches was not decreased in DMG10 (Table 2). It has also been reported that Ehd1 reduces the number of primary branches. If Ghd7 and Ehd1 independently regulate the number of primary branches, the combined effects of ghd7 and ehd1 could be observed. However, no significant difference in the number of primary branch was observed between HS169 (Ghd7/ehd1) and DMG10 (ghd7/ehd1). This suggests that ghd7 indirectly reduces the number of primary branches through the up regulation of Ehd1 expression. In addition, the number of tillers in DMG10 was less than that of HS169, at least during the first 4 weeks after transplanting (Fig. 16g). Therefore, Ghd7 might be involved in the development of axillary buds (which develop into tillers) on the main shoot and axillary buds (which develop into secondary branches) on the primary branches. DMG10 has a higher FRI than HS169, but similar intercepted radiation to HS169. This could be explained by two possible causes: the leaf area of DMG10 is larger than that of HS169, and/or DMG10 efficiently accepts solar radiation due to a less overlapping spatial arrangement of leaves. Among the three photoperiod insensitive alleles, only ghd7 reduced the PS without decreasing the number of tillers (Fig 16g, Table. 2). This is the unique advantage of ghd7 in the breeding of a photoperiod insensitive variety.
Most of the improved varieties have been made insensitive to photoperiod by the introduction of the photoperiod-insensitivity gene, and can be grown during any season and in most tropical and subtropical countries (Khush 2001). Recently, improved varieties have not only wide adaptability, but also tend to acquire the short vegetative growth duration. If the short-duration varieties
produce the same amount of grain in fewer days than medium-duration varieties, their per-day productivity could become much higher (Khush 2001). The present study demonstrated the effect of three photoperiod insensitive alleles on grain yield and yield component traits. Our results clarify the pleiotropic effects of flowering time genes on yield components independent of the shortened vegetative growth period. This will provide us with critical information that can be used to breed novel varieties with worldwide adaptability based on photoperiod insensitivity and to develop novel ecotypes to realize massive increases in rice yield.