家畜衛生学雑誌42-4表14.ai
K
199pDIC
ISSN 1347−6602 昭和62年6月9日学術刊行物認可
家畜衛生学雑誌 家畜衛生学雑誌
Vol.42 No.4 2017. FEB.
日 本 家 畜 衛 生 学 会
The Japanese Society of Animal Hygiene
The Japanese Journal of Animal Hygiene
家畜衛生学雑誌 第
42巻第 4号 二〇一七年二月 日本家畜衛生学会
複写される方へ
日本家畜衛生学会は有限責任中間法人 学術著作権協会(学著協)に複写に関する権利委託をしていますので,本誌に掲 載された著作物を複写したい方は,学著協より許諾を受けて複写して下さい.但し,社団法人日本複写権センター(学著協 より複写に関する権利を再委託)と包括複写許諾契約を締結されている企業の社員による社内利用目的の複写はその必要は ありません.(※社外頒布用の複写は許諾が必要です.)
権利委託先: 有限責任中間法人 学術著作権協会
〒107−0052 東京都港区赤坂9−6−41 乃木坂ビル3階
電話:03−3475−5618 FAX:03−3475−5619 E-mail:info@jaacc. jp
注意:複写以外の許諾(著作物の転載・翻訳等)は,学著協では扱っていませんので,直接日本家畜衛生学会へご連絡下 さい.[電話:042−367−5780]
また,アメリカ合衆国において本書を複写したい場合は,次の団体に連絡して下さい.
Copyright Clearance Center, Inc.
222 Rosewood Drive, Danvers, MA 01923 USA
Phone:1−978−750−8400 FAX:1−978−646−8600
家 畜 衛 生 学 雑 誌
日本家畜衛生学会 発行
President : Junsuke SHIRAI( )
Vice President : Shigeru MIYAZAKI( )
Editor-in-Chief : Shigeru MIYAZAKI( )
Editorial Board : Norihide KAKIICHI( )
Masuo SUEYOSHI ( )
Shinji TAKAI( )
Makoto NAGAI( )
Sadao NOGAMI( )
Hideto FUKUSHI( )
"""""""""""""""""""""""""""""""""""""""""""
家畜衛生学雑誌42-4表23.ai
The Japanese Journal of Animal Hygiene
Published by the Japanese Society of Animal Hygiene
理 事 長 :白井淳資 副理事長 :宮﨑 茂 編集委員長 :宮﨑 茂
編集委員 :柿市徳英・末吉益雄・髙井伸二
長井 誠・野上貞雄・福士秀人
「家畜衛生学雑誌」第42巻第 4 号の送付にあたって
会員の皆様におかれましては,ますますご清栄のこととお慶び申し上げます.
ここに,「家畜衛生学雑誌」第42巻第 4 号を刊行する運びとなりました.本号には,原著論文 3 編の他,第42巻の 総目次も掲載しています.
今冬は,野鳥や家禽での高病原性鳥インフルエンザが多発しており,防疫担当各位はご多忙な日々を過ごされてい ると思います.農場へのウイルス侵入を防ぐためには効果的な衛生管理の徹底が必要であり,これに対する学術的な 裏付け提供に,日本家畜衛生学会および家畜衛生学雑誌が貢献できればと思います.
毎回お願いしていることですが,「家畜衛生学雑誌」への積極的なご投稿をよろしくお願い致します.「家畜衛生学 雑誌」は効率の良い審査を行い,出来るだけ迅速な掲載を目指しております.「家畜衛生学雑誌」の更なる充実のた め,学会役員一同,努力や工夫をしていきたいと思いますが,何よりも会員の皆様のご支援が重要ですので,よろし くお願い致します.
日本家畜衛生学会理事長 白井淳資 家畜衛生学雑誌編集委員長 宮﨑 茂
(日本家畜衛生学会副理事長)
日本家畜衛生学会・学会費納入のお願い
ご承知のように,学会は会員の皆様からの会費をもって運営されています.学会の運営を円滑に運ぶために,所定 の会費を納入していただきますようお願いします.
*会費は,正会員5,000円,学生会員2,000円です.
*平成27年度までの未納分をお支払いいただく場合,正会員年会費は4,000円です.
日本家畜衛生学会 理事長 白井淳資
00
口座記号 口座番号(右詰めで記入) 金額料金 特殊
取扱
千 百 十 万 千 百 十 円
※
※
※
※
加入者名通信欄ご依頼人 受付局日附印
※
※
(電話番号 − − ) おところ(郵便番号 − )
※ おなまえ
払 込 取 扱 票
口座記号番号加入者名金額料金特殊取扱ご依頼人
※
受 付 局 日 附 印
※
※
※
※
※
円
千 百 十 万 千 百 十 円
おなまえ
郵便振替払込請求書兼受領証
記載事項を訂正した場合は︑その箇所に訂正印を押してください︒切り取らないで郵便局にお出しください︒
各票の※印欄は︑ご依頼人において記載してください︒
裏面の注意事項をお読みください。
これより下部には何も記入しないでください。
(消費税込み)
様
様
日本家畜衛生学会
0 0 2 4 0
4 3 1 7 1 3 0 0 2 4 0 3 4 3 1 7 1
日本家畜衛生学会
平成 24 25 26 27 28 年度
( ) 計 円
(ご注意)
・この用紙は、機械で処理します ので、口座番号及び金額を記入す る際は、枠内にはっきりと記入し てください。
また、本票を汚したり、折り曲 げたりしないでください。
・この払込請求書を郵便局の派遣 員にお預けになるときは、引換え に預り証を必ずお受け取りください。
この受領証は、郵便振替の払込 みの証拠となるものですから大切
に保存してください。 この払込取扱票の裏面には、何も記載しないでください。
家畜衛生学雑誌
第42巻 第 4 号 2 0 1 7
目 次
〈原著〉ヨーネ病が牛飼養農場に与える損失の評価
・・・・・・・・・・・・・・・・・・・・・・・・・・・・・・・・・・・・・・・・・・・・・・・・・・・・・・・・・・・・・・・・・・・・・・・・・・・榊原伸一・菅野 宏・立花 智 ・・・・・・・・・・・・・・・・・・・・・・ 173〜180 Assessment of risk for acetylated derivatives of deoxynivalenol in pigs
・・・・・・・・・・・・・・・・・・・・・・・・・・・・・・・・・・・ Yosuke Uchiyama, Kaori Toya, Seigo Ito, Tomoyuki Kadota,
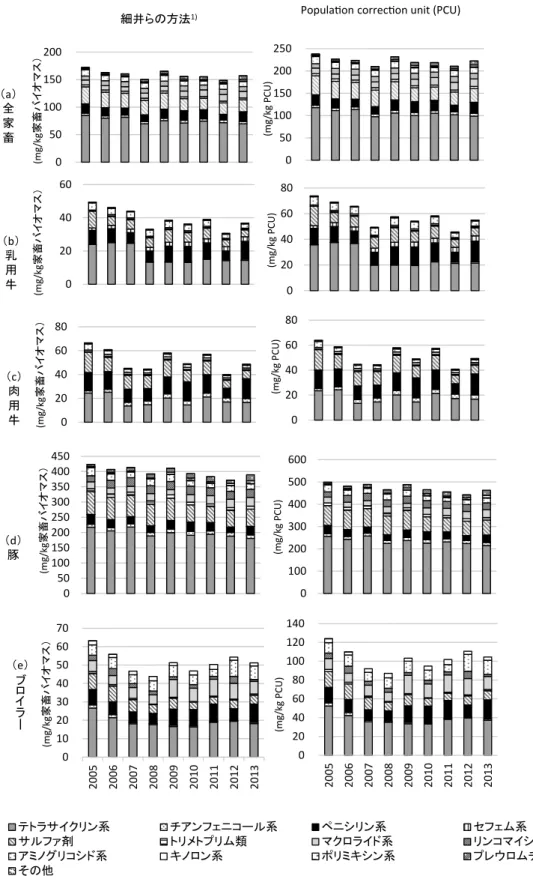
Arisa Iwanuma, Yoshiko Sugita-Konishi ・・・・・・・・・・・・・・・・・・・・・・ 181〜189 日本における家畜バイオマス重量あたりの抗菌剤使用量の評価
─細井らの方法とEUの方法による評価結果の比較─
・・・・・・・・・・・・・・・・・・・・・・・・・・・・・・・・・・松田真理・Nigel C. L. Kwan・川西路子・小池良治・杉浦勝明 ・・・・・・・・・・・・・・・・・・・・・・ 191〜197
第42巻総目次 ・・・・・・・・・・・・・・・・・・・・・・・・・・・・・・・・・・・・・・・・・・・・・・・・・・・・・・・・・・・・・・・・・・・・・・・・・・・・・・・・・・・・・・・・・・・・・・・・・・・・・・・・・・・・・・・・・・・・・・・・・・・・・・・・ 199〜203 会員へのおしらせ ・・・・・・・・・・・・・・・・・・・・・・・・・・・・・・・・・・・・・・・・・・・・・・・・・・・・・・・・・・・・・・・・・・・・・・・・・・・・・・・・・・・・・・・・・・・・・・・・・・・・・・・・・・・・・・・・・・・・・・・・・ 204〜205 家畜衛生学雑誌投稿規程 ・・・・・・・・・・・・・・・・・・・・・・・・・・・・・・・・・・・・・・・・・・・・・・・・・・・・・・・・・・・・・・・・・・・・・・・・・・・・・・・・・・・・・・・・・・・・・・・・・・・・・・・・・・・・・・・・ 206〜207 日本家畜衛生学会会則 ・・・・・・・・・・・・・・・・・・・・・・・・・・・・・・・・・・・・・・・・・・・・・・・・・・・・・・・・・・・・・・・・・・・・・・・・・・・・・・・・・・・・・・・・・・・・・・・・・・・・・・・・・・・・・・・・・・・ 208〜209
家 畜 衛 生 学 雑 誌
The Japanese Journal of Animal Hygiene Vol. 42 No. 4 2 0 1 7
Contents
〈Original report〉
Evaluation of the production losses in daily and beef herd with paratuberculosis infection.
・・・・・・・・・・・・・・・・・・・・・・・・・・・・・・・・・・・・・・・・・・・・・・・・・・・・・・・・・・・・・・・Shinichi Sakakibara et al. ・・・・・・・・・・・・・・・・・・・・・・・・・・・・・・・・・・・・・・・・・・ 173〜180 Assessment of risk for acetylated derivatives of deoxynivalenol in pigs.
・・・・・・・・・・・・・・・・・・・・・・・・・・・・・・・・・・・・・・・・・・・・・・・・・・・・・・・・・・・・・・・・・Yosuke Uchiyama et al. ・・・・・・・・・・・・・・・・・・・・・・・・・・・・・・・・・・・・・・・・・・ 181〜189 The evaluation of veterinary antimicrobial use in the food-producing animals in Japan.
・・・・・・・・・・・・・・・・・・・・・・・・・・・・・・・・・・・・・・・・・・・・・・・・・・・・・・・・・・・・・・・・・・・・・・Mari Matsuda et al. ・・・・・・・・・・・・・・・・・・・・・・・・・・・・・・・・・・・・・・・・・・ 191〜197
Contents of volume 42 ・・・・・・・・・・・・・・・・・・・・・・・・・・・・・・・・・・・・・・・・・・・・・・・・・・・・・・・・・・・・・・・・・・・・・・・・・・・・・・・・・・・・・・・・・・・・・・・・・・・・・・・・・・・・・・・・・・・・・ 199〜203 Information for Members ・・・・・・・・・・・・・・・・・・・・・・・・・・・・・・・・・・・・・・・・・・・・・・・・・・・・・・・・・・・・・・・・・・・・・・・・・・・・・・・・・・・・・・・・・・・・・・・・・・・・・・・・・・・・・・・・・・ 204〜205 Instruction for Authors ・・・・・・・・・・・・・・・・・・・・・・・・・・・・・・・・・・・・・・・・・・・・・・・・・・・・・・・・・・・・・・・・・・・・・・・・・・・・・・・・・・・・・・・・・・・・・・・・・・・・・・・・・・・・・・・・・・・・・ 206〜207 The Regulations of The Japanese Society of Animal Hygiene ・・・・・・・・・・・・・・・・・・・・・・・・・・・・・・・・・・・・・・・・・・・・・・・・・・・・・・・・・・・・・・・・・・ 208〜209
Jpn. J. Anim. Hyg.
173
序 文
ヨーネ病(JD)は Mycobacterium avium subspecies paratuberculosis(ヨーネ菌)を原因菌とする慢性腸管
感染症であり,牛飼養農場に大きな生産性の低下をもた
らす6 , 8 ).発症牛は持続的な下痢症に加え,腸管での栄
養吸収不全を要因とする重度の削痩等の症状を示し,多 くが発症後数か月から 1 年余で死亡する8 ).ヨーネ菌感 染から発症に至るまでは数年を要し7 ,14),この非臨床期 にも病態の進行に伴い乳量等の生産性は低下する7 ,14). 罹患牛の糞便中には多量のヨーネ菌が排泄され,排菌量 は病態ステージの目安となる7 ,14).汚染された環境から
ヨーネ病が牛飼養農場に与える損失の評価
榊原伸一*・菅野 宏・立花 智
Evaluation of the production losses in daily and beef herd with paratuberculosis infection
Shinichi Sakakibara*, Hiroshi Kanno, Satoshi Tachibana
(Hokkaido Tokachi Livestock Hygiene Service Center (59-6, Kisen, Kawanishi, Obihiro, Hokkaido 089-1182, Japan
*Corresponding Author : Shinichi Sakakibara([email protected]))
(2016. 4. 8 受付/2016. 11. 1 受理)
Summary
We evaluated the production losses of paratuberculosis (PTB)-infected cattle based on the shedding level of Mycobacterium avium subspecies paratuberculosis (MAP) DNA in their feces, detected using real-time polymerase chain reaction. Each of 219 Holstein Friesian (HF) and 116 Japanese black (JB) cattle were categorized into one of three groups: high-shedders ( ≥1.0 pg/well), low-shedders (<1.0 pg/well), and negatives. Then, the associations between the shedding level of MAP and production parameters including body weight, annual calving number, milk yield, and somatic cell count were statistically evaluated using generalized linear mixed models. The results showed that the HF high-shedders yielded 13% less milk compared to the negatives (P=0.004). In the JB cattle, the annual calving numbers and body weights of high-shedders were 22% and 19% less than those of the negatives, respectively (P = 0.003, 0.032). The JB low-shedders showed a 7.2% lower body weight than the negatives (P=0.036). We also predicted the prevalence of MAP in the HF and JB herds using the Collins-Morgan model, assuming a condition in which there was no test and cull measure against PTB. The simulated results indicated that the prevalence of high- and low-shedders in the HF herd increased to 12% and 69%, and those in the JB herd increased to 17% and 67%, respectively. Combining the results above, it was finally estimated that the losses in the milk yield in the HF herd and in the annual calving number and body weight in the JB herd were 1.6%, 3.8% and 8.0% compared to the PTB-negative herd, respectively.
Key words: paratuberculosis, production loss, real-time polymerase chain reaction, Collins-Morgan model
家畜衛生学雑誌 42,173〜180(2017)
原 著
北海道十勝家畜保健衛生所
〒089−1182 帯広市川西町基線59番地 6
*連絡著者:榊原伸一([email protected])
174 家畜衛生学雑誌 第42巻第 4 号(2017)
の経口感染が本菌の主な感染経路とされ18), 6 か月齢未 満の子牛で感受性が高いとされる8 ).
日本国内では,JD は撲滅対象疾病に指定されてお り,特に1998年以降は家畜伝染病予防法により牛では少 なくとも 5 年ごとの検査(定期検査)が義務づけられ,
ヨーネ菌感染が確認された農場は罹患牛の最終摘発・淘 汰後の 3 年間に 5 回の全頭検査(同居牛検査)が実施さ れている.以前は血清の ELISA 検査3 )と糞便の培養検 査3 )によりサーベイランスが実施されていたが,2013 年以降は特異度および感度の高い糞便のリアルタイム PCR 検査(rPCR)1 , 4 ,15)を加えて実施されている.日 本の JD 陽性率は低いとされるが,2014年現在でも年間 784頭の罹患牛が摘発されており,撲滅までには未だ長 い時間と労力がかかると予想される20).また,摘発・淘 汰による防疫は効果が大きい7 ,13,14)一方で,サーベイ ランスに伴う牛の淘汰による生産計画のずれと新たな牛 の補充等のため生産者にも大きな負担となる.今後,本 病の防疫対策をより効果的に推進するためには,現行の 対策の効果を検証し,必要に応じて改善していくことが 重要と考えられる.しかしながら,国内では農場の生産 性への影響という観点から本病の対策の効果の検討がな された例が非常に少ない.特に日本固有種である黒毛和 種牛(黒毛)の生産性に JD が与える影響については世 界的にも報告がない.そこで今回,国内の飼養環境にお いて JD が牛飼養農場の生産性に与える影響を評価する ため,rPCRにより定量された罹患牛の排菌量と生産性 を比較検討した.さらに,今後 JD の防疫対策の効果を 評価するための基礎情報を得ることを目的に,浸潤農場 における対策未実施での有病率の推移とそれに伴う生産 性への影響について,シミュレーションモデルを用いて 推定した.
材料および方法 1 .罹患牛の排菌量と生産性の比較
( 1 )対象集団とグループ分け
2013年に定期検査および同居牛検査を受検したホルス タイン種牛(ホル)28戸219頭および黒毛19戸116頭の rPCR成績を用いた.
rPCR により定量されたヨーネ菌 DNA 量に基づき,
検出限界未満,1.0pg/well(Threshold Cycle(Ct)値 24.0)未満および以上の牛の病態ステージをそれぞれ陰 性牛,低度排菌牛および高度排菌牛とした.ホルでは陰 性牛,低度および高度排菌牛それぞれ107,89,および 23頭,黒毛は陰性牛,低度および高度排菌牛それぞれ 83,30,および 3 頭に分けられた.
( 2 )検査法の概要
農場で各牛の直腸から採取した糞便を材料とし,糞便 検体からのDNA抽出およびrPCRにはヨーネ菌DNA抽 出キット(ヨーネスピンver.2,株式会社ファスマック)
および糞便中ヨーネ菌 DNA 検出キット(ヨーネジー ン・KS,共立製薬株式会社)を用いた.なお,本法は家 畜伝染病予防法施行規則別表第一に従って実施された.
( 3 )統計解析
各牛について,生産性指標として直近の305日乳量
(乳量),体細胞数リニアスコア(LS),年間分娩回数
(分娩間隔の逆数),分娩後日数,年齢および体重を調査 した.乳量およびLSは牛群検定成績10)を用い,ホルに ついてのみ調査した.年間分娩回数と分娩後日数は繁殖 台帳,年齢は牛の個体識別情報検索サービス12)により 調査した.体重は体重推定尺(富士平工業株式会社)を 用いて測定した.
続いて,一般化線形混合効果モデルにより,陰性牛に 対する低度および高度排菌牛の生産性の差異を求めた.
分析は統計ソフト「R」24)のlme4パッケージを用いた.
品種ごとに乳量,LS,年間分娩回数および体重を目的 変数,糞便中ヨーネ菌 DNA 量に基づき分類されたグ ループ,分娩後日数および年齢を説明変数とし,各牛が 在 籍 す る 農 場 の 農 場 間 差 を ラ ン ダ ム 効 果 と し た.
Kolmogorov-Smirnov 検定で正規分布と判断された乳 量,年間分娩回数および体重は正規分布,非負整数を値 にとる LS はポアソン分布に従うと仮定して解析した.
モデル選択には尤度比検定を用い,病態ステージ以外で 有意でなかった変数(P>0.05)はモデルから除外した.
次いで,一般化線形混合効果モデルにより算出された切 片の値に対する低度および高度排菌牛の係数の値を,年 齢,分娩後日数および農場間差を調整した各生産性指標 における陰性牛に対する低度および高度排菌牛の差異と して,割合の形で算出した.
2 .シミュレーションに基づく損失の評価
決 定 論 的 JD 浸 潤 シ ミ ュ レ ー シ ョ ン モ デ ル で あ る Collins-Morgan モデル2 ,13)を用い,対策未実施での農 場内の有病率の推移を推定した.
( 1 )Collins-Morganモデルの構造
本モデルは JD の疫学的特徴を反映し,牛群の現在の 有病率から次年以降の有病率を推定する.子牛は罹患牛 である成牛と接触することで感染する.感染確率は Reed-Frost モデルに基づき,現在の有病率および年間 有効接触回数から決定される.また,成牛群の更新が考 慮されている.すなわち,罹患牛を含む成牛は一定確率 で淘汰され,罹患牛を含む子牛が 2 年の育成期間後に新
榊原ら:ヨーネ病が牛飼養農場に与える損失の評価 175
たな成牛として補充されることで有病率が推移する.な お,罹患牛は淘汰率が陰性牛よりも割り増して設定され る2 ,13).
( 2 )パラメータの設定
2003年以降の定期検査でJDの浸潤が確認され,初摘発 牛の排菌量が判明しており,複数の罹患牛が摘発され,
罹患牛が摘発されなくなるまで同居牛検査が実施された ホル農場および黒毛飼養農場それぞれ 6 戸における摘発 状況から,モデルに投入するパラメータを整理した.
パラメータの値は以下の方法で設定し,更新牛中自家 育成占有比,外部導入牛罹患率および淘汰率割増係数を 除く各パラメータはホルおよび黒毛についてそれぞれ選 定された 6 戸の平均値を用いた(表 1 ).成牛群の規模 は,24か月齢以上の牛を成牛とし,罹患牛の初摘発時点 における飼養頭数を各農場の飼養牛名簿から得た.成牛 の年間更新率は,罹患牛の初摘発時点に在籍した成牛 と,そのうち 1 年後に除籍された成牛を調査し,除籍頭 数を成牛群の規模で除したものとした.年間子牛出生率 は,罹患牛の初摘発時点から 1 年間に出生した子牛頭数 を飼養牛名簿から調査し,成牛群の規模で除したものと した.初年次の罹患牛頭数は,摘発された罹患牛の罹患 時期を出生年と仮定し,最初の罹患牛が罹患した年の罹 患牛頭数とした.成牛と子牛の年間有効接触回数は,他 のパラメータの値を全て設定したモデルにより推定した 年ごとの新規罹患牛頭数が,実際の頭数に最もあてはま る値を最尤推定した.なお,最尤推定は新規罹患牛頭数 がポアソン分布に従うと仮定して実施した.更新牛中自
家育成占有比は,成牛について飼養牛名簿から牛の個体 識別情報検索サービス12)を用いて産地を調査し,成牛 に占める自家産牛の割合とした.ただし,外部導入牛罹 患率について情報が得られず,調査で得られた更新牛中 自家育成占有比がホルおよび黒毛でそれぞれ95%および 94%と高いものであったことから,今回の調査では牛の 導入がないものと仮定した.淘汰率割増係数は,過去に 報告されたホルにおける陰性牛に対する罹患牛の淘汰ハ ザード比25),すなわち陰性牛に対する罹患牛の淘汰され やすさとなる指標を用いた.黒毛については報告が得ら れなかったためホルと同値とした.罹患牛中の高度排菌 牛の割合は,糞便の培養検査結果から調査した.培養検 査はヨーネ菌培養用培地(ヨーネ菌用培地「共立」,共 立製薬株式会社)を用いてマニュアルに従って行い,糞 便中ヨーネ菌コロニー数(cfu/tube)を計数した.Ct値 と分離菌数の関係を示す回帰式15)を用いて,Ct値24.0超 過 お よ び 以 下 に あ た る 糞 便 中 ヨ ー ネ 菌 コ ロ ニ ー 数 320cfu/tube 未満および以上の罹患牛を,それぞれ低度 および高度排菌牛とした.
( 3 )シミュレーションの実施
シミュレーションは,期間を50年間として表計算ソフ ト(Microsoft Excel 2010,日本マイクロソフト)によ り演算した.初年次に在籍した罹患牛から JD が農場内 に浸潤していき,有病率が定常化するまでの年数,およ び定常化した年の有病率を算出した.高度排菌牛の有病 率は,罹患牛の有病率に罹患牛に占める高度排菌牛の割 合を乗じて算出した.低度排菌牛の有病率は,罹患牛の 有病率から高度排菌牛の有病率を差し引いて算出した.
さらに,これらの定常化した低度および高度排菌牛の 有病率に基づき,一般化線形混合モデルで求めた個体レ ベルの生産性指標の差を,農場レベルの生産性への影響 へ換算した.
結 果
各生産性指標と糞便中ヨーネ菌DNA量に基づく牛個 体の病態ステージとの関係を評価した一般化線形混合モ デルによる解析の結果を表 2 および 3 に示した.すなわ ちホルでは,乳量が陰性牛に対して高度排菌牛で有意に 低かったが(P =0.004),低度排菌牛との間に有意差は 認められなかった(P=0.199).LSについては,陰性牛 と低度および高度排菌牛との間に有意差は認められな かった(P =0.997および0.933).年間分娩回数について は,陰性牛と低度および高度排菌牛との間に有意差は認 められなかった(P =0.339および0.784).体重について は,陰性牛と低度および高度排菌牛との間に有意差は認 められなかった(P =0.411および0.471;表 2 ).また,
表 1 . Collins-Morganモデルによるヨーネ病浸潤シミュ レーションに用いたパラメータの値
パラメータ 品種
ホル 黒毛
成牛群の規模 73 40
成牛の年間更新率 0.24 0.10
年間子牛出生率 0.87 0.89
初年次の罹患牛頭数 1.5 1.3
成牛と幼牛の年間有効接触回数 4.2 7.0
更新牛中自家育成占有比 1 1
外部導入牛罹患率 0 0
淘汰率割増係数 1.4 1.4
罹患牛に占める高度排菌牛の割合 0.15 0.21 ホル:ホルスタイン種,黒毛:黒毛和種.
176 家畜衛生学雑誌 第42巻第 4 号(2017)
黒毛では年間分娩回数について陰性牛に対して高度排菌 牛で有意に低かった(P=0.003)が,低度排菌牛との間 に有意差は認められなかった(P =0.988).体重に関し て陰性牛に対して低度および高度排菌牛はそれぞれ有意 に低かった(P=0.036および0.032;表 3 ).
表 4 に品種別の各生産性指標について,年齢,分娩後 日数および農場間差を一般化線形混合モデルで調整した 平均値を示した.加えて,陰性牛に対する低度および高 度排菌牛の差異を割合で示すととともに,一般化線形混 合モデルで求めた差異の有意性を示した.すなわちホル について,乳量は陰性牛に対して高度排菌牛で有意に低 く,その差は−13.3%であったが,低度排菌牛との有意 差は認められなかった.LS,年間分娩回数および体重 について病態ステージ間でいずれも有意差は認められな かった.また,黒毛について,年間分娩回数は陰性牛に 対して高度排菌牛で有意に低く,その差は−22.1%で あったが,低度排菌牛との有意差は認められなかった.
体重の陰性牛に対する低度および高度排菌牛の差はそれ ぞれ−7.2%および−19.1%で有意に低かった.
シミュレーションの結果,JD に対する摘発・淘汰に よる防疫対策が未実施の場合,ホル飼養農場では農場へ のヨーネ菌侵入後12年で有病率は50%を超え,21年で 81%に定常化すると推定された.そのうち,低度および 高度排菌牛の有病率はそれぞれ69%および12%であった
(図 1 ,表 5 ).次いで,JD 非浸潤農場に対する有病率 が定常化した浸潤農場の生産性の差異を,各生産性指標 表 2 .ホルスタイン種牛における糞便中ヨーネ菌DNA
量と各生産性指標についての一般化線形混合モデ ルの概要
目的変数 説明変数 係数 標準誤差 P値
乳量
(kg/305日)
切片 10795 212 <0.001 低度排菌牛a −402 312 0.199 高度排菌牛b −1431 498 0.004
LS
切片 0.714 0.173 <0.001 低度排菌牛 0.030 0.146 0.997 高度排菌牛 0.032 0.182 0.933
年間分娩回数
(回/年)
切片 0.896 0.025 <0.001 低度排菌牛 −0.028 0.029 0.339 高度排菌牛 0.011 0.039 0.784
体重
(kg)
切片 763 18 <0.001
低度排菌牛 10 20 0.411
高度排菌牛 −22 27 0.471
a・b:それぞれ糞便中ヨーネ菌 DNA1.0 pg/well 未満及び1.0 pg/well 以 上の牛,LS:体細胞リニアスコア,一般化混合効果モデルにより年齢,
分娩後日数および農場間差を調整済み.
表 4 .糞便中ヨーネ菌DNA量と各生産性指標の比較 生産性
指標
病態 ステージ
品種
ホル 黒毛
乳量
(kg/305日)
陰性牛a 10795
低度排菌牛b 10393(−3.7%)
高度排菌牛c 9364(−13.3%)*
LS
陰性牛 2.04
低度排菌牛 2.10(+3.1%)
高度排菌牛 2.11(+3.3%)
年間分娩 回数
(回/年)
陰性牛 0.90 0.91
低度排菌牛 0.87(−3.1%) 0.91(−0.3%)
高度排菌牛 0.91(+1.2%) 0.71(−22.1%)*
体重
(kg)
陰性牛 763 628
低度排菌牛 773(+1.3%) 583(−7.2%)* 高度排菌牛 741(−2.9%) 508(−19.1%)* 一般化混合効果モデルにより年齢,分娩後日数および農場間差を調整し た平均値を表示,括弧内:各群の陰性牛群との差の割合,ホル:ホルス タイン種,黒毛:黒毛和種,a・b・c:それぞれ糞便中ヨーネ菌DNA非 検出,1.0 pg/well未満及び1.0 pg/well以上の牛,LS:体細胞リニアスコ ア,*:陰性牛群との間に有意差あり(P<0.05).
表 3 .黒毛和種牛における糞便中ヨーネ菌DNA量と各 生産性指標についての一般化線形混合モデルの概 要
目的変数 説明変数 係数 標準誤差 P値
年間分娩回数
(回/年)
切片 0.911 0.034 <0.001 低度排菌牛a −0.003 0.025 0.988 高度排菌牛b −0.201 0.067 0.003
体重
(kg)
切片 628 18 <0.001
低度排菌牛 −45 21 0.036
高度排菌牛 −120 55 0.032 a・b:それぞれ糞便中ヨーネ菌 DNA1.0 pg/well 未満及び1.0 pg/well 以 上の牛,一般化混合効果モデルにより年齢,分娩後日数および農場間差 を調整済み.
榊原ら:ヨーネ病が牛飼養農場に与える損失の評価 177
考 察
今回の調査では,JD の病態ステージ別に陰性牛と罹 患牛の生産性を比較し,次いで JD 対策未実施下での農 場内の有病率の変化をシミュレーションモデルにより推 定した.その結果,個体レベルおよび農場レベルでの JDによる生産性の損失が明らかとなった.
ホルでは高度排菌牛でのみ乳量が陰性牛に比べ有意に 少なく,JD による乳量低下率は病態ステージにより大 きく異なることが確認された.非臨床期の罹患牛の乳量 の低下は2.2〜25%と大きな幅があると報告されている が21),これは調査された牛群ごとの病態ステージのばら つきによると考えられた.今回の調査では排菌量に基づ く病態ステージの区分により明瞭な結果が得られたと考 えられた.
体重について,ホルでは陰性牛と排菌牛との間で有意 差は見られなかった.過去には罹患牛の枝肉重量の低下 が報告されているが8 ,11),これらの調査は淘汰牛のみを 対象に実施されたもので,農場で実施した今回の調査と は条件が異なる.農場では体重が低下した牛が選択的に 淘汰されたことで観察されにくく,過去の報告のような 差が現れなかったことが考えられた.LS と年間分娩回 数についても陰性牛と排菌牛の間で有意差は見られな と有病率を掛け合わせて算出した.JD 非浸潤農場に対
して有病率定常化農場では,乳量は低度および高度排菌 牛共に低かったが,低度排菌牛では個体レベルで有意差 がなかったことから,有意差のあった高度排菌牛のみを 考慮し少なくとも1.6%低いと推定された.有病率定常 化農場の LS は JD 非浸潤農場に比べ高い傾向であった が,有意な差はないと推定された.年間分娩回数および 体重についても,有意な差はないと推定された(表 6 ).同様に黒毛飼養農場では,13年で有病率は50%を 超えて33年で84%に定常化すると推定された.そのう ち,低度および高度排菌牛の有病率はそれぞれ67%およ び17%であった(図 1 ,表 5 ).JD非浸潤農場に対する 有病率定常化農場の生産性については,年間分娩回数お よび体重がそれぞれ少なくとも有意に3.8%および8.0%
(4.8%+3.2%)低いと推定された(表 6 ).
0.0 0.2 0.4 0.6 0.8 1.0
0 5 10 15 20 25 30
ホル罹患牛 黒毛罹患牛 ホル高度排菌牛 黒毛高度排菌牛
有病率
経過年数(年)
図 1 .Collins-Morganモデルにより予測されたヨーネ病 有病率の推移
ホル:ホルスタイン種,黒毛:黒毛和種.
表 5 .Collins-Morganモデルによるヨーネ病浸潤シミュ レーションの結果
品種
ホル 黒毛
有病率が定常化した年 21 31
定常化した罹患牛の有病率 0.81 0.84
定常化した低度排菌牛の有病率 0.69 0.67
定常化した高度排菌牛の有病率 0.12 0.17
ホル:ホルスタイン種,黒毛:黒毛和種.
表 6 .ヨーネ病非浸潤農場に対する,ヨーネ病有病率が 定常化した農場の生産性
生産性指標 病態ステージ 品種
ホル 黒毛
乳量 低度排菌牛 −2.6%
高度排菌牛 −1.6%*
LS 低度排菌牛 2.1%
高度排菌牛 0.4%
年間分娩回数 低度排菌牛 −2.1% −0.2%
高度排菌牛 0.1% −3.8%*
体重 低度排菌牛 0.9% −4.8%*
高度排菌牛 −0.3% −3.2%* ホル:ホルスタイン種,黒毛:黒毛和種,a・b:それぞれ糞便中ヨーネ 菌DNA1.0 pg/well未満及び1.0 pg/well以上の牛,LS:体細胞リニア スコア,*:陰性牛群との間に有意差あり(P<0.05).
178 家畜衛生学雑誌 第42巻第 4 号(2017)
かった.過去の報告ではLSおよび繁殖成績にJDが与え る影響は報告ごとに一定していない6 , 8 , 9 ).牛群ごと の病態ステージのばらつきに加え,農場では生産性の低 下した罹患牛が観察されにくいことで調査結果が一定し ない可能性が考えられた.JD 浸潤農場は非浸潤農場に 比べて牛の淘汰率が上昇すると報告されている8 ,11).淘 汰された牛についても調査することで,より明瞭な JD による損失が明らかになると考えられた.
一方,黒毛では高度排菌牛で年間分娩回数と体重が少 なく,低度排菌牛でも体重が低かった.黒毛でのみ有意 差が見られた理由として,ホルに対して低い更新率と更 新理由の違いが考えられた.黒毛の商品価値を左右する 肉質は遺伝的要因により決定されるため22),十勝地区肉牛 市場においては血統により牛の価格は 2 倍近く異なる26). 高い肉質を有する産子の生産が期待される血統の黒毛で あれば,生産性が低下しても飼養が継続される確率がホ ルより高く,農場における調査で生産性の低下した牛が 観察されやすかった可能性が考えられた.
JD 対策未実施の状況では,両品種共にほぼ全ての牛 が罹患牛となると推定された.この状況下で JD により ホル飼養農場では乳量,黒毛飼養農場では年間分娩回数 および体重が低下すると推定され,JD による損失は無 視できるものではないことが再確認された.加えて,今 回調査した生産性指標以外にも,発症牛の死亡・淘汰に よる損失,飼料効率の悪化および検査に係る費用が生産 性を低下させると報告されている6 − 9 ,11,14,25).さらな る調査により損失の全貌を確認する必要があると考えら れた.
シミュレーションの結果より,JD 浸潤が定常化した 際,ホルに対して黒毛は高度排菌牛の割合が高くなると 推定された.これは年間有効接触回数が黒毛のほうが多 かったことが影響していると考えられた.すなわち,
ヨーネ菌は摂取された量が多いほど牛の腸管に定着しや すく,JD の病態進行決定の最重要因子は摂取菌量とさ
れる18,19).黒毛はホルに比べて親子同居期間が長いため
子牛がヨーネ菌を摂取しやすい環境にあったため,病態 の進行した牛の割合が高くなったと推察された.一方,
有病率の上昇は黒毛よりホルの方が速かった.更新率が 高いと,罹患牛が牛群に加えられる機会が増加すること で急速に浸潤が進むと報告されており2 ,13),今回更新率 の高いホルにおいて損失がより早期に顕在化したものと 思われた.また,定常化時の有病率が100%に達しな かったが,これは今回,陰性牛に対する罹患牛の淘汰ハ ザード比25)を高く設定した影響と考えられた.また,
JD感受性は遺伝的に異なると報告されており23),国内飼 養牛でも抵抗性の系統が存在する可能性が考えられた.
Collins-Morgan モデルは JD の基本的な疫学的特徴を 再現した,取り扱いが簡便で柔軟なモデルである.一 方,胎内感染といった直接接触以外の感染ルートが想定 されていないこと等について現実との乖離があると指摘 されている7 ).また,本モデルは決定論的モデルである が,母集団が数十から数百頭の小集団である場合でのシ ミュレーションには,統計的揺らぎが再現される確率論 的モデルが適するとされる17).ただ,近年報告されてい る確率論的モデルによるシミュレーションにおいても,
本報告と同様に,対策未実施では農場内の有病率は 9 割 前後に達するとしていることから14,18),今回のシミュ レーション結果は一定の妥当性があるものと考えられ た.一方,今回の調査では罹患時期を出生年と仮定した こと5 ),群内の低度排菌牛と高度排菌牛の比率が一定で あると仮定したこと16),牛の導入がないものと仮定した ことが現実を反映せず,結果に影響を与えている可能性 があると考えられた.今後は,これらの要素に加えて飼 養管理面のリスク要因についても演算可能で,より多様 な農場の飼養形態に即した検討ができる確率論的モデル によって検証を進めていく必要がある.
今回の調査で国内の飼養環境において JD が牛飼養農 場の生産性に与える損失が明らかとなった.特に黒毛に 関する知見はこれまでなく,今回得られた結果は今後の ヨーネ病防疫対策推進において家畜衛生関係者へ有益な 情報になると考えられた.
引 用 文 献
1 ) Alinovi, C.A., Ward, M.P., Lin, T.L., (2009) Real-time PCR, compared to liquid and solid culture media and ELISA, for the detection of Mycobacterium avium ssp. paratuberculosis. Vet Microbiol. 136, 177-179.
2 ) C o l l i n s , M . T . , a n d M o r g a n , I . R . ( 1 9 9 1 ) Epidemiological model of paratuberculosis in dairy cattle. Prev Vet Med. 11, 131-146.
3 ) Collins, M.T. (2011) Diagnosis of paratuberculosis.
Vet Clin North Am Food Anim Pract. 27, 581-591 4 ) Elguezabal, N., Bastida, F., Sevilla, I.A., et al. (2011)
Estimation of Mycobacterium avium subsp.
paratuberculosis Growth Parameters. Strain Characterization and Comparison of Methods.
Appl Environ Microbiol. 77, 8615–8624
5 ) Espejo, L.A., Kubat, N., Godden, S.M., et al. (2013) E f f e c t o f d e l a y e d e x p o s u r e o f c a t t l e t o Mycobacterium avium subsp paratuberculosis on the development of subclinical and clinical Johne’s
榊原ら:ヨーネ病が牛飼養農場に与える損失の評価 179
paratuberculosis in a dairy cattle herd for management and control purposes: a modelling study. Vet Res. 42:36. doi: 10.1186/1297-9716-42-36 19) Mortier, R.A., Barkema, H.W., Bystrom, J.M., et al.
(2013) Evaluation of age-dependent susceptibility i n c a l v e s i n f e c t e d w i t h t w o d o s e s o f Mycobacterium avium subspecies paratuberculosis using pathology and tissue culture. Vet Res. doi:
10.1186/1297-9716-44-94.
20) 永田礼子(2016)ヨーネ病,日本獣医師会雑誌,
69,66−68
21) Nordlund, K.V., Goodger, W.J., Pelletier, J., et al.
(1996) Associations between subclinical paratuberculosis and milk production, milk components, and somatic cell counts in dairy herds. J Am Vet Med Assoc. 208, 1872-1876.
22) Ogawa, S., Matsuda, H., Taniguchi, Y., et al. (2014) Effects of single nucleotide polymorphism marker density on degree of genetic variance explained and genomic evaluation for carcass traits in Japanese Black beef cattle. BMC Genet. 15, doi:
10.1186/1471-2156-15-15
23) Pauciullo, A., Küpper, J., Brandt, H., et al. (2015) Wingless-type MMTV integration site family member 2 (WNT2) gene is associated with resistance to MAP in faecal culture and antibody response in Holstein cattle. Anim Genet. 46, 122- 132
24) R Core Team. (2014) R: A language and environment for statistical computing. R Foundation for Statistical Computing, Vienna, Austria. URL http://www.R-project.org/.
25) Tiwari, A., VanLeeuwen, J.A., Dohoo, I.R., et al.
(2005) Effects of seropositivity for bovine leukemia virus, bovine viral diarrhoea virus, Mycobacterium avium subspecies paratuberculosis, and Neospora caninum on culling in dairy cattle in four Canadian provinces. Vet Microbiol. 109, 147-158.
26) 十勝農業協同組合連合会酪農畜産課(2015)肉牛市 場に係る分析データ
要 旨
ヨーネ病が牛飼養農場の生産性に与える損失をリアル タイム PCR 検査の結果に基づき調査した.糞便中ヨー ネ菌 DNA 量が検出限界未満,1.0pg/well 未満および以 上の牛をそれぞれ陰性牛,低度および高度排菌牛とし disease. Am J Vet Res. 74, 1304-1310
6 ) Garcia, A.B., and Shalloo, L. (2015) Invited review:
T h e e c o n o m i c i m p a c t a n d c o n t r o l o f paratuberculosis in cattle. J Dairy Sci. 98, 5019- 5039.
7 ) Groenendaal, H., Nielen, M., Jalvingh, A.W., et al.
(2002) A simulation of Johne’s disease control. Prev Vet Med. 54, 225-45.
8 ) Hasonova, L., Pavlic, I. (2006) Economic impact of paratuberculosis in dairy cattle herds: A review.
Veterinarni Medicina. 51, 193-211.
9 ) Hendrick, S.H., Kelton, D.F., Leslie, K.E., et al. (2005) Effect of paratuberculosis on culling, milk production, and milk quality in dairy herds. J Am Vet Med Assoc. 227, 1302-1308.
10) 公益社団法人北海道酪農検定検査協会(2014)牛群 検定成績
11) Johnson-Ifearulundu, Y., Kaneene, J.B., Lloyd, J.W.
(1999) Herd-level economic analysis of the impact of paratuberculosis on dairy herds. J Am Vet Med Assoc. 214, 822-825.
12) 独立行政法人家畜改良センター個体識別部(2014)
牛の個体識別情報検索サービス
13) 小谷貴彦(2000)乳用牛群におけるヨーネ病浸潤シ ミュレーション.獣医疫学雑誌. 4 ,39−46.
14) Kudahl, A.B., Ostergaard, S., Sørensen, J.T., et al.
( 2 0 0 7 ) A s t o c h a s t i c m o d e l s i m u l a t i n g paratuberculosis in a dairy herd. Prev Vet Med.
78, 97-117.
15) Logar, K., Kopinč, R., Bandelj, P., et al. (2012) Evaluation of combined high-efficiency DNA extraction and real-time PCR for detection of Mycobacterium avium subsp. paratuberculosis in subclinically infected dairy cattle: comparison with faecal culture, milk real-time PCR and milk ELISA.
BMC Vet Res. 8:49. doi: 10.1186/1746-6148- 8 -49.
16) Magombedze, G., Ngonghala, C.N., Lanzas, C. (2013) Evalution of the “Iceberg Phenomenon” in Johne’s Disease through Mathematical Modelling. PLoS One. 8, e76636
17) Marcé, C., Ezanno, P., Weber, M.F., et al. (2010) Invited review: modeling within-herd transmission of Mycobacterium avium subspecies paratuberculosis in dairy cattle: a review. J Dairy Sci. 93, 4455-4570.
18) Marcé, C., Ezanno, P., Seegers, H., et al. (2011) Predicting fadeout versus persistence of
180 家畜衛生学雑誌 第42巻第 4 号(2017)
た.ホルスタイン種牛(ホル)219頭および黒毛和種牛
(黒毛)116頭の乳量,体細胞リニアスコア,年間分娩回 数および体重を調査し,混合効果モデルにより各生産性 指標と排菌量を比較した.ホルにおいて,高度排菌牛の 乳量は陰性牛に対して13%少なかった.黒毛では年間分 娩回数が陰性牛に対して高度排菌牛で22%少なく,体重 が陰性牛に対して低度および高度排菌牛でそれぞれ 7.2%および19%少なかった.次いで,罹患牛を摘発・
淘汰しない場合のヨーネ病有病率をCollins-Morganモデ ルにより推定した.モデルに用いたパラメータはホルお よび黒毛飼養農場各 6 農場の疫学調査成績を基に設定し
た.定常化後の低度および高度排菌牛の有病率は,ホル 飼養農場でそれぞれ69%および12%,黒毛飼養農場でそ れぞれ67%および17%と推定された.ヨーネ病有病率が 定常化した農場は,ヨーネ病非浸潤農場に対してホル飼 養農場では乳量が1.6%少なく,黒毛飼養農場では年間 分娩回数および体重がそれぞれ3.8%および8.0%少ない と推定された.
キーワード:ヨーネ病,生産性損失,リアルタイム PCR,Collins-Morganモデル
181
Assessment of risk for acetylated derivatives of deoxynivalenol in pigs
Yosuke Uchiyama 1) , Kaori Toya 2) , Seigo Ito 2) , Tomoyuki Kadota 3) , Arisa Iwanuma 2) , Yoshiko Sugita-Konishi 4) *
豚に対するデオキシニバレノールのアセチル化誘導体のリスク評価
内山陽介1 )・戸谷香央里2 )・伊東正吾2 )・門田智之3 )・岩沼有沙2 )・小西良子4 )*
( 1) Meat Inspection Station, Kanagawa Prefectural Government, 892-1 Sakai, Atsugi-shi, Kanagawa 243-0022, Japan
2) Department of Veterinary Sciences, Azabu University, 1-17-71 Fuchinobe, Chuo-ku, Sagamihara-shi, Kanagawa 252-5201, Japan
3) Central Labratories for Key Technologies, Research and Development Division, Kirin Company Limited, 1-13-5, Fukuura, Kanazawa-ku, Yokohama 236-0004, Japan
4) The graduate School of Life and Environmental Sciences, Department of Food and Life Sciences, Azabu University, 1-17-71 Fuchinobe, Chuo-ku, Sagamihara-shi, Kanagawa 252-5201, Japan
* Corresponding author: Yoshiko Sugita-Konishi ([email protected]) )
(Received 29. Aug. 2016/Accepted 5. Dec. 2016)
Summary
To assess the risk of acetylated trichothecene mycotoxin deoxynivalenols (DONs) in feed by surveillance of the contamination of DON, the levels of 15-acetyl DON (15ADON) and 3-acetyl DON (3ADON) in feed and their toxicokinetics in pig blood samples were evaluated. DON and acetylated DONs in samples were analyzed by liquid chromatography-tandem mass spectrometry and enzyme-linked immunosorbent assay. DON and 15ADON were detected in both formula and liquid feed, while 3ADON was detected in only the formula feed. A toxicokinetic experiment using the diet administration route with DON and acetylated DONs revealed that the acetylated DONs were immediately converted to DON in the blood. The Cmax values of 15ADON and 3ADON were 115%
and 52% of that of DON, respectively. The Tmax showed that the acetylated DONs were absorbed earlier that DON. These results demonstrated that 15ADON could achieve a similar concentration to DON in the blood earlier than DON and contaminated both formula and liquid feeds, thus suggesting it may be a newly recognized risk for swine health.
Key words: Deoxynivalenol, acetylated derivatives, pigs, toxicokinetics
Jpn. J. Anim. Hyg. 42, 181〜189(2017)
Original report
1 ) 神奈川県食肉衛生検査所
〒243−0022 神奈川県厚木市酒井892− 1
2 ) 麻布大学 獣医学部
〒252−5201 神奈川県相模原市中央区淵野辺 1 −17−71
3 ) キリン株式会社R&D本部 基盤技術研究所 〒236−0004 神奈川県横浜市金沢区福浦 1 −13− 5
4 ) 麻布大学大学院 環境保健科学研究科、麻布大学 生命・
環境科学部
〒252−5201 神奈川県相模原市中央区淵野辺 1 −17−71
* 連絡著者:小西良子([email protected])
182 Jpn. J. Anim.Hyg. Vol. 42, No.4(2017)
Introduction
Trichothecene mycotoxin deoxynivalenol (DON) is a toxic secondary metabolite produced by Fusarium fungi in commodities. DON contamination in raw materials, such as grain used for food and feed, has been recognized worldwide 5, 17). The fact that corn is often used as the main raw material for animal feed presents a feed contamination problem 16). In addition, its contamination has also been confirmed in wheat in Japan 23). Furthermore, liquid feed, which is used as feed for pigs, is made of food debris, including wheat flour products such as bread and noodles. DON e x p o s u r e i n a n i m a l s r e s u l t s p r i m a r i l y i n gastrointestinal disorders, vomiting and immune toxicity. Pigs have the highest sensitivity to DON
among livestock, and DON exposure in swine is known to cause loss of appetite and poor growth, vomiting by the relative law level of DON and consequently bring the reduction of productivity 9).
Regarding the regulation of DON, the established advisory level (the guidance level for confirming the effectiveness of control measures taken by feed manufacturers to reduce contamination) for livestock feed in Japan (with the exception of cattle aged older than three months) is 1 mg/kg (http://www.famic.
go.jp/ffis/feed/r_safety/r_feeds_safety22.html#
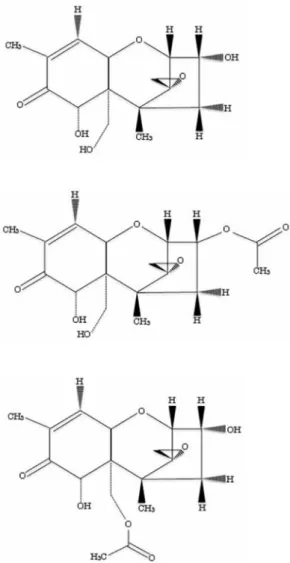
mycotoxins, accessed 12 November 2016). However, in recent years, acetylated derivatives DONs (Fig. 1) have been reported to be contaminated simultaneously with DON in food and feed 1, 16). While this presents some concern, information on the contamination status of
Figure 1. Structures of DON and acetylated DONs.
Deoxynivalenol(DON)
3-acetyl-deoxynivalenol (3ADON)
15-acetyl-deoxynivalenol (15ADON)
Yosuke Uchiyama et al.:Assessment of risk for acetylated deoxynivalenols in pigs 183
kg body weight) or 0.85 kg/day (10-20 kg body weight) according to the Japanese Feeding Standard (pig) 2005 version 15). The pigs were divided into 4 groups as follows: DON (n=6) , 3ADON (n=3) , 15ADON (n=5) and control group (n = 5) and administrated a bolus with DON or acetylated DON or without them ,via mouth. Boluses formed into bite-sized pieces by mixing with 4 mL of water were administered one-by-one, by hand. Blood samples were collected from the jugular vein of each pig at 5, 10, 20 and 30 min, and 1, 2, 3, 4 and 8 hr after oral administration. The blood samples were centrifuged, and the serum was stored at -35℃
until analysis.
Analysis of DON, 3ADON and 15ADON in feed and blood
Formula feed samples were weighed accurately to 25 g and extracted using 100 mL of acetonitrile:water (85:15) with shaking for 30 min. For liquid feed, acetonitrile was added to adjust to 85% with shaking for 30 min. These extracts were centrifuged at 1680×g for 10 min. The supernatant was cleaned up using a MultiSep 226 multi-functional column (Romer Labs, Tulln, Austria) in accordance with the method of Tanaka 21) and Sulyok 20). The eluates were then analyzed by electrospray-ionization (ESI) LC-MS/MS.
To determine the total concentration of DON and acetylated DON in blood, the serum was analyzed by ELISA after centrifuging. ELISA was performed in accordance with the method of Maragos 13). The sample obtained for the evaluation of toxicokinetics by administration of 3ADON and 15ADON was analyzed by LC-MS/MS. The LC-MS/MS system consisted of an Agilent 1100 (Agilent Technology, CA, USA), and a Quattro Ultima (Jasco International, Tokyo, Japan). LC was performed on an Agilent Zolbax Eclipse XDB C18 column (150 mm × 2.1 mm, 3.5 µm). The mobile phase consisted of a linear gradient of 10 mM ammonium acetate and methanol. The proportion of methanol was increased from 10% (0 min) to 90% (40 min). All separations were carried out at a flow rate of 0.2 mL/
min and an injection volume of 20 µL. MS/MS was performed as described by Kadota et al. 12).
Statistical analyses
All of the samples in this study were examined in acetylated DONs in feed used in pig farms across
Japan is limited. Furthermore, the consumption of liquid feeds made from food debris has increased recently, yet its contamination status is also unclear.
Several studies have examined the toxicokinetics of DON in swine via the diet administration route with gavage administration 6, 10), but data on the toxicokinetics of acetylated DONs through this route are scarce.
In the present study, the levels of DON, 15-acetyl DON (15ADON) and 3-acetyl DON (3ADON) in commercial pig feed used on pig farms were analyzed by liquid chromatography-tandem mass spectrometry (LC-MS/MS) and enzyme-linked immunosorbent assay (ELISA). We then examined the toxicokinetics of DON and acetylated DONs in order to assess the risk of DON and acetylated DONs in sickening pigs.
Materials and Methods Feed sample and reagents
Fourteen formula feed samples (six types of dry feed from Company A) were collected from a domestic pig farm. Twenty-seven liquid feed samples were collected from another domestic pig farm. Liquid feed was produced from food debris (wheat flour products accounted for an average of 38% of the feed), which was fermented with lactic acid bacteria in the production process. These samples were collected between June 2011 and September 2011. DON standard was purchased from Wako Pure Chemical (Tokyo, Japan). 3ADON and 15ADON standards were purchased from Sigma-Aldrich (St. Louis, MO, USA).
These standards were dissolved in ethanol at 2 mg/mL, and added to 10 g of basic feed made of corn, soymeal, and wheat (Healthy Pig 3: Scientific Feed Laboratory, Tokyo) at concentration of 0.06mg/kg・body weight calculated from the weight of each pig. After well mixed, the bolus were formed and stored at -35℃ until use. For control, the bolus was formed with the addition of ethanol only.
Animal experiments
Pigs (4-5 weeks of age, Cross bred of Landrace and Large White) bred at Azabu University (Kanagawa, Japan) were individually housed with feed and water in cages. They were fed basic feed of 0.41 kg/day (5-10
184 Jpn. J. Anim.Hyg. Vol. 42, No.4(2017)
more than triplicate, and the resulting values are expressed as the mean and standard deviation. A one- way analysis of variance was used to evaluate the significance of the differences for each variable.
Toxicokinetic parameters, maximum serum concentration (Cmax), time to Cmax (Tmax) and area under of curve (AUC) were calculated from the data of each administration groups in these time courses 19).
These values were calculated using the Excel (2010) software program (Microsoft Co., Ltd., WA, USA).
Results
Contamination of DON and its acetylated derivatives in feed
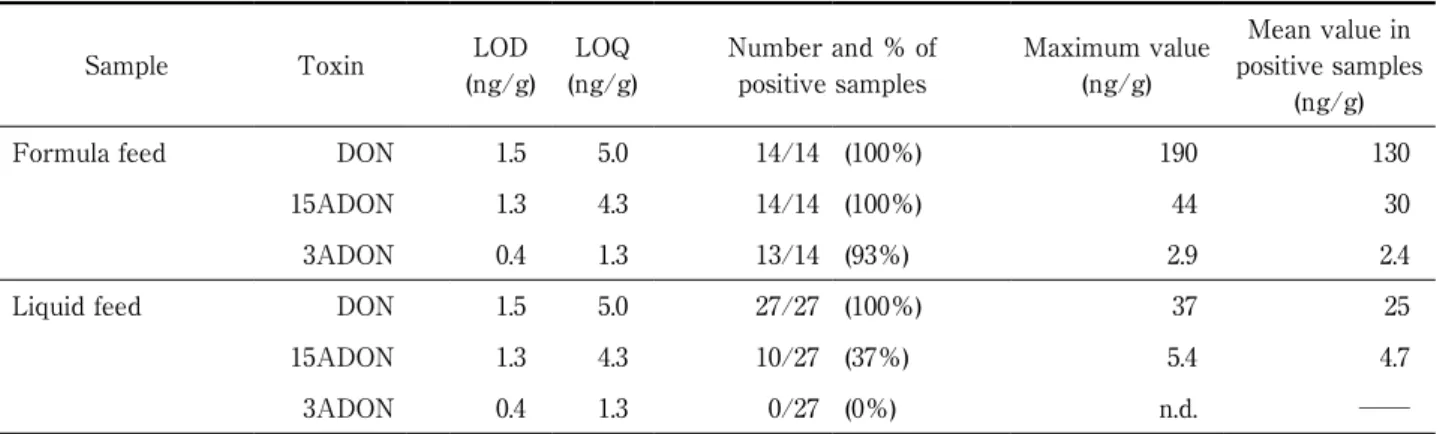
As shown in Table 1, in formula feed, the frequencies of detection of DON, 15ADON and 3ADON were 100%, 100% and 93%. The mean concentrations of DON, 15ADON and 3ADON were 130 ng/g, 30 ng/g and 2.4 ng/g. Compared to the average concentration of DON, 15ADON and 3ADON were about 23% and 2%, respectively in the formula feed. In the liquid feed, only DON and 15ADON were detected as over the limit of detection, and their frequencies were 100%
and 37%, respectively. The mean concentrations of DON and 15ADON were 25 and 4.7 ng/g, respectively.
Compared to the average concentration of DON, 15ADON was present in the liquid feed at about 19%.
The concentrations of DON and 15ADON in the formula feed were about 5- and 6-fold their concentrations in the liquid feed, respectively.
These results showed that DON and acetylated DONs were contaminated at high frequency in feed for
pigs. Although the DON concentration was under the regulation limit, both formula and liquid feeds were shown to be sources of chronic exposure to DON and acetylated DONs for pigs.
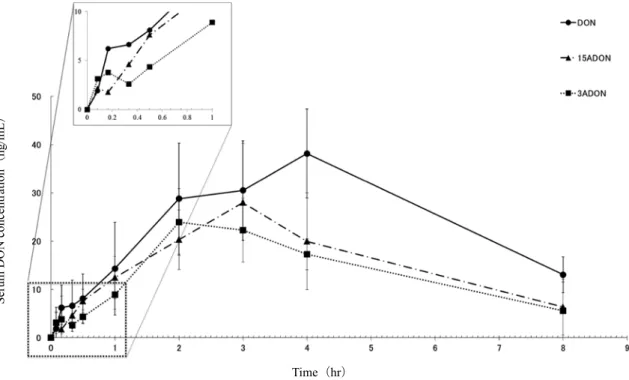
Toxicokinetics of DON and its acetylated derivatives by oral administration
Time courses of the total concentration of DON and acetylated DON in blood analyzed by ELISA when the boluses containing DON, 15ADON and 3ADON were administered to pigs are shown in Fig. 2. These compounds were all detected at 5 min after administration, and their levels rapidly increased over the following few hours before dropping to about a quarter of the maximum respective concentrations at 8 hr after administration. The DON ELISA kit used in the present study has cross-reactivity with 3ADON and 15ADON 13), but the LC-MS/MS patterns of blood collected from each group from 5 min to 8 hr after administration revealed that 3ADON and 15ADON were immediately converted to DON. Thus, the time courses in these groups actually represented the time course of DON in blood (Fig. 3).
Table 2 shows the parameters of the toxicokinetics study in these groups. Since the administration dose of each compound differed in this study, we corrected the Cmax and AUC values based on the mol concentration of the administration dose, with the Cmax concentration in mL of serum and the AUC in mL/hr. For the administration dose, the inherent molecular mass was used, while for Cmax and AUC, the molecular mass of DON was used, since all acetylated DONs were
Table 1. Occurrence of DON, 3ADON and 15ADON in feeds
Sample Toxin LOD
(ng/g) LOQ (ng/g)
Number and % of positive samples
Maximum value (ng/g)
Mean value in positive samples
(ng/g)
Formula feed DON 1.5 5.0 14/14 (100%) 190 130
15ADON 1.3 4.3 14/14 (100%) 44 30
3ADON 0.4 1.3 13/14 (93%) 2.9 2.4
Liquid feed DON 1.5 5.0 27/27 (100%) 37 25
15ADON 1.3 4.3 10/27 (37%) 5.4 4.7
3ADON 0.4 1.3 0/27 (0%) n.d. ──
Yosuke Uchiyama et al.:Assessment of risk for acetylated deoxynivalenols in pigs 185
Figure 2. Time course of DON in blood after oral administration of DON, 3ADON and 15ADON.
The values determined by ELISA are presented as means ± standard deviations.
Time(hr)
SerumDONconcentration(ng/mL)
Figure 3. LC-MS/MS patterns of DON and acetylated DONs in pig serum after oral administration of each compound.
Pigs were given 10 g boluses of diet including 0.06mg/kg・BW of DON, 3ADON or 15ADON in each group. The control group was given boluses of diet with ethanol with no contamination.
186 Jpn. J. Anim.Hyg. Vol. 42, No.4(2017)
converted to DON in blood. The mean Cmax/admission (mol/mol) values in the DON, 15ADON and 3ADON groups were 5.2 × 10⁻⁵, 6.0 × 10⁻⁵ and 2.8 × 10⁻⁵. Compared with the Cmax of DON based on these values, those of 15ADON and 3ADON were 115.3% and 52.8%, respectively. However, no statistical difference could be found between the concentrations of DON and acetylated DONs. The means Tmax values in the DON, 3ADON and 15ADON groups were 4.0 ± 0, 2.7 ± 1.2 and 2.8 ± 0.4 hr, demonstrating that the acetylated DONs reached their maximum blood concentration faster than DON. The AUC/admission (mol/mol) values in the DON, 15ADON and 3ADON groups were 2.69 × 10⁻⁴, 2.37 × 10⁻⁴ and 1.43 × 10⁻⁴. Compared with the AUC of DON based on these values, those of 15ADON and 3ADON were 88.0% and 53.2%, respectively.
These results suggested that 15ADON tends to be absorbed to a greater degree and more quickly than DON.
Discussion
Recently, the contamination of acetylated DONs such as 3ADON and 15ADON in food and feed, along with DON, has been reported. The surveillance of these derivatives in foodstuffs revealed that the level of contamination amounted to less than 10% the level of DON contamination 22), leading to concerns about potential health problems. Among livestock, pigs are known to be the most sensitive to the adverse effects
of DON. However, data on the contamination of acetylated DONs in feed in Japan and their toxicokinetics when ingested orally with diet are scarce. In this study, to assess the risk associated with acetylated DONs for pigs, we analyzed commercial formula and liquid feeds supplied in Japan and compared their toxicokinetics when ingested via the diet.
First, regarding contamination, DON was detected in all samples of formula and liquid commercial feeds assessed in the present study (Table 1). Main materials of formula feeds are grain. DON contamination of grain has been the subject of substantial research. According to the European Food Safety Authority (EFSA), an investigation from 2007 to 2012 detected DON in about half of samples, including processed food or feed and its raw material grains, and the DON concentrations in feed were higher than in processed foodstuffs 7). Similarly, in domestic corn silage, DON was detected in most samples 14). Furthermore, monitoring by the Food and Agricultural Materials Inspection Center in 2015 revealed that DON was present in 100% of pig feed that was examined in Japan (http://www.famic.
go.jp/ffis/feed/info/sub2.html, accessed 12 November 2016). Furthermore, Inês Rodrigues et al. reported that DON was present in 59% of the feedstuffs and feed sourced from the Americas, Europe and Asia between 2009 and 2011 18). Therefore, mixed feed containing corn or cereal should be considered by default as being Table 2. Kinetics of DON after oral administration of DON, 3ADON and 15ADON
Administered mycotoxin
Dose a) (Average, mg/animal)
Cmax
(ng/mL)
Cmax/admission b) (mol/mol,×10-5)
Ratio of Cmax
(DON) c) (%)
Tmax
(hr)
AUC (ng/mL・hr)
AUC/admission d) (mol/mol,×10-4)
Ratio of AUC (DON) e)
(%) DON 0.73 38.17 ± 9.22 5.2 ± 1.3 100.0 ± 24.2 4.0 ± 0 196.35 2.69 ± 0.62 100.0 ± 23.1 15ADON 0.53 28.05 ± 12.20 6 ± 2.6 115.3 ± 50.3 2.8 ± 0.4 123.97 2.37 ± 0.94 88.0 ± 34.9 3ADON 0.99 24.35 ± 6.43 2.8 ± 0.74 52.8 ± 14.2 2.7 ± 1.2 109.87 1.43 ± 0.34 53.2 ± 12.8 a) Pig was administrated with DON or acetylated derivatives at 0.06 mg/kg body weight
b) To correct for the difference in the administration dose of DON and the acetylated derivatives, the Cmax was recalculated based on the mol amount.
c) To compare the Cmax values of DON and the acetylated derivatives, the Cmax ratio was calculated.
d) To correct for the difference in the administration dose of DON and the acetylated derivatives, the AUC was recalculated based on the mol amount.
e) To compare the AUC values of DON and the acetylated derivatives, the AUC ratio was calculated.
Cmax : maximum serum DON level (mean ± SD), Tmax : time to maximum serum DON concentration, AUC: area under the curve from time of the first quantifiable concentration to the time of the last quantifiable concentration