The Expected Rate of Return on Plan Assets and
the Related Disclosures
journal or
publication title
International review of business
number
16
page range
65-85
year
2016-03
1. Introduction
Various economic assumptions have an important role in calculating defined benefit obligations, plan assets, and defined benefit cost, and the changes in these assumptions have significant effects on a firm’s balance sheet and income statement. Several papers reveal the effects of determination of discount rates, expected rates of return on plan assets (ERR), and rates of future salary increases on financial statements. For example, Okumura (2005) states that, if a firm increases the discount rate one percentage point from 3% to 4% under certain conditions, defined benefit obligations will drop by 23%. Bauman and Shaw (2014) attempt to show the magnitude of the effect of sensitivity of defined benefit cost on potential
and the Related Disclosures
Eriko KASAOKA*
Abstract
Actuarial assumptions have an important role to play in calculating defined benefit obligations and defined benefit cost. These assumptions include the discount rate, expected rate of return on plan assets (ERR), mortality, and the rate of employee turnover. Changes in these assumptions have a significant effect on financial statements, and several papers demonstrate that firms use actuarial assumptions for earnings management. This paper aims to discern if pension components and other financial statement factors have any effect on the determination of the ERR. Its results show that cash flows from operating activities and tax-paying status have no relationship in determining the ERR. On the other hand, leverage, operating income, and pension funding do show relationships that are positive and significant. The coefficient signs of operating income and pension funding are opposite from what would be expected, which indicates that firms with high profitability and pension funding status adopt higher ERR. However, the coefficient for leverage shows that when a firm’s leverage is high, it adopts a high ERR. The amount of defined benefit liability has a significant effect on the balance sheet. Firms appear to consider their financial condition and increase the ERR to reduce the defined benefit cost, and thereby lessen the impact of the volatility in securities markets that affects the return on plan assets.
Keywords: Expected rate of return on plan assets, Defined benefit cost, Actuarial assumptions, Operating income, Pension funding status.
changes in the discount rate or ERR. They report that firms decreasing their discount rates produce an 8% decline in their operating income, and those increasing rates boost it by 9% on average. With regard to ERRs, firms decreasing rates cut their operating income by 2.8%, and those increasing rates raise it 3.5%. Other papers discuss firms’ use of these assumptions for earnings management.
ASBJ Statement No.26: Accounting Standard for Retirement Benefits (ASBJ Statement 26) states that the discount rate is determined based on the yields on safe and secure long bonds. These include government bonds, government agency securities, and high-grade corporate bonds (ASBJ Statement 26, par.20). It appears that the discount rate can be determined in an objective way based on this information. On the other hand, the ERR is determined based on firm-specific information, including its investment portfolio and plan asset management in the past. Firms might have an opportunity to change the ERR for earnings management. Therefore, this paper’s aim is to show if pension components and other financial statement factors affect the determination of the rates, which have a significant impact on a firm’s income statement.
2. Setting Rules for Expected Rate of Return on Plan Assets
ASBJ Guidance No.25: Guidance on Accounting Standard for Retirement Benefits (ASBJ Guidance 25) states that the ERR is determined based on investment portfolio, management performance in the past, management policy, and the market for plan assets that firms hold (ASBJ Guidance 25, par.25). The return is calculated based on the ERR multiplied by plan assets at the beginning of the period (ASBJ Statement 26, par.23). The difference between the actual rate and the ERR is recognized as actuarial gains and losses in defined benefit cost (ASBJ Guidance 25, par.34). The amount can be recognized over the average remaining service life of the firm’s employees (ASBJ Statement 26, par.24). The amount which is not recognized for the period is recognized as actuarial gain or loss in other comprehensive income (ASBJ Statement 26, par.24). The ERR can be changed when the change in the rate would have a significant effect on the amount of profit or loss for the period, which is called the principle of changes in actuarial assumptions (ASBJ Guidance 25, par.31).1
Under ASBJ Statement 26, the following information is required to be disclosed in the footnotes (ASBJ Statement 26, par.30):
(a) Summary of retirement benefit plans that a firm adopts;
1 Significant change is not clearly defined in the guidance. However, the principle of changes in discount rate is stated as follows: a significant change in the discount rate is considered to have occurred when the defined benefit obligations as measured using a discount rate at the end of the year are compared to those at the end of the previous year, and the difference exceeds 10% of the previous year’s obligations (ASBJ Guidance 25, par.30).
(b) The breakdown of changes in defined benefit obligations and plan assets in the period;
(c) The breakdown of defined benefit obligations, plan assets, and defined benefit liability;
(d) Profit or loss related to retirement benefits;
(e) The amount of actuarial gains and losses and past service cost recognized in other comprehensive income;
(f) The amount of unrecognized actuarial gain or loss and unrecognized past service cost recognized in accumulated other comprehensive income;
(g) Items regarding plan assets including the allocation of plan assets; and (h) Actuarial assumptions (discount rates, ERRs, and other important assumptions). Items (b), (d), (e), (f), (g) and (h) are related to the ERR. The International Accounting Standards Board (IASB) issued revised International Accounting Standard No.19: Employee Benefits (IAS19) in 2011, and firms have been required to adopt it since fiscal 2013. The revised IAS19 states that the ERR was eliminated for calculating the return on plan assets, because the IASB found it difficult to determine the return in an objective way, and the possibility existed that the return would include some portion that occurred not simply from the passage of time (IAS19, par.BC78). Currently, the return on plan assets is calculated by multiplying the fair value of plan assets at the beginning of the period by the discount rate, which is determined by reference to market yields at the end of the reporting period on high quality corporate bonds (IAS19, pars.83, 125). Under Japanese accounting standards, firms can determine their ERRs at their discretion because they utilize firm-specific information to set their ERRs; therefore, there are several disclosure items related to ERR which would provide financial statement users useful information for predicting the determination.
3. Expected Rate of Return on Plan Assets Adopted by Japanese Listed Firms
Generally two types of public pension plans, National Pension and Employees’ Pension Insurance, and one or two types of corporate pension plans — including Employees’ Pension Fund, Defined-Benefit Corporate Pension, or Defined-Contribution Pension Plan — are provided to employees in Japan. Firms can decide whether they offer pension plans to their employees, and they choose which pension plan is provided. Recently, firms have tended to change a part or all of their defined benefit plans to defined contribution plans owing to the volatility and the significance of the effect of defined benefit plans on their financial statements.
Table 1 shows the number of firms selected for analysis in this study. From fiscal 2000 to 2014, the number of firms listed on Japanese stock exchanges grew from about 1,800 to
2,800. With the purpose of showing the range of and changes in ERRs, this study uses the number of firms listed on Japanese stock exchanges that disclose both plan assets and the ERR. All firms treated in this study adopt Japanese accounting standards. The “Total” row at the bottom of Table 1 shows these numbers for the 2000 to 2014 time-span.
Table 2 shows the range of ERRs firms adopt. Most firms tend to choose ERRs within a wide range of 1.00% to 3.99%. The ERRs are determined based on investment portfolio, management performance in the past, management policy, and the market for plan assets that firms hold (ASBJ Guidance 25, par.25). Comparing ERRs to the range of discount rates Japanese listed firms adopt, about 90% of firms choose discount rates ranging from 1.00% to 2.99%, whereas the range of ERRs on plan assets is much wider. The mean and standard deviation for the ERRs are also higher than those for discount rates.2 Table 2 suggests that firms can make discretionary decisions on setting ERRs.
Table 1. Yearly Totals of Firms Selected
2000 2001 2002 2003 2004 2005 2006 2007
Firms Listed on Japanese Stock
1,834 1,903 1,995 2,086 2,191 2,276 2,356 2,416 Exchanges Excluding Firms: -with Less-Than-12-Month 13 8 6 9 15 8 9 11 Accounting Periods
-without Plan Assets 467 186 248 304 380 449 529 568
-not Disclosing Expected
179 236 252 273 288 291 290 297
Rates of Return
Total 1,175 1,473 1,489 1,500 1,508 1,528 1,528 1,540
2008 2009 2010 2011 2012 2013 2014
Firms Listed on Japanese Stock
2,473 2,534 2,593 2,694 2,755 2,810 2,837 Exchanges Excluding Firms: -with Less-Than-12-Month 4 13 19 19 20 20 16 Accounting Periods
-without Plan Assets 629 703 805 961 1,010 1,059 1,121
-not Disclosing Expected
285 277 252 245 254 255 242
Rates of Return
Total 1,555 1,541 1,517 1,469 1,471 1,476 1,458
2 Kasaoka, E. (2015). “The Determinants of Discount Rates on Retirement Benefits in Japan,”International Review of Business, No.15, p.61.
Table 3 shows how often and by how much firms change their ERRs from fiscal 2000 to 2014. As explained above, the ERR is set based on a firm’s investment portfolio or the market capitalization of plan assets. Japanese firms tend to invest 15% to 32% of their plan assets in domestic stocks, 15% to 20% in foreign stocks, 20% to 30% in domestic bonds, and 10% to 13% in foreign bonds.3 The change in ERR is strongly influenced by security
Table 2. The Range of ERR Firms Adopt
2000 2001 2002 2003 2004 2005 2006 2007 Under 1.0% 12 32 103 202 196 175 135 109 1.0% to 1.99% 101 196 255 291 292 305 291 290 2.0% to 2.99% 153 278 473 606 668 690 692 696 3.0% to 3.99% 523 596 427 270 236 250 271 283 4.0% to 4.99% 250 257 166 88 71 66 85 96 5.0% to 5.99% 107 80 40 14 15 8 20 25 6.0% to 6.99% 15 16 7 5 6 7 5 8 7.0% to 7.99% 3 4 4 6 4 10 9 11 Over 8.0% 11 14 14 18 20 17 20 22 No. of Firms 1,175 1,473 1,489 1,500 1,508 1,528 1,528 1,540 Mean 3.421 3.118 2.624 2.229 2.191 2.211 2.344 2.437 Std. Dev. 1.262 1.310 1.346 1.389 1.331 1.295 1.312 1.356 2008 2009 2010 2011 2012 2013 2014 Under 1.0% 116 179 163 149 147 128 118 1.0% to 1.99% 295 337 352 369 416 447 485 2.0% to 2.99% 717 698 693 665 656 645 618 3.0% to 3.99% 272 218 215 205 179 179 154 4.0% to 4.99% 80 50 40 24 20 26 43 5.0% to 5.99% 29 15 12 12 12 12 23 6.0% to 6.99% 14 11 12 14 9 11 6 7.0% to 7.99% 11 13 16 15 18 16 4 Over 8.0% 21 20 14 16 14 12 7 Number of Firms 1,555 1,541 1,517 1,469 1,471 1,476 1,458 Mean 2.399 2.180 2.156 2.132 2.066 2.080 2.040 Std. Dev. 1.361 1.386 1.332 1.342 1.288 1.261 1.123
3 Pension Fund Association, “The Survey and Comment on Plan Asset Management,” http://www.pfa.or. jp/activity/tokei/shisanunyo/jittai/index.html.
Table 3. The Frequency and the Level of Changes in ERR 2000-2001 2001-2002 2002-2003 2003-2004 2004-2005 2005-2006 2006-2007 2007-2008 2008-2009 Decreasing ERR x < -1.0% 115 202 171 43 23 17 16 57 128 -1.0% ! x < -0.5% 89 214 151 52 35 20 14 46 76 -0.5% ! x < -0.1% 104 212 253 131 85 36 28 61 113 -0.1% ! x < 0% 5 2 9 14 13 16 11 8 13 313 630 584 240 156 89 69 172 330 No Change 0% 818 803 841 1,111 1,210 1,212 1,264 1,229 1,121 Increasing ERR 0% < x ! 0.1% 3 - - 7 9 9 10 18 15 0.1% < x ! 0.5% 14 8 12 34 43 58 72 42 24 0.5% < x ! 1.0% 13 1 4 32 29 46 36 26 10 x > 1.0% 12 2 15 38 46 86 62 31 15 42 11 31 111 127 199 180 117 64 No. of Firms 1,173 1,444 1,456 1,462 1,493 1,500 1,513 1,518 1,515 Mean -0.283 -0.484 -0.380 -0.034 0.018 0.139 0.093 -0.062 -0.236 Std. Dev. 0.787 0.781 0.794 0.669 0.560 0.720 0.583 0.676 0.798 2009-2010 2010-2011 2011-2012 2012-2013 2013-2014 Decreasing ERR x < -1.0% 44 47 28 23 23 -1.0% ! x < -0.5% 38 51 58 52 42 -0.5% ! x < -0.1% 78 70 108 91 74 -0.1% ! x < 0% 21 24 20 20 18 181 192 214 186 157 No Change 0% 1,199 1,177 1,157 1,114 1,064 Increasing ERR 0% < x ! 0.1% 11 19 12 17 27 0.1% < x ! 0.5% 42 26 40 44 68 0.5% < x ! 1.0% 23 17 18 33 59 x > 1.0% 39 17 15 60 59 115 79 85 154 213 No. of Firms 1,495 1,448 1,456 1,454 1,434 Mean -0.030 -0.061 -0.059 0.030 0.080 Std. Dev. 0.649 0.573 0.421 0.678 0.641
-60 -40 -20 0 20 40 60 20 00 20 01 20 02 20 03 20 04 20 05 20 06 20 07 20 08 20 09 20 10 20 11 20 12 20 13 20 14 % Domestic Stocks Domestic Bonds Foreign Stocks Foreign Bonds
Figure 1. Rates of Return Categorized by Assets
Source: Pension Fund Association, “The Survey and Comment on Plan Asset Management,” http:// www.pfa.or.jp/activity/tokei/shisanunyo/jittai/index.html. These rates are calculated based on the following information by the association: Domestic Stocks (TOPIX), Domestic Bonds (NOMURA-BPI), Foreign Stocks (MSC-KOKUSAI), Foreign Bonds (Citi world government bond index).
markets. Figure 1 shows the rates of return on domestic and foreign securities from 2000 to 2014.
On average, Japanese firms invest 35% to 50% of their plan assets in domestic and foreign stocks. Figure 1 shows that the movement for the rate of return on Japanese stocks is linked to that on foreign stocks. In years when the average rate of return on Japanese stocks is negative from 2000 to 2002, and 2007 to 2008, more firms decreased their ERRs. On the other hand, when the average rate of return on Japanese stocks was positive from 2003 to 2006 and after 2012, more firms increased their ERRs. However, most firms tend not to change their ERRs; indeed, each year about 55% to 80% of firms record no change.
With regard to the level of changes in ERRs, when the average rate of return on Japanese stocks was negative from 2000 to 2002 and 2007 to 2008, the number of firms decreasing their ERRs more than 0.5 percentage points increased. When the average rate of return on Japanese stocks was stable or increased, firms tended to decrease the rates less than 0.5 points. The same pattern can be seen for firms increasing their ERRs. When the average rate of return on Japanese stocks was positive from 2003 to 2006 and after 2012, firms increasing their ERRs raised them more than 0.5 points. Therefore, the determination of the ERR is affected by social and economic circumstances.
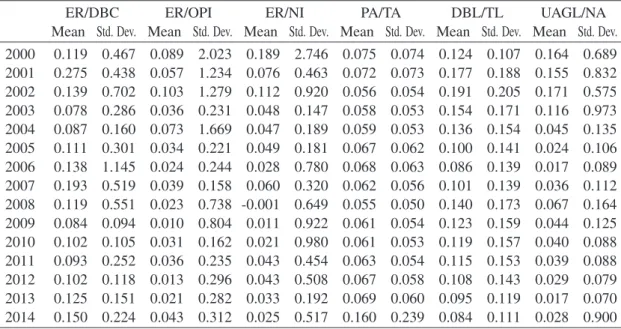
Table 4 shows the effect of expected return on plan assets and other pension items on financial statements. Over the 2000 to 2014 period, the average impact of the expected
Table 4. The Effect of Expected Return on Plan Assets on Financial Statements
ER/DBC ER/OPI ER/NI PA/TA DBL/TL UAGL/NA
Mean Std. Dev. Mean Std. Dev. Mean Std. Dev. Mean Std. Dev. Mean Std. Dev. Mean Std. Dev. 2000 0.119 0.467 0.089 2.023 0.189 2.746 0.075 0.074 0.124 0.107 0.164 0.689 2001 0.275 0.438 0.057 1.234 0.076 0.463 0.072 0.073 0.177 0.188 0.155 0.832 2002 0.139 0.702 0.103 1.279 0.112 0.920 0.056 0.054 0.191 0.205 0.171 0.575 2003 0.078 0.286 0.036 0.231 0.048 0.147 0.058 0.053 0.154 0.171 0.116 0.973 2004 0.087 0.160 0.073 1.669 0.047 0.189 0.059 0.053 0.136 0.154 0.045 0.135 2005 0.111 0.301 0.034 0.221 0.049 0.181 0.067 0.062 0.100 0.141 0.024 0.106 2006 0.138 1.145 0.024 0.244 0.028 0.780 0.068 0.063 0.086 0.139 0.017 0.089 2007 0.193 0.519 0.039 0.158 0.060 0.320 0.062 0.056 0.101 0.139 0.036 0.112 2008 0.119 0.551 0.023 0.738 -0.001 0.649 0.055 0.050 0.140 0.173 0.067 0.164 2009 0.084 0.094 0.010 0.804 0.011 0.922 0.061 0.054 0.123 0.159 0.044 0.125 2010 0.102 0.105 0.031 0.162 0.021 0.980 0.061 0.053 0.119 0.157 0.040 0.088 2011 0.093 0.252 0.036 0.235 0.043 0.454 0.063 0.054 0.115 0.153 0.039 0.088 2012 0.102 0.118 0.013 0.296 0.043 0.508 0.067 0.058 0.108 0.143 0.029 0.079 2013 0.125 0.151 0.021 0.282 0.033 0.192 0.069 0.060 0.095 0.119 0.017 0.070 2014 0.150 0.224 0.043 0.312 0.025 0.517 0.160 0.239 0.084 0.111 0.028 0.900
ER=expected return on plan assets, DBC=defined benefit cost, OPI=operating income, NI=net income, PA=plan assets, TA=total assets, DBL=defined benefit liability, TL=total liabilities, UAGL=unrecognized actuarial gain or loss, NA=net assets
return on defined benefit cost ranges from 8% to 27%. The return also had a positive effect on operating income; the ratio ranges from 1% to 10%.
As for the impact of expected return on plan assets on net income, it ranges from positive 1% to 19%. The year 2008 is an exception. That year, with the bankruptcy of Lehman Brothers, the world economy took a sharp downturn. Many firms recorded losses, and the ERR impact on net income is negative.
Other pension items also have significant effects on financial statements over the 2000 to 2014 period. The ratio of plan assets to total assets ranges from 5% to 16%, and defined benefit liability to total liabilities ranges from 8% to 19%. The amount of unrecognized actuarial gain or loss is strongly affected by bond and stock prices, and its ratio to net assets ranges from 1% to 17%. The table shows that unrecognized actuarial gain or loss is highly volatile.
4. Prior Research
Actuarial assumptions have an important role in calculating defined benefit obligations, plan assets, defined benefit liability, and defined benefit cost. There are several researches
studying the effect of changes in actuarial assumptions on the financial statements. As explained in Section 1, Okumura (2005) shows that if a firm increases the discount rate one percentage point from 3% to 4% under certain conditions — (a) employees’ average age is 40, (b) retirement age is 60, and (c) the period of benefit is 15 years — then the amount of defined benefit obligations decreases by 23%. Bauman and Shaw (2014) demonstrate a reduction in discount rates by firms has a negative effect on their operating income, while increasing rates has a positive effect. With regard to ERRs, the same result can be shown. Kasaoka (2015) discusses the required disclosures of sensitivity analysis of Japanese firms adopting IFRSs for their discount rates. The result indicates that when a firm decreases the discount rate by 0.5 points, the amount of defined benefit obligations increases 5.9% on average. On the other hand, when a firm increases the discount rate by 0.5 points, defined benefit obligations decrease 5.2%.
The purpose of this paper is to analyze if pension components and other financial statement factors affect the determination of the ERRs. There are several papers discussing firms’ use of actuarial assumptions for earnings management. In Japan, accounting standards for retirement benefits require firms to disclose their discount rates and ERRs. In the US, Statement of Financial Accounting Standards No.87: Employers’ Accounting for Pensions and Statement of Financial Accounting Standards No.158: Employers’ Accounting for Defined Benefit Pension and Other Postretirement Plans require firms to disclose their discount rates, ERRs, and future salary increases. Most papers investigate the effect of changes in these assumptions.4For example, Gopalakrishnan and Sugrue (1995), Godwin et. al (1996), and Asthana (1999) test the relationship between firms’ discount rates and several factors which might motivate managers to smooth earnings. Gopalakrishnan and Sugrue (1995) find that the magnitudes of leverage and pension funding affect the choice of discount rate. Godwin et. al (1996) suggest that firms with stronger dividend restrictions, lower earnings, and higher leverage are more likely to increase their discount rates. Asthana (1999) concludes that firms with greater profitability, greater cash flows from operating activities, lower tax liability, smaller debt, and better pension funding status tend to choose conservative actuarial choices to maximize contributions.
As for ERRs, Comprix and Muller (2006) and Bergstresser et. al (2006) present evidence that managers appear to change them for earnings management in response to incentives, such as cash compensation for CEOs. Li and Klumpes (2013) test whether firms’ ERRs are associated with firm-specific opportunistic factors in the UK from 1998 to 2002. They include the debt to equity ratio, return on assets (ROA), plan asset composition, pension
4 However, it is also important to understand that other actuarial assumptions, including mortality or rates of employee turnover, have a significant effect on financial statements.
funding, actual rate of return on plan assets, and other factors in their models, and find that the ERR is positively related to the debt to equity ratio, which means that UK managers change their ERRs when there is a high probability of technical default under the loan covenant. Lew (2009) also studies whether firms exploit their actuarial assumptions for earnings management purposes. His study reveals that earnings per share, actual return on plan assets, and pension funding are related to the determinants of firms’ ERRs.
Adams et. al (2011) use a sample of firms over the period 1991 to 2005 to examine if they have an opportunity to inflate earnings through the determination of their ERRs. The study finds that the ERR is not overstated based on several benchmarks, including contemporaneous actual returns, historical actual rates of return, and expected returns based on asset allocation. The paper concludes that firms do not use their ERRs for earnings management. Newell et. al (2002) compare the ERRs between firms with plans that are better funded and those less well funded. They find that firms with better funded plans set their ERRs higher than those with less well funded plans. This suggests that those with less well funded plans have a more conservative investing strategy. Blankley and Swanson (1995) find a strong relationship between ERRs and the actual rate of return, and conclude that the ERR is not used in order to manage earnings or funding by firms.
Summarizing the researches, we find changes in the ERR have an impact on defined benefit cost in the income statement and unrecognized actuarial gain or loss in other comprehensive income. Firms can determine the ERR at their discretion, based on investment portfolio, management performance in the past, or management policy. Several papers conclude that the ERR is used for earnings management. Based on these researches, a firm’s leverage, profitability, cash flows, and tax-paying status might affect the determination of ERR if a firm uses it for earnings management.
5. Hypothesis Development and Research Design
This paper aims to reveal whether pension components and other financial factors affect the determination of ERRs. Under Japanese accounting standards, the expected return on plan assets is recognized as a part of defined benefit cost, which is disclosed in cost of sales or selling, general, and administrative expenses (ASBJ Statement 26, par.28). Therefore, the change in ERR would have an impact on operating income. The difference between the expected return on plan assets and the actual return is recognized as actuarial gains and losses, and they can be recognized over the average service life of employees. The amount of actuarial gains and losses not recognized in the period is disclosed as unrecognized actuarial gain or loss in other comprehensive income. If a firm sets the ERR much higher than the actual rate, it has to recognize unrecognized actuarial loss, which would have a negative effect on other comprehensive income in net assets. There are several factors that
might affect the determination of ERRs include leverage, profitability, cash flows, tax, firm size, pension items, and others if firms use their ERRs for earnings management purposes. The detail of each variable is explained below. In explaining the effect of pension components and other financial factors on the determination of ERRs, the following multiple regression model is employed:
ERRit = α0 +α1LEVit +α2OPIit + α3CASHit +α4TAXit + α5FUNDit +α6DBSIZEit
+ α7HORIZONit + α8DRit +α9SIZEit + α10JSTOCKit + α11JBONDit
+ !Industryit + !Yearit+ eit (1)
where ERRit is the level of the ERR disclosed in footnotes under Japanese accounting
standards for each period. To consider the time series and industry classification, panel data analysis is adopted.
(1) Leverage (LEV)
As explained above, the expected return on plan assets has an impact on operating income. It does not directly influence leverage. However, firms can improve their leverage through adopting higher ERRs, resulting in decreased estimated defined benefit cost. Li and Klumpes (2013) include leverage in their model, and conclude that leverage is positively related to the determination of ERR. In this paper, the debt to equity ratio is employed, which represents firms’ leverage and capital risk. The ratio has an effect on the cost of capital, which is the rate of return a firm is expected to earn. The ratio is calculated as total liabilities divided by shareholders’ equity. The effect of pension components is eliminated from the calculation. Before the current accounting standards were adopted in fiscal 2013, unrecognized actuarial gain or loss — the difference between ERR and the actual rate of return — was off-balance sheet. Therefore, when a firm’s leverage is higher, there is a possibility that the firm adopts a higher ERR to reduce and equalize the cost over several years. The leverage hypothesis can be stated as follows:
H1: Firms with higher leverage adopt higher ERRs to improve their leverage. (2) Profitability (OPI)
Adopting a higher ERR leads to less defined benefit cost, thus profitability increases. The change in ERR has a direct impact on the amount of operating income. Adams et. al (2011) and Li and Klumpes (2013) include ROA in their models to examine if a firm’s financial condition and profitability influence the determination of ERR. Adams et. al (2011) investigate whether firms with significant plan assets relative to operating income might manipulate their reported earnings by adopting higher ERRs. Profitability is defined as
operating income divided by the average amount of beginning and ending total assets for the period. When a firm’s profitability is lower, it might adopt higher ERR to increase operating income. Thus, the following hypothesis is employed:
H2: Firms with lower profitability adopt higher ERRs to increase their profitability. (3) Cash Flows from Operating Activities (CASH)
When defined benefit cost is recognized, the amount affects the balance sheet and the income statement. It is necessary to adjust the cash flow of defined benefit cost and other factors in cash flows from operating activities. The cash flow related to retirement benefits is recognized as changes in provisions and retirement benefit liabilities. The changes in provisions and retirement benefit liabilities is calculated in consideration of the amount of defined benefit cost, the contribution to pension funds, and payments of retirement benefits. When the amount of defined benefit cost exceeds that of other items, it has a positive effect on cash flows from operating income. The expected return on plan assets decreases the amount of defined benefit cost; therefore, it has a negative effect on cash flows from operating income.
H3: Firms with lower cash flows from operating activities adopt lower ERRs to increase their cash flows from operating activities.
(4) Tax-Paying Status (TAX)
Tax minimization is an important reason why firms provide pension plans to their employees. In Japan, all pension contributions can be recognized as expense for the period. The tax-paying status is indicated by the effective tax rate, measured as total income taxes divided by net income before taxes for the period. Decreases in ERR increase defined benefit cost, and as a result it reduces net income before taxes. Feldstein and Morck (1983) conclude that firms with overfunded status adopt lower interest rate assumptions to receive tax benefits. In Japan, most firms have underfunded status. Less than 10% of firms have overfunded status in this research. Therefore, it might be difficult to see the effect of a company’s tax burden on the determination of ERRs. However, there is a possibility that firms might adopt lower ERRs to reduce the amount of taxes they pay. The fourth hypothesis is as follows:
H4: Firms with higher effective tax rates adopt lower ERRs to decrease their tax burden. (5) Pension Funding (FUND)
There are several papers investigating the effect of a firm’s pension funding status on the choice of ERRs. Pension funding is calculated as plan assets divided by Projected Benefit Obligations (PBO). Newell et. al (2002), Lew (2009), and Li and Klumpes (2013) employ
the pension funding variable to see if it affects the level of ERRs. Lew (2009) finds that firms with lower pension funding status set their ERRs higher than those in a previous year to smooth reported amounts of defined benefit cost. Li and Klumpes (2013) also investigate whether firms with lower pension funding status choose higher ERRs. Thus ERR would be negatively related to pension funding status.
H5: Firms with lower pension funding status adopt higher ERRs to improve their funding status.
(6) Pension Size (DBSIZE)
Pension size is defined as the natural logarithm of defined benefit obligations. Pension size cannot be known from firm size, because if a large firm combines several pension plans including defined contribution plans or provides defined benefit plans only to employees in countries that require defined benefit plans, pension size would be smaller. Firms with larger pension plans have to recognize more defined benefit cost. Therefore, they might adopt higher ERRs to decrease the amount of defined benefit cost for the period. The following hypothesis is employed:
H6: Firms with larger pension plans adopt higher ERRs to reduce the amount of defined benefit cost.
However, if a firm’s pension size is large, it can achieve economies of scale for its pension management. The coefficient sign can be positive even though firms do not use ERRs for earnings management.
(7) Investment Horizon (HORIZON)
Investment horizon is measured as the natural logarithm of the ratio of PBO to current service cost. According to Amir et. al (2010), investment horizon has an important role when firms determine their plan asset allocation. Firms with relatively young workforces should invest in stocks, because defined benefit obligations for employees with short service lives are relatively long-term and primarily influenced by salary increases which are related to stocks. In contrast, firms with relatively mature workforces should invest in bonds, because defined benefit obligations for employees with long service lives are relatively short -term and primarily influenced by interest rates related to bonds. Amir et. al (2010) include this variable in their models to see if it is related to a firm’s plan asset allocation. If the investment horizon is longer, firms invest their plan assets in stocks. Therefore, when a firm uses ERR for earnings management, it is expected that the correlation between investment horizon and ERR is negative.
H7: Firms with shorter investment horizons adopt higher ERRs to reduce the amount of defined benefit cost for the period.
(8) Discount Rate (DR)
As explained in Section 2, IAS19, as revised in 2011, requires firms to use discount rates to calculate return on plan assets, because it would be difficult to determine the return in an objective way, and firms might make discretionary decisions on setting ERRs (IAS19, par BC78). Under Japanese accounting standards, the discount rate is determined based on yields on safe and secure long bonds. These include government bonds, government agency securities, and high-grade corporate bonds (ASBJ Statement 26, par.20). Japanese listed firms tend to set their ERRs higher than their discount rates. However, if we compare the movement of yields on Japanese government bonds with that of average ERR, they are similar. Decreasing a discount rate increases the amounts of PBO and service cost. If a firm attempts to reduce the negative effect of retirement benefits on their financial statements, it would be better to adopt a high discount rate, and an ERR that is higher than the discount rate. Therefore, firms might make reference to discount rates to determine their ERRs, and control the amount of defined benefit cost.
H8: Firms with higher discount rates adopt higher ERRs. (9) Other Variables
Market benchmarks of stocks and bonds (JSTOCK and JBOND), firm size (SIZE), industry classification (Industry), and year dummy variables (Year) are added to our models. The ERR is determined based on investment portfolio, management performance in the past, management policy, and the market for plan assets that firms hold (ASBJ Guidance 25, par.25). The allocation of plan assets is different in each firm; however, market benchmarks can be an important indicator for firms to set their ERRs and also for investors to judge if firms determine their ERRs appropriately. As shown in Figure 1 in Section 3, market benchmarks for securities fluctuate widely every year. In practice, firms tend to refer to past 3- to 5-year plan asset management yields to determine their ERRs. Therefore, 5-year average yields on Japanese stocks and bonds are employed for this model. Other variables are included as general control variables.
6. Empirical Evidence
This empirical analysis is based on fourteen years of annual report data. The time period of this study is from fiscal 2001 (one year after the Accounting Standard for Retirement Benefits was introduced) through the latest year, fiscal 2014, for which data are available. Fiscal year 2000 was excluded, owing to the impact from changes in accounting standards for retirement benefits and financial instruments on a firm’s financial statements for the year. Firms included in this research design exclude banks and insurance firms. Table 1 in Section 3 shows the number of firms selected that set ERRs and disclose plan assets. A
Table 5. Descriptive Statistics for the Effect of Pension Components and Other Financial Statement Factors on ERR
ERR LEV OPI CASH TAX FUND DBSIZE HORIZON DR SIZE JSTOCK JBOND
Mean 2.188 1.658 0.059 0.058 0.368 0.580 -1.072 1.261 2.045 4.900 2.402 2.843
Median 2.000 1.025 0.052 0.058 0.409 0.564 -1.043 1.277 2.000 4.808 2.756 2.050
Min -3.300 -34.764 -0.285 -1.311 -74.626 0.000 -2.973 -0.311 0.150 3.275 -8.660 0.832
Max 10.900 83.731 0.419 1.730 96.900 4.490 0.140 2.666 8.560 7.232 15.176 11.544
Std. Dev. 1.141 2.597 0.044 0.059 2.093 0.279 0.352 0.198 0.658 0.612 7.697 2.682
ERR=expected rate of return on plan assets, LEV=(total liabilities-defined benefit liability)/(net assets+total unrecognized obligations), OPI=(operating income+defined benefit cost)/the average amount of total assets for the period t-1 and t, CASH= (cash flow from operating activities-increase(decrease) in provision for retirement benefits)/the average amount of total assets for the period t-1 and t, TAX=(income taxes+defined benefit cost*40%)/(net income before taxes+defined benefit cost), FUND =plan assets/PBO, DBSIZE=natural logarithm of PBO, HORIZON=natural logarithm of (PBO/service cost), DR=discount rate, SIZE=natural logarithm of total assets, JSTOCK=5-year average market benchmark rate of return on Japanese stocks, JBOND= 5-year average market benchmark rate for return on Japanese bonds
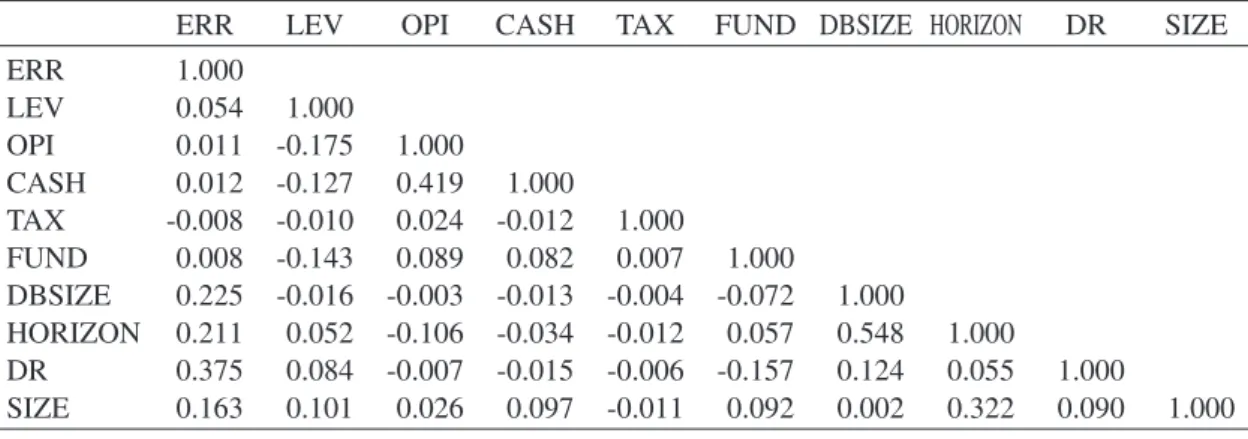
Table 6. Correlation for the Effect of Pension Components and Other Financial Statement Factors on ERR
ERR LEV OPI CASH TAX FUND DBSIZE HORIZON DR SIZE
ERR 1.000 LEV 0.054 1.000 OPI 0.011 -0.175 1.000 CASH 0.012 -0.127 0.419 1.000 TAX -0.008 -0.010 0.024 -0.012 1.000 FUND 0.008 -0.143 0.089 0.082 0.007 1.000 DBSIZE 0.225 -0.016 -0.003 -0.013 -0.004 -0.072 1.000 HORIZON 0.211 0.052 -0.106 -0.034 -0.012 0.057 0.548 1.000 DR 0.375 0.084 -0.007 -0.015 -0.006 -0.157 0.124 0.055 1.000 SIZE 0.163 0.101 0.026 0.097 -0.011 0.092 0.002 0.322 0.090 1.000
sample of 21,053 firms for fourteen years is identified. Financial data used in this study were collected from Nikkei Economic Electronic Databank System (2015) which is provided by the Nikkei Digital Media, Inc.
Table 5 shows the descriptive statistics for the effect of pension components and other financial statement factors on the determination of ERR. The correlation coefficients for the variables are shown in Table 6. There is a relation between DBSIZE and HORIZON, because (a) when a firm’s average service life of employees is longer than that at other firms, and (b) other conditions including the number of employees, employees’ salaries or discount rate are similar to those at other firms, the PBO would be larger. However, to test the variance inflation factors on all independent variables in this model, there is no multicollinearity recognized.
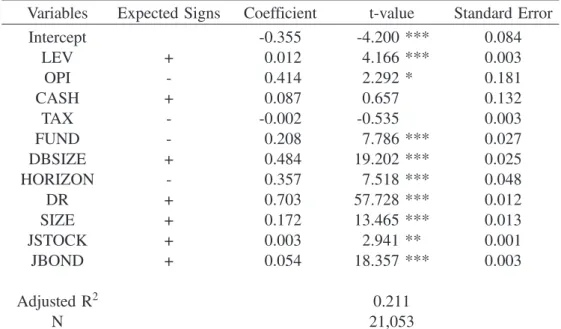
The result of the panel data analysis is shown in Table 7. It indicates that cash flow from operating activities and tax-paying status do not have an effect on the determination of ERR. On the other hand, leverage and operating income have positive coefficients and are significant. As for operating income, when a firm increases the ERR, this change decreases defined benefit cost, which is included in operating income. However, the sign (plus or minus) for operating income is opposite to what is expected, which indicates that firms which recognize higher operating income tend to choose higher ERRs. Leverage has the expected coefficient sign, which indicates that firms with high leverage adopt high ERRs. Pension is defined as future payment of employees’ salaries. Plan assets should be managed with consideration of future risks over a long time-span, owing to the significant effect of defined benefit liability on the balance sheet. Firms appear to consider their financial condition and increase the ERR to reduce the defined benefit cost, and thereby lessen the impact of the volatility in securities markets that affects the return on plan assets. FUND has the opposite sign from what is expected. Firms which manage employees’ retirement benefits set their ERRs higher. These results reveal that Japanese listed firms consider their financial condition in setting their ERRs.
Table 7. The Effect of Pension Components and Other Financial Statement Factors on ERR
Variables Expected Signs Coefficient t-value Standard Error
Intercept -0.355 -4.200 *** 0.084 LEV + 0.012 4.166 *** 0.003 OPI - 0.414 2.292 * 0.181 CASH + 0.087 0.657 0.132 TAX - -0.002 -0.535 0.003 FUND - 0.208 7.786 *** 0.027 DBSIZE + 0.484 19.202 *** 0.025 HORIZON - 0.357 7.518 *** 0.048 DR + 0.703 57.728 *** 0.012 SIZE + 0.172 13.465 *** 0.013 JSTOCK + 0.003 2.941 ** 0.001 JBOND + 0.054 18.357 *** 0.003 Adjusted R2 0.211 N 21,053
All pension components are positive and significant. When the size of a firm and the defined benefit plan are larger, the firm tends to adopt a higher ERR. Adopting higher ERRs can decrease the amount of defined benefit cost. At the same time, it can be said that when a firm and the defined benefit plan are large, a firm can achieve economies of scale for plan asset management. As for investment horizon, the coefficient has a positive sign, which indicates that firms with relatively younger workforces set their ERRs higher. The variable for the discount rate has the expected sign. The level of discount rate is strongly related to the level of ERR. As explained in Section 3, firms tend to set their ERRs higher than the discount rate. When a firm sets its ERR higher than the discount rate, it reduces the amount of defined benefit cost. This result shows that firms adopting higher discount rates also set their ERRs higher. Therefore, there is a possibility that firms control the amount of defined benefit cost to reduce the volatility in defined benefit cost. When there is a difference between actual rate and expected rate, firms can adopt deferred recognition and equalize the cost. Adopting deferred recognition also reduces the volatility in defined benefit cost. The market benchmark rates of return on Japanese stocks and Japanese bonds are important factors for determining a firm’s ERR. The accounting standards require firms to set their ERRs based on the information related to their plan assets and economic circumstances, and this result shows that firms follow the standards.
7. Summary and Conclusion
Accounting standards for retirement benefits allow firms to adopt two distinct accounting methods, deferred recognition for actuarial gains and losses and the principle of changes in actuarial assumptions. These accounting methods make the accounting standards difficult to understand for financial statement readers. One reason why these accounting methods are adopted appears to be the significant effect of the change in actuarial assumptions on the amount of defined benefit obligations and defined benefit cost. As explained above, Okumura (2005) states that if a firm increases the discount rate one percentage point under certain conditions, defined benefit obligations will drop by 23%. The actuarial assumptions are affected by social and economic circumstances which cannot be controlled by firms.
This paper aimed to discover if pension components and other financial statement factors have any effect on the determination of the ERR. The result shows that leverage has an effect on the determination of ERR. As for pension components, the coefficient for the discount rate has the expected sign. There is a possibility that firms setting their discount rates higher adopt higher ERRs, and control the amount of defined benefit cost for the period. This outcome indicates that firms set their ERRs with consideration of their financial condition, and equalize the amount of defined benefit cost for each period to reduce the volatility in the calculation of PBO and plan assets. The ERR is set based on a firm’s
information related to plan assets. As the IASB states, it is difficult to determine the rate in an objective way. Japanese listed firms have tended to set their ERRs higher than discount rates; however, the movement of these rates has been similar. Understanding the pension components in footnotes helps financial statement users to judge if the ERR is appropriate.
This research can be expanded further. This paper aimed to reveal whether the level of leverage, ROA, cash flow, and tax-paying status affected the level of ERR. It can be also analyzed whether changes in these variables affect changes in ERR. As shown in Table 3 in Section 3, most firms do not change their ERRs every year. It may be useful to categorize firms into three categories — firms increasing ERRs, those with no change, and those decreasing ERRs — and analyze the effect of changes in other financial statement factors on the changes in ERRs.
In Japan, new accounting standards, ASBJ Statement 26 and ASBJ Guidance 25 have been adopted since fiscal 2013. Under the new accounting standards, firms are required to disclose the allocation of plan assets and actual return on plan assets as items related to plan assets in footnotes. These items might be important for predicting the ERR. Therefore, including these new disclosure items as independent variables in the model might help to explain the ERR.5
Moreover, the IASB and Financial Accounting Standards Board (FASB) require firms to disclose their plan asset allocation with more detailed categories. The more detailed information should allow financial statement users to predict the ERR properly, because the rates of return on foreign securities are much higher than those on domestic ones in Japan.
FASB Statement of Financial Accounting Standards No.132R: Employers’ Disclosures about Pensions and Other Postretirement Benefits (SFAS132R) became effective from December 2003. Firms tended to categorize their plan assets into fewer than the four categories Japanese firms currently disclose under SFAS132R. In December 2008, FASB issued FASB Staff Position No.FAS132(R)-1: Employers’ Disclosures about Postretirement Benefit Plan Assets (FSP FAS132(R)-1). It is effective for fiscal years ending after December 15, 2009. The Position states that firms disclose their pension plans and other postretirement benefit plans at the fair value of each major category of plan assets. The major categories include cash and cash equivalents; equity securities (segregated by industry type, company size, or investment objective); debt securities issued by national, state, and local governments; corporate debt securities; investment funds; and real estate (FSP FAS132 (R)-1, par.9). There are about 35 Japanese listed firms adopting SFAS in each year from 2003 to 2014. Therefore, using these firms as samples, it is possible to analyze the data in chronological order after the firms disclose their plan asset allocation. We also can test
whether the detailed information provide more useful information for financial statement users after fiscal 2009.
As for IAS19, the revised IAS19 has been adopted since fiscal 2013. The sample number will not be sufficient for performing empirical research to examine whether the detailed information has an effect on the determination of ERRs, since currently only around 70 firms adopt IFRS in Japan. However, IAS19 also requires firms to disclose sensitivity analysis on the ERR and discount rate. Therefore, analyzing the information provided by IAS19 and SFAS132R would be helpful for understanding if it is useful for investor decision-making.
Table 4 in Section 3 showed the effect of pension components on financial statements. It indicates that pension components had some effects on both the balance sheet and income statement. The effect of defined benefit liability on total liabilities was especially significant, and the rates ranged from 8% to 19%. Actuarial assumptions have an important role to play in calculating the pension components of PBO, plan assets, defined benefit liability, and defined benefit cost. The assumptions are strongly influenced by securities markets that reflect social and economic circumstances, and have high uncertainty and volatility. This paper indicates that firms set their ERRs depending on their financial condition; therefore, it is important to disclose detailed information related to the ERRs to maintain objectivity.
References
Accounting Standards Board of Japan (2012). ASBJ Guidance No.25: Guidance on Accounting Standard for Retirement Benefits, Tokyo: ASBJ.
Accounting Standards Board of Japan (2012). ASBJ Statement No.26: Accounting Standard for Retirement Benefits, Tokyo: ASBJ.
Adams, B., M. M. Frank, and T. Perry (2011). “The Potential for Inflating Earnings through the Expected Rate of Return on Defined Benefit Pension Plan Assets,” Accounting Horizons, Vol.25, No.3, pp.443-464.
Amir, E., Y. Guan, and D. Oswald (2010). “The Effect of Pension Accounting on Corporate Pension Asset Allocation,” Review of Accounting Studies, Vol.15, No.2, pp.345-366.
Asthana, S. (1999). “Determinants of Funding Strategies and Actuarial Choices for Defined-Benefit Pension Plans,” Contemporary Accounting Research, Vol.16, No.1, pp.39-74.
Bauman, M. P. and K. W. Shaw (2014). “An Analysis of Critical Accounting Estimate Disclosures of Pension Assumptions,” Accounting Horizons, Vol.28, No.4, pp.819-845.
Bergstresser, D., M. Desai, and J. Rauh (2006). “Earnings Manipulation, Pension Assumptions, and Managerial Investment Decisions,” The Quarterly Journal of Economics, Vol.121, No.1, pp.157-195. Blankley, A. I. and E. P. Swanson (1995). “A Longitudinal Study of SFAS87 Pension Rate Assumptions,”
Accounting Horizons, Vol.9, No.4, pp.1-21.
Business Accounting Council (1998). Accounting Standard for Retirement Benefits, Tokyo: BAC.
Chuk, E. C. (2013). “Economic Consequences of Mandated Accounting Disclosures: Evidence from Pension Accounting Standards,” The Accounting Review, Vol.88, No.2, pp.395-427.
Comprix, J. and K. A. Muller (2006). “Asymmetric Treatment of Reported Pension Expense and Income Amounts in CEO Cash Compensation Calculations,” Journal of Accounting & Economics, Vol.42, No.3, pp.385-416.
Feldstein, M. and R. Morck (1983). “Pension Funding Decisions, Interest Rate Assumptions, and Share Prices,” in Financial Aspects of the United States Pension System, eds. Bodie, Z. and J. B. Shoven, pp.177-207, Chicago: University of Chicago Press.
Financial Accounting Standards Board (2008). FASB Staff Position No.FAS132(R)-1: Employers’ Disclosures about Postretirement Benefit Plan Assets, Norwalk, CT: FASB.
Financial Accounting Standards Board (1997). Proposed Statement of Financial Accounting Standards: Employers’ Disclosures about Pensions and Other Post-Retirement Benefits, Norwalk, CT: FASB. Financial Accounting Standards Board (1985). Statement of Financial Accounting Standards No.87:
Employers’ Accounting for Pensions, Norwalk, CT: FASB.
Financial Accounting Standards Board (1990). Statement of Financial Accounting Standards No.106: Employers’ Accounting for Postretirement Benefits Other Than Pensions, Norwalk, CT: FASB.
Financial Accounting Standards Board (1998). Statement of Financial Accounting Standards No.132: Employers’ Disclosures about Pensions and Other Postretirement Benefits, Norwalk, CT: FASB. Financial Accounting Standards Board (2003). Statement of Financial Accounting Standards No.132R:
Employers’ Disclosures about Pensions and Other Postretirement Benefits, Norwalk, CT: FASB. Financial Accounting Standards Board (1998). Statement of Financial Accounting Standards No.158:
Employers’ Accounting for Defined Benefit Pension and Other Postretirement Plans, Norwalk, CT: FASB.
Godwin, J. H., S. R. Goldberg, and J. E. Duchac (1996). “An Empirical Analysis of Factors Associated with Changes in Pension-Plan Interest-Rate Assumptions,” Journal of Accounting, Auditing & Finance, Vol.11, No.2, pp.305-322.
Gopalakrishnan, V. and T. F. Sugrue (1995). “The Determinants of Actuarial Assumptions under Pension Accounting Disclosures,” Journal of Financial and Strategic Decisions, Vol.8, No.1, pp.35-41.
International Accounting Standards Board (2011). International Accounting Standard No.19: Employee Benefits (revised), London: IASB.
Kasaoka, E. (2015). “The Determinants of Discount Rates on Retirement Benefits in Japan,” International Review of Business, No.15, pp.45-80.
Lew, Jei-Fang (2009). “Pension Actuarial Incentives for Earnings Management,” Asia Pacific Management Review, Vol.14, No.3, pp.313-334.
Li, Y. and P. Klumpes (2013). “Determinants of Expected Rate of Return on Pension Assets: Evidence from the UK,” Accounting and Business Research, Vol.43, No. 1, pp.3-30.
Newell, G. E., Jerry G. K., and D. Hurtt (2002). “Corporate Pension Plans: How Consistent are the Assumptions in Determining Pension Funding Status?” American Journal of Business, Vol.17, No.2, pp.23-30.
Okumura, M. (2005). “Discretion in the Choice of Pension Discount Rate, Projected Benefit Obligation and Stock Price,” The Waseda Commercial Review, No.404, pp.27-49.
Pension Fund Association, “The Survey and Comment on Plan Asset Management,” http://www.pfa.or.jp/ activity/tokei/shisanunyo/jittai/index.html (accessed 12-10-2015).
Vuong, Q. H. (1989). “Likelihood Ratio Tests for Model Selection and Non-Nested Hypotheses,” Econometrica, Vol.57, No.2, pp.307-333.