REFEREED ARTICLE
Reasonable Spatial Layout of Future Allotment Gardens
Based on Beijing City Master Plan and Citizen Opinion
Meng YE, Tomohiko YOSHIDA
Abstract
This study aims to examine the reasonable location layout and appropriate service radius of allotment gardens from both macro and micro aspects based on Beijing City Master Plan (2016-2035) and opinions of Beijing citizens, so as to maximally meet the public s requirements for travel distance and travel time from the home to the allotment garden, which can provide policy guidance for scientific and rational planning and construction of allotment gardens in developing countries undergoing similar rapid urbanization like China. The future Beijing allotment gardens should be built in urban function extended districts of the main city and Tongzhou District of new districts of urban development . There are two specific locations: non-centralized construction land of green isolated area in Haidian District, Fengtai District and Shijingshan District, encircling 10 edge groups or the periphery of the central area, and the urban green heart area of Tongzhou District. Urban functional zones and travel mode preference determine the different service radii of allotment gardens. The equitable service radii of allotment gardens located in urban function extended districts and new districts of urban development are 2-7.65 km and 1-3.5 km, respectively, and the corresponding travel time is controlled at 10-30 min and 23.75 min, separately. In terms of travel mode preference, walking is the most ideal way, followed by cycling, and driving. Allotment gardens should be accessible to within the scope of 1.12 km by walking, 2.97 km by cycling, and 5-27.5 km by driving, and the corresponding travel time ought to be respectively controlled at 17.84 min, 10-30 min, and 30-60 min.
Keywords: allotment garden, location layout, service radius, Beijing City Master Plan, citizen opinion
1. Introduction
An allotment garden (abbreviated hereafter as AG) refers to a form of urban agricultural production and management in which urban residents rent small-scale agricultural land on the outskirts of the city, participate in cultivation activities (Fukami & Nakamura, 2016; Da Silva et al., 2016; Guitart et al., 2012; He & Zhu, 2018) or non-commercial gardening activities (Colding et al., 2006), enjoy the pleasure of labor, and harvest agricultural products. AGs are commonly known as urban small vegetable gardens, happy farms, and happy gardens in China, and generally emphasize citizens participation in agricultural production, as well as access to tangible agricultural products and intangible agricultural experiences. AGs are the entities that bring green and natural landscapes and farming civilizations, which can meet urban residents growing needs of food safety, reconnection with nature (Ricci & Conrad, 2018), nature education (Okvat & Zautra, 2011), leisure (Kiesling & Manning, 2010; Van den Berg, 2010), social cohesion (Soga et al., 2017), and other spiritual pursuits (Milligan et al., 2004; Bowker & Tearle, 2007; Partalidou
& Anthopoulou, 2017; Holland, 2004), as well as improve people s happiness index and the quality of leisure life (Hynes & Howe, 2009) while also alleviating troubles caused by urban diseases. The AGs that have emerged recently in China are mainly based on operational modes of enterprises and individuals, providing short-term (a natural
year-based) and small-sized land rent and related services. A rented unit, called a share plot, is usually 33.34 m2
or
66.67 m2
. Citizens subscribe to share plots as a consumer member of the AG and grow ecological agricultural products that meet their needs̶which is the main activity̶and at the same time combine with other needs such as farming experience, weekend leisure, social interactions, and real-time consumption on the farm.
The research on AGs generally focuses on their development processes and driving forces (Guitart et al., 2012; Scheromm, 2015), functions and benefits (Torres et al., 2018; Sugiyama et al., 2018; Cabral et al., 2017; Egli et al., 2016; Filkobski et al., 2016), business models and development strategy (Yuan, 2016; Zhou, 2007; Shao et al., 2012), etc. Regarding the location layout of AGs, the Beijing AG should choose an area closer to urban settlements. It is best to choose a suburban location that is a one-hour drive from a large urban community, or is accessible by public transportation, because the frequency of members arriving at the farm for plantation is relatively high (Chen, 2018). The location of AGs should be based on the principle of facilitating the residents cultivation activities. The mode of combining AGs with residential areas is appropriate, in which the green space and the vacant land on the side of the house are the most desirable places in which to develop community gardens for residents within the Sixth Ring Road of Beijing (Wang et al., 2017). In the countermeasures for the development of Beijing s AGs, it is proposed to combine the future urban development planning, and tentatively set aside certain areas in the return to green area of the second green belt to construct qualified AGs, creating the pastoral in the city , making it a paradise for the interaction between the citizens and the peasants, and a new type of park that is edible in the city (Zhao, 2017). Most of the literature on service radius of urban green space discusses the accessibility and proximity, and points out that swift and easy access to semi-natural spaces in and around the city should be taken into account in future planning actions because perception of distance to travel is the main reason for infrequent visits to them (Žlender & Tompson, 2017) Distance or walking time from home has been shown in many studies as the single most important precondition for use of green spaces (Van Herzele & Wiedemann, 2003; Giles-Corti et al., 2005). Some recent literature adopts GIS based indicators to evaluate residents accessibility to urban greenspaces (Stessens et al., 2017; Gupta et al., 2016), which has practical implications for urban planning because specific land uses might be chosen for highly accessible open spaces, especially those characterized by a high proximity to residential settlements, including allotment gardens and other informal green areas (La Rosa, 2014). The common calculation methods for the accessibility of urban park green space are buffer zone, minimum distance, travel cost, and gravity index, among which the travel cost method uses network distance in order to characterize the distance from the residential area to the nearest green space, which is closer to the actual travel distance of the residents. Travel distance is also a simple and effective way to measure travel cost (Chen et al., 2014). The common methods for calculating the service radius of park green space listed above each have their own limitations. Therefore, when calculating the service radius of park green space, some parameters of the service radius calculation method should be determined by means of questionnaires. The classification criteria of results should be calculated̶and the results of service radius calculation should be tested̶so as to ensure that the service radius calculation is rational and scientific (Tong et al., 2013). A research based on questionnaire survey of 19 allotment gardens in Japan analyzed the user radius of allotment gardens for the aged, and concluded that the average distance from users home to the gardens (user radius) was 1,280 meters, ranging from 316 m to 2,322 m, and there was a negative correlation between user radius and residential density within 1 km of the garden (Miyake & Matsumoto, 1997).
academic circles, and furthermore there is practically no literature on the service radius of AGs, which is critical for urban planning, greenspace management and decision making. The current research only proposed that the location of AGs should be based on the principle of being closer to urban settlements, whereas it did not provide a detailed plan and a specific distance from the home to the AG. Moreover, in terms of the methods employed for analyzing the accessibility to and service radius of urban green space, aforementioned literature chiefly used remote sensing technology and GIS-based methods to quantify the service radius, leading to a dearth of qualitative research. On account of this, in order to make up for the gaps in current research, the purpose of this study is to examine the reasonable locations of AGs from the macroscopic view, based on the overall urban planning of Beijing and the opinions of Beijing citizens, and to further determine the appropriate service radii of AGs in light of citizens opinions so as to meet the public s requirements for travel distance and travel time from the home to the AG as much as possible, within the scope of the city s master plan permit. This study can provide advice and guidance for policy makers regarding the scientific and rational planning of the layout and service radius of AGs in developing countries which undergoing similar rapid urbanization like China.
2. Research Methods and Study Area
2.1. Research Methods
The data used in this paper are from the Beijing City Master Plan (2016-2035)1
(hereinafter referred to as Master Plan) and questionnaires from 202 Beijing citizens. The questionnaire survey aims to obtain the ideal location and ideal service radius of AGs in Beijing from the perspective of its citizens. First, the Master Plan was used to analyze the urban spatial structure of Beijing. Second, the terms of the Master Plan̶which involve the development of AGs (including urban greening, ecological development, urban agriculture, etc)̶were selected and further analyzed so that the appropriate locations of AGs could be determined macroscopically. Third, the questionnaire survey of 202 Beijing citizens was used to examine the ideal location of AGs in the hearts of the citizens, and further integrated with the result of the AG s layout that was analyzed from the Master Plan. Finally, the service radius of the AG was determined at the micro level. The questionnaires from 202 Beijing citizens were mainly used to determine the different service radii of AGs, according to Beijing s functional zones and the preference of citizens travel modes. This paper believes that when calculating the service radius of AGs, a questionnaire is the preferred method with which to obtain citizens ideal service radius, because it will provide the relevant planning departments with a real voice from the public. The relevant departments will combine citizens opinions with urban land use in order to perform on-site selection for AGs, fully promoting the spirit of democracy and serving the people, thus being more scientific and reasonable.
Regarding the method of processing the data on citizens ideal travel time and ideal travel distance that were obtained by the questionnaire, this study used arithmetic mean, median, first quartile, third quartile, and the interquartile range of the descriptive statistical analysis, which could all be presented simultaneously in a box-plot, in order to make the description of the data more comprehensive and accurate. The reasons for this are as follows. The arithmetic mean is a measure of the average size of the dataset with certain applicable conditions. The dataset must satisfy the condition of central single peak ̶that is, the unique peak of the dataset must be roughly in the middle of the dataset. Therefore, using the arithmetic mean to analyze the characteristics of the dataset has inevitable drawbacks: it is insensitive to outliers, and is susceptible to distortion due to interference from outliers far away from the center position. Based on this defect of arithmetic mean, this study also introduced the median, the first
quartile (Q1), the third quartile (Q3), and the interquartile range (IQR) when analyzing the data. The IQR concentrates 50% (i.e. 25%-75%) of the data, reflecting the concentration of the data. A graph that can simultaneously present the mean, median, quartiles, upper edge (max), and lower edge (min) is the box-plot, which is used to display the dispersion of dataset. Its advantage is that it can identify data outliers (which are defined as values less than Q1-1.5IQR or greater than Q3+1.5IQR); comprehensive description of dataset features; rapid comparison of basic features of different datasets; and has strong resistance to datasets that do not strictly follow a normal distribution.
2.2. Study Area
The study area is Beijing, the capital of China, which is located in northern China, and is governed as a municipality under the direct administration of central government, with 16 municipal districts. The geographical
coordinates of Beijing are east longitude 116°23 , north latitude 39°55 . It has a total area of 16,411 km2
, of which the
plain area is 6,338 km2
, accounting for 38.62%, and the mountainous area is 10,072 km2
, accounting for 61.37%. The west, north, and northeast of Beijing are all surrounded by mountains, and the southeast is a large plain that slopes slowly toward the Bohai Sea. In 2017, the population was 21.77 million and the population density was 1,323 person /
km2
.
The current administrative divisions of Beijing Municipality consist of the main city and the outer suburbs. The main city̶namely, the main urban area̶is composed of six municipal districts, also known as the six city districts.
The total area of the six districts is 1377.82 km2
. Among the six city districts, Dongcheng District and Xicheng District belong to the central city, also known as the old city, while the other four districts belong to the peri-urban areas, including Haidian District, Chaoyang District, Fengtai District, and Shijingshan District. The outer suburbs are composed of 10 municipal districts, namely Tongzhou District, Daxing District, Fangshan District, Mentougou District, Changping District, Shunyi District, Pinggu District, Miyun District, Huairou District, and Yanqing District. The narrow sense of Beijing only refers to its urban area, which is about the scope of the six city districts, while the broad sense of Beijing refers to Beijing Municipality, under the jurisdiction of the Beijing Municipal Government, including the outer suburban districts. In this study, Beijing refers to Beijing in a broad sense.
3. Beijing Urban Spatial Structure and the Spatial Layout of AGs
3.1. Beijing Urban Spatial Structure
According to urban spatial structure, the municipal districts of Beijing are divided into four layers, which are called the functional zones. From the inside to the outside, they are the core districts of capital function (CDCF), urban function extended districts (UFED), new districts of urban development (NDUD), and ecological preservation development districts (EPDD), as shown in Figure 1. The relationship between the administrative divisions of Beijing Municipality and the functional zones of Beijing Municipality is shown in Figure 2. The main urban area, namely the six city districts, is composed of CDCF and UFED, while the outer suburbs consist of NDUD and EPDD. CDCF is equivalent to the central city, and UFED is equivalent to the peri-urban area.
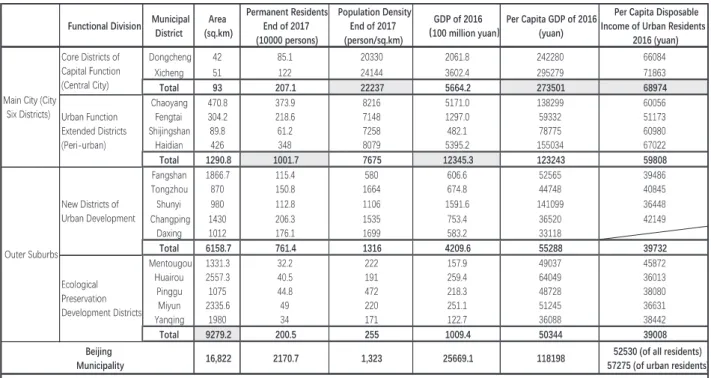
The basic situation of the functional zones of Beijing is presented in Table 1. EPDD has the largest area of
9,279.2km2
, followed by NDUD, UFED, and CDCF. Although CDCF has the smallest area, it has the highest
population density at 22,237 person/km2
, followed by UFED, NDUD, and EPDD. However, from the perspective of permanent residents, the population is basically concentrated in UFED and NDUD, while CDCF doesn t have many
Figure 1 Administration Divisions and Functional Zones of Beijing Municipality
Figure 2 Relationship between Beijing Administration Divisions and Beijing Functional Zones
Yanqing Huairou Miyuan Pinggu Changping Shunyi Mentougou Tongzhou Fangshan Daxing
Six City Districts Outer Suburb District Boundary of Beijing HaidianChaoyang
Fengtai
Legend
Administrative Divisions of Beijing Municipality
Core Districts of Capital Function Ecological Preservation Development Districts New Districts of Urban Development District Boundary of Beijing
Urban Function Extended Districts
Legend
permanent residents and ranks third among the four functional divisions. The reason for this is that, since 2011, Beijing has adjusted its overall urban planning and has been removing the population of CDCF to the peripheral areas. NDUD has witnessed an increase in regional population because it took a large population from CDCF as the CDCF s primary population evacuation site. In terms of the GDP of 2016, UFED has the largest total GDP, followed by CDCF, NDUD, and EPDD. In other words, UFED and CDCF are the primary contributors to Beijing s economy. As for the per capita GDP and the per capita disposable income of urban residents in 2016, people living in CDCF have the highest standard of living, followed by UFED, NDUD, EPDD.
In summary, CDCF at present is the most densely populated area among the four functional zones of Beijing, and also has the highest per capita GDP and per capita disposable income; UFED has the largest number of permanent residents and the largest total GDP; and, relatively speaking, NDUD and EPDD are small in resident population, low in population density, and backward in economic development, as well as the living standard of its residents, but it is still very large in area. Research on the locational distribution of allotment gardens in Osaka Prefecture shows that AGs are prone to be located in areas with a medium-sized population density, rather than areas with the highest population density (Ye & Yoshida, 2018). From this point of view and combined with the actual situation of the four functional zones in Beijing, UFED is the most suitable area for building future AGs.
In order to implement the city s strategic positioning, remove non-capital functions, govern big city diseases, and achieve sustainable development in the future, the Communist Party of China (CPC) Beijing Municipal Committee and Beijing Municipal Government issued and implemented the Beijing City Master Plan (2016-2035) in September,
2017, which proposed the urban spatial structure of one core, one main, one auxiliary, two axes, multiple points and one area within Beijing, focusing on changing the single-center agglomeration development mode and building new urban development. Figure 3 shows the Beijing urban spatial structure planning map in the Master Plan. One core
refers to CDCF, with an area of 92.5 km2
; one main refers to the main city, the six city districts, including CDCF
and UFED, with an area of about 1,378 km2
; one auxiliary refers to the Beijing city sub-center, of which the planning scope is the original Tongzhou New Town Planning and Construction Area, with a total area of about 155
km2
; two axes refer to the central axis and its extension line, as well as Chang an Street and its extension line. The central axis and its extension line are the traditional central axis and its north-south extension. Chang an Street and its extension line extend to the east and west, with Tiananmen Square as its center; multiple points are five new towns located in the plain area, including Shunyi, Daxing, Yizhuang, Changping, and Fangshan New Towns, which are key areas in which to undertake suitable functions and population evacuation of the central city; and, finally, one area refers to EPDD, which is the oxygen bar of Beijing and a crucial area with which to ensure the sustainable development of the capital.
Based on the Master Plan, the functions and development goals of each functional zone are as follows. CDCF is a core-bearing zone of the national political center, cultural center, and international exchange center, and is the key area for the protection of historical and cultural cities. There are four development goals in CDCF, dominated by maintaining security and stability, protecting the
ancient capital, and orderly removing non-capital functions. UFED is also a science and technology innovation center, apart from a center of politics, culture, and international exchange. It is a key area for building a world-class, harmonious, and livable capital, and also the main area of evacuating non-capital functions. In this area, it is necessary to conduct a decentralized and conglomerated space layout and to strictly control the city scale. Secondly, urban remediation and ecological restoration should be promoted in order to improve urban quality and the ecological level. NDUD includes Beijing city sub-center and new towns and regions in Shunyi, Daxing, Yizhuang, Changping, and Fangshan, which focuses on undertaking the functions and population of the central city and serving the capital. EPDD is an important ecological barrier and water source protection area of the capital, and also a sensitive area for the development of urban and rural integration. The main task of this zone is to realize green development and to build an ecological development demonstration area that is suitable for living, as well as suitable for tourism, for the sake of the ecological
security of the capital. Figure 3 Beijing Urban Spatial Structure Planning Map
3.2. Spatial Layout of AGs Based on the Master Plan
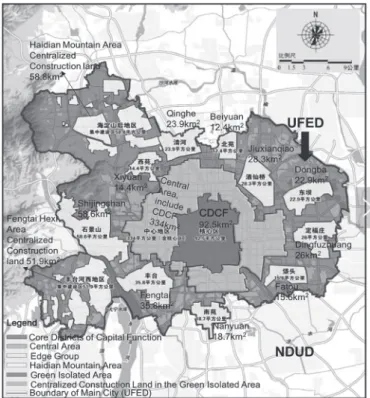
In the Master Plan, there are some provisions related to creating more urban green space and reinforcing ecological construction, from which reasonable and appropriate locations for future AGs can be identified. Table 2 shows the relevant provisions. UFED is the optimal location for setting up AGs for the following reasons. In Article 23, one of the development goals of the main city is to promote urban remediation and ecological restoration so as to improve the urban quality and ecological level in the main city. Articles 25, 26, 27, and 28 also put forward plans to adjust land structures in order to increase the amount of green space, vacating land for adding green space and public space, and adhering to the policy of leave blank and add green in order to strengthen the urban repair in the main city. Based on these provisions, the main city is suitable for setting up AGs, which is composed of CDCF and UFED. However, CDCF primarily exerts the political function of the capital, and is the most densely populated area, where there are limited land resources and high land prices, as explained before. From this point of view, CDCF is not suitable for building AGs, while UFED is the optimal location for opening AGs. In Article 24, the Master Plan describes in detail the spatial layout of the mixed land in the main city, from which the specific space for the development of AGs can be determined. AGs are especially suitable for building in Haidian District, Shijingshan District, and Fengtai District of the UFED, for the reason that ecological and green development goals have been proposed in the land use layout of each of the above three districts. The Master Plan proposes that Haidian District should be built into an ecological, livable, harmonious, and civilized demonstration zone, as well as a practical zone of high-level new urbanization development. Shijingshan District should be built into a national-level industrial
transformation and development demonstration zone, a green low-carbon comprehensive service area, and an ecologically livable demonstration zone, with a combination of landscape and culture. Fengtai District should be built into a new urbanization development zone led by green ecology, and the environmental construction investment ought to be strengthened in the southern region, which Fengtai District belongs to. Figure 4 displays the spatial structure planning map of the main city, from which the best locations for AGs in Haidian District, Shijingshan District, and Fengtai District can be further analyzed. As shown in Figure 4, the main city comprises the central area (including CDCF), 10 edge groups, centralized construction regions in the Haidian mountainous area and the Fengtai Hexi area, and a green isolated area, namely the greenbelt. Generally speaking, the urban fringe area is a regional entity formed by the development of the city to a certain stage. It is an urban-rural transition zone in which the mutual
penetration of urban and rural areas, the rapid development of urbanization, and the sharp contradiction between urban and rural areas happen, and its natural, economic and social characteristics are between typical cities and typical rural areas (Zhao, 1992). The edge group refers to a large residential area on the edge of the city̶the urban fringe̶formed by the population gathering (An and Shen, 2017). In this paper, it is a relative concept and is a fringe area relative to the central city of Beijing. The significance of the existence of edge group in the Master Plan is that it bears the function of the transitional area of population evacuation. Because it takes a long way to evacuate the population of the central city to the Tongzhou District̶Beijing city sub-center̶and the other nine outer suburbs, in the process of population evacuation, the population of the central city is first evacuated to the 10 edge groups, which is the reason for the formation of these 10 edge groups. The 10 edge groups generally form residential areas where a large number of citizens live. Therefore, AGs can be set up around these 10 edge groups. CDCF is the most densely populated area, followed by the central area without CDCF. AGs can also surround the periphery of the central area to be set up. The green isolated area includes centralized construction land and non-centralized construction land, and the latter is a reasonable location for AGs. In short, the optimal location for future AGs is the non-centralized construction land of the green isolated area of UFED, encircling 10 edge groups and the periphery of the central area.
The second appropriate location for AGs is NDUD, especially Tongzhou District. Tongzhou District is located in the southeast of Beijing, outside the Sixth Ring Road, facing the Chaoyang District and Daxing District in the west, bordering Shunyi District in the north, and bordering Tianjin Mulnicipality and Hebei Province in the south, which is the only administrative district in Beijing that borders both province and municipality. In addition, it is located at the core hub of the Bohai Economic Circle. As early as 2004, Tongzhou became the closest new city to the central city of Beijing, and it officially became the administrative sub-center of Beijing in 2015. Its unique location endows it with
Figure 4 The Spatial Structure Planning Map of Beijing Main City
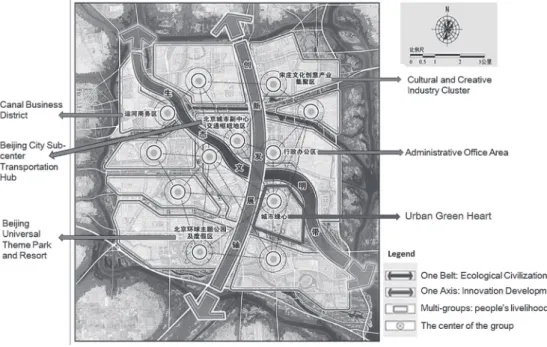
special responsibilities in urban planning and urban development of Beijing, that is, it carries the tasks of regional sustainable development, population relocation from the central city of Beijing, as well as the placement of administrative departments removed from the central city of Beijing. A study indicates that the green space of Tongzhou District is an important part of Beijing s urban green space system and ecological barrier. Therefore, in the process of optimizing the land use structure of Tongzhou District, the proportion of urban green space in the construction land should be appropriately increased, as the green lung needed for urban development, so that the building and the green space can be integrated to form a harmonious urban landscape. At the same time, through the internal adjustment of agricultural land structure, forest land and garden land should be increased on the premise of ensuring the quantity and quality of basic farmland (Sun et al., 2007). Articles 29, 30, 31, 32 of the Master Plan elaborate on the functional positioning and development goal of Tongzhou District. As the main area undertaking the population evacuation of the central city, it will accept 400,000-500,000 permanent residents from the central city by the year of 2035. Consequently, an increase in the population of Tongzhou will spur an exuberant demand for AGs in this area. As the Beijing city sub-center, Tongzhou focuses on building a demonstration zone of a world-class, harmonious, and livable city. It also aims to form an eco-city layout with blue-green intertwined, fresh and bright, along with water city integration and multi-group clustering compact development, forming a spatial structure of one belt, one axis, and multiple groups, as shown in Figure 5, which shows the spatial structure planning map of the Beijing city sub-center. One belt refers to the ecological civilization belt, and three functional nodes are arranged along the canal, including the canal business district, the Beijing city sub-center transportation hub, and the urban green heart.
The urban green heart is an open ecological green space with an approximate area of 11.2 km2
, of which the positioning is not merely a simple green space̶a forest̶but also a civic center, a good source of leisure and entertainment in Tongzhou. In addition, the green space coverage requires more than 70%, and important urban theaters̶as well as other cultural facilities̶will gather here. Therefore, if AGs can be established in the region of the urban green heart, it will increase the green space coverage rate, beautify the urban landscape, and provide
Figure 5 The Spatial Structure Planning Map of Beijing City Sub-center
more diverse leisure and entertainment options for the public, thereby making the urban green heart of Tongzhou into an energetic and unique city landmark. Article 31 proposes the construction of a large-scale green space, the promotion of the common development of city and green, and the conformation of a green spatial structure of two belts, one ring, one heart. The two belts are the ecological green belts, one of which is located between the Beijing
city sub-center and the central city. One ring is a green leisure recreation ring of 56 km2
around the Beijing city sub-center. One heart is the urban green heart mentioned above, in which park green space and a number of public cultural facilities are planned to be constructed, creating a civic center. From this point of view, AGs can be integrated into the park green space for facilitating the daily use of the public, especially for families with small children and the elderly. Families with children can take care of children and use AGs at the same time, while the older group can simultaneously exercise and use AGs as well. There are also some cases of integrating community gardens into urban parks in Seattle, which provides more stability of land tenure for community gardens and make them a more integral part of the contemporary urban landscapes (Hou & Grohmann, 2018). Article 32 brings forward the idea of constructing an eco-friendly city, a livable city, and a national civilized city with a clean, beautiful, and orderly environment in Tongzhou, which needs AGs to play a role therein. Based on the analysis above, in Tongzhou District, AGs can realize a concentrated construction in the urban green heart area or can alternatively be integrated into the park green space for the convenience of public use.
The other districts of the NDUD̶primarily Daxing District, Changping District, and Fangshan District̶are also ideal areas for building AGs, especially AGs with a holiday nature. Articles 36 and 37 raise the development goals for new towns and regions in Shunyi, Daxing, Changping, and Fangshan, which involves creating a livable green city, persisting in ecological conservation and ecological governance collaboration, and building an international tourism and leisure area integrating historical culture and geological heritage. Secondly, these regions place an emphasis on increasing the amount of green space, improving environmental quality, and creating a contiguous green ecological space between urban groups by vacating the inefficient collective construction land outside of the construction area. Additionally, adjusting the agricultural structure, paying more attention to the agricultural ecological function, and improving the level of urban modern agricultural development are also the development tasks in these areas. Based on the regulations above, AGs also have a promising future in Daxing District, Changping District, and Fangshan District of the NDUD.
There are some provisions in the Master Plan that can be deemed as a supplementary explanation for the site selection of AGs. Article 63 proposes the urban development vision in the plains area and the mountainous area. The plains area, which includes the Beijing city sub-center, Shunyi, Yizhuang, and Daxing, is devoted to strengthening the infiltration and integration of the green open spaces inside the urban area and the surrounding countryside, while the areas in front of the maintains, including Fangshan, Changping, and Haidian, aim to form the characteristic style of a pastoral city. Article 98 raises the idea that large-scale green space with rich functionality needs to be interspersed among NDUD and EPDD, forming a large, dense, harmonious, and inclusive urban and rural spatial form. Articles 102, 103, and 104 also explain the aim of increasing the scale of green space and improving the quality of ecological services in the urban fringe, which exists in great amount in NDUD and EPDD. However, EPDD is not suitable for building AGs which can be used daily but is suitable for building AGs that function as a large holiday farm where people can stay for several days, primarily due to the long distance from the densely populated main city, the development goal of ecological conservation, and the mountainous terrain.
In summary, UFED is the optimal location for future AGs, followed by the plains area of NDUD. Comparatively speaking, EPDD and CDCF are not suitable for opening AGs. In UFED, Haidian District, Shijingshan District, and Fengtai District are the optimal places to build AGs, and the specific location is the non-centralized construction land
of the green isolated area, encircling 10 edge groups or the periphery of the central area. In NDUD, Tongzhou District is the foremost area for setting up AGs, which can be intensively constructed in the urban green heart area or integrated into the park green space for the convenience of public use.
3.3. Spatial Layout of AGs Based on Citizen Opinion
An online survey of 208 Beijing citizens was conducted in May and June of 2018, aiming to obtain opinions on their ideal spatial layout of AGs. Regarding the ideal location of AGs, this study divided it into four areas which are basically consistent with the functional zones of Beijing. Location 1 is CDCF, Location 2 is UFED, Location 3 is NDUD and EPDD, and Location 4 is other areas. The views of the respondents on the ideal locations of AGs are shown in Figure 6. There are six respondents coming from EPDD, while the authors removed the data of the six respondents from the analysis in this paper because of the small sample size. Overall, 62.38% of the respondents believed that the ideal location of AGs was UFED; 25.74% of the respondents held that CDCF was the ideal layout location for AGs; and the proportions were very small regarding respondents choosing NDUD, EPDD and other areas as the future ideal layout locations of AGs, 3.47% and 8.42%, respectively. It can be seen from the respondent s point of view that UFED is the most ideal location for AGs, and CDCF is the general location, whereas other areas and NDUD and EPDD are unsatisfactory locations. In terms of the respondent s residential area, 11.88% of the respondents were from CDCF, 72.25% were from UFED, 13.86% came from NDUD. However, regardless of the area in which the respondents lived, a dominant proportion of respondents chose UFED as the ideal layout location for AGs. Specifically, 54.17% of the respondents who lived in CDCF chose UFED as the ideal location for AGs, followed by 33.33% choosing CDCF as the ideal location for AGs. Among the respondents whose home addresses were in the
range of UFED, up to 62% chose UFED as the ideal location for AGs, and 27.33% chose CDCF as the ideal location. Among the respondents who lived in NDUD, up to 71.43% chose UFED as the ideal location for AGs. From this, it can be seen that respondents who live in NDUD most want AGs to be placed in UFED, followed by respondents whose home addresses are in the scope of UFED. The respondents who choose CDCF as the ideal location of AGs basically come from CDCF and UFED. The choice of the ideal location for AGs reflects the principle of proximity layout̶that is, the respondents want the AGs to be located not too far away from their houses in order to facilitate their arrival. It also reflects the fact that respondents selection of the location of AGs is not only based on the principle of proximity layout but also takes into consideration the reality of land use in Beijing, because respondents from non-UFED settlements and UFED residents both state that UFED is the best place for building future AGs, rather than the areas closest to their homes.
In summary, from the perspective of Beijing citizens, UFED is the most ideal location for future AGs, while CDCF is a suitable location, and NDUD and EPDD are not ideal locations. Regardless of the respondents residential areas, a dominant proportion of respondents choose UFED as the most ideal location for AGs. Among them, respondents living in NDUD and UFED most want AGs to be built in UFED.
4. Service Radius of AGs
This study defines the travel distance as the distance from the home to the AG and defines the travel time as the time spent commuting from the home to the AG. The service radius used in this study is the straight-line distance from the home to the AG, equal to travel distance. First, according to the ideal travel distance and ideal travel time given by 202 respondents, their mean, median, Q1, and Q3 were obtained. In terms of ideal travel distance, its mean, median, Q1, and Q3 were 6.16 km, 2 km, 0.5 km, and 6 km; for the ideal travel time, its mean, median, Q1, and Q3 were 29.57 minutes, 21.5 minutes, 10 minutes, and 30 minutes. From this, it can be concluded that most of the respondents hope that the AG can be set up in a place in which the travel distance from the home to the AG is between 0.5, and 6 kilometers, and the travel time is controlled at 10-to-30 minutes.
4.1. Service Radius of AGs Determined by Urban Functional Zones
The residential areas of 202 respondents were divided according to the functional zones of Beijing s urban spatial structure, namely those living in CDCF, UFED, and NDUD. Living in different residential areas will lead to different ideal travel distances and ideal travel times, which will affect the service radius of the AG. Therefore, the mean, Q1, Q3, and median of ideal distance were respectively calculated according to the ideal travel distance provided by the respondents who were grouped based on their residential area (urban functional zones). The box-plot of the ideal travel distance based on living area is shown in Figure 7.
The mean of the ideal travel distance of respondents living in CDCF was 8.26, and its median was 2, which represents a huge gap between mean and median, indicating that the mean could not represent the average level of this group of data. The Q1 and Q3 were 0.28 and 10, respectively, indicating that 50% data of the CDCF group was concentrated in 0.28 to 10. IQR was 9.72, implying that the distribution of this group of data was comparatively dispersed. The mean of ideal travel distance of respondents living in UFED was 6.25, and its median was 2, which represents a big difference with the mean. The Q1 and Q3 were 2 and 7.65, respectively, and the IQR was 5.65, indicating the distribution of data was concentrated; however, there were many outliers. The average ideal travel distance of respondents living in NDUD was 5.81, and its median was 2, which was quite different from the mean.
The IQR was 2.5, implying that the data distribution was very concentrated; but there were also some outliers in this case as well. From the mean of the above data, there is not much of a difference between the CDCF group, the UFED group, and the NDUD group, with the mean fluctuating between 5.81 and 8.26. Among them, the CDCF group has the largest mean, and the NDUD group has the smallest mean. This is related to the land use structure and development positioning of CDCF where idle land is scarce and the land use is not prioritized toward developing AGs, resulting in citizens relatively large mean of ideal travel distance. NDUD belongs to the new development zone of Beijing where many new towns are in the process of being developed, and where expansion and urbanization is taking place. Therefore, regulations on land development and use are laxer than in CDCF and UFED, and there is relatively more vacant land in this area as well, which can be used as land for AGs temporarily, thus resulting in a comparatively small average travel distance for the citizens. Furthermore, IQR (interquartile range) refers to the difference between the value on the third quartile and the value on the first quartile. Based on that, the values of the variables are arranged in order of magnitude, and the arithmetic progression is divided into four equal parts. It reflects the degree of dispersion of the middle 50% of the data, which is a more robust statistic because it is not affected by the extreme value. The smaller the value, the more concentrated the data in the middle; the larger the value, the more dispersed the data in the middle (An and Shen, 2017). The IQR of the above data gradually decreases from the CDCF group, the UFED group, to the NDUD group; that is, the CDCF group and the UFED group have a large IQR, indicating that the data of ideal travel distance of these two groups is dispersed, while the NDUD group has a small IQR, indicating the data of the ideal travel distance is concentrated in this group. This is mainly because CDCF and UFED together form the main city of Beijing, in which a large amount of land is used for urban construction, the idle land is limited, some of it being on the edge of the main city or away from the densely inhabited area. Therefore, for some citizens, a situation is acceptable even if the AG is placed on land far from their housing. Consequently, the difference in the ideal travel distance in the minds of the citizens is large. Relatively speaking, NDUD is the outer suburb of Beijing, with less concentrated construction land and a large amount of easily available idle land, which leads to a more unified citizens opinion on ideal travel distance and minimal divergence in viewpoint about the issue.
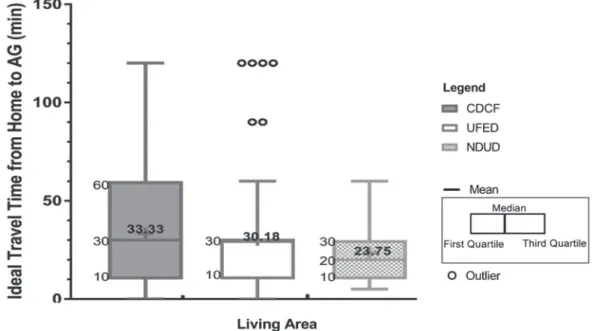
A box-plot of the ideal travel time of respondents grouped based on residential area (urban functional zones) is shown in Figure 8. The mean of the ideal travel time of the CDCF group was 33.33, and the median was 30, indicating that the mean could represent the average level of this group of data. The IQR was significant at 50, indicating that the data distribution was dispersed. Similarly, the median was not much different from the mean in NDUD group, thus the mean of NDUD group could represent the average level of its dataset.
Consistent with the trend of ideal travel distance, in terms of the mean of the above data, there is not much difference between the CDCF group, the UFED group, and the NDUD group, with the mean fluctuating between 23.75 and 33.33. Among them, the CDCF group has the largest mean, and the NDUD group has the smallest mean, indicating that the respondents living in CDCF have the longest ideal travel time, while the respondents living in NDUD have the shortest ideal travel time. This is related to the difficulty of obtaining suitable land for the development of AGs. It is more difficult to obtain appropriate land for AGs around the citizens residential areas in CDCF than in NDUD, leading to the conclusion that the final land for AGs is farther from citizens residential areas in CDCF than that in NDUD. From the IQR of the above data, the CDCF group has a large IQR, followed by the UFED group and the NDUD group. It can be seen that the data distribution of the CDCF group is the most dispersed. Respondents have the greatest disagreement about the ideal travel time in the CDCF range and have the smallest disagreement on the ideal travel time in the NDUD range.
In summary, there is not much difference in the service radius of AGs in different functional zones in Beijing. The average service radius is between 5.81 km and 8.26 km. However, in terms of the difference, the service radius of AGs from high to low in the different areas is CDCF, UFED, and NDUD. The ideal travel time from long to short is CDCF, UFED, and NDUD. In CDCF, the service radius of AGs is 0.28-10 km, and the corresponding ideal travel time is 33.33 minutes. In UFED, the service radius of AG is 2-7.65 km, and the corresponding ideal travel time is 10-30 minutes. In NDUD, the service radius of AG is 1-3.5 km, and the corresponding ideal travel time is 23.75 minutes. According to the Master Plan, AGs are suitable for building in UFED and NDUD. Therefore, regarding the service radius of AGs, it should be slightly longer in UFED than that in NDUD. From the above analysis, the reasonable service radius of AGs located in UFED is 2-7.65 km, and the service radius of AGs located in NDUD can be
appropriately reduced to 1-3.5 km, and the corresponding travel time is controlled at 10-30 minutes in UFED and 23.75 minutes in NDUD.
4.2. Service Radius of AGs Determined by Travel Mode Preference
There are five main travel modes from home to AGs, namely walking, cycling, electromobile riding, public transit, and driving. Among the 202 respondents, the number of people who chose walking as the ideal travel mode was 74, accounting for 35.58%; the number of people who chose cycling as the ideal travel mode was 49, accounting for 23.56%; 12 people chose electromobile riding as their ideal travel mode, or 5.77%; 27 people chose public transit as their ideal mode of travel, accounting for 12.98%; 40 people chose driving as their ideal mode of travel, with a proportion of 20.19%. Therefore, most of the respondents believed that walking was the most ideal travel mode, followed by cycling and then by driving. Relatively speaking, the two travel modes of electromobile riding and public transit were less ideal.
Choosing different modes of travel will result in different ideal travel distances and ideal travel times. Therefore, according to different travel modes, the mean, median, Q1, and Q3 of the ideal travel distance of different travel modes were respectively calculated based on the ideal travel distance provided by the respondents. The box-plot of the relationship between ideal travel mode and ideal travel distance is shown in Figure 9. The mean of the ideal travel distance in the walking group was 1.12, the median was 1, and the difference between the mean and the median was small, indicating that this group of data basically conformed to the normal distribution, and the mean could consequently represent the average level of this group of data. The Q1 and Q3 were 0.5 and 1, respectively, indicating that 50% data of the walking group was concentrated in 0.5 to 1. The IQR was 0.5, indicating that the data distribution was concentrated; however, there were many outliers, implying that some of the respondents views on ideal distance were quite different from those of most people. The mean of the ideal travel distance for the cycling group was 2.97, and the median was 2, implying that the mean could represent the average level of this dataset; the IQR was 2, reflecting that the distribution of data was very concentrated. The mean of the ideal travel distance in the electromoblie group was 8.43, and the median was 5, which was a little different from the mean; the Q1 and Q3
were 1 and 7.45, respectively, and the IQR was 6.75, reflecting that the data distribution was relatively concentrated. The average ideal travel distance of the public transit group was 10.26, and the median was 10, which was basically the same as the mean, indicating the mean could represent the average level of this dataset. The IQR was 7.5, showing the data distribution was relatively concentrated. The average ideal travel distance of the driving group was 17.31, which was very different from the median of 10; the IQR was large, at 22.5, indicating that the data distribution was dispersed. From the mean of the above data, the ideal travel distance successively increases from the travel modes of walking, cycling, electromobile riding, public transit, and driving. The mean of the ideal travel distance of the walking group, the cycling group, and the public transit group can represent the average level of these three datasets. From the IQR of the above data, it also increases from the travel modes of walking, cycling, electromobile riding, public transit, to driving̶that is, the data distribution of the ideal travel distance in the walking group and cycling group is the most concentrated, followed by electromobile riding and public transit, and the data distribution of ideal travel distance in the driving group is the most scattered. This reflects the fact that, regarding the issue of ideal travel distance, the respondents opinions in the walking group and cycling group are relatively centralized, followed by that of electromobile riding group and public transit group, with the driving group having the biggest difference of opinion. In addition, IQR is a better measure of the ideal travel distance in the electromobile riding group and the driving group.
Travel time is usually a good indicator of travel distance. Therefore, the box-plot of the ideal travel time provided by the different groups of respondents based on different travel modes is shown in Figure 10. The mean of the ideal travel time of the walking group was 17.84, and the median was 15, which was not much different from the mean; the IQR was 10, implying that the data was relatively concentrated. The mean of the ideal travel time of the cycling group was 28.27, and the median was 20, which was a quite different from the mean; the IQR was 20, and the data was relatively concentrated. The average ideal travel time of the electromobile group was 35.04, and the median was 30, indicating that the mean could represent the average level of the data in this group; the IQR was 24.25, implying that the data distribution was slightly dispersed. The average ideal travel time of the public transit group was 44.63, the median was 30, and thus the gap between mean and median was large; the IQR was 30, and the data distribution was relatively scattered. The average ideal travel time of the driving group was 43.36, much different from the median of 30; the IQR was 30, indicating that the data distribution was relatively scattered. Therefore, it can be seen
that, basically consistent with the trend of ideal travel distance, the mean of ideal travel time increases from the travel mode of walking, cycling, electromobile riding, driving, and public transit, with the walking group having the shortest ideal travel time, and the public transit group having the longest ideal travel time. The mean of the ideal travel time in the walking group and the electromobile riding group is a good indicator reflecting the average level of these two datasets. From the IQR of the ideal travel time, it basically increases with the travel modes of walking, cycling, electromobile riding, public transit, and driving, reflecting that on the issue of ideal travel time, respondents opinions of the walking group and the cycling group are more concentrated, followed by the electromobile riding group, with the driving group and the public transit group having the most disagreement. In addition, IQR is a good measure of the ideal travel time for the cycling group and the driving group.
As a result, in terms of the service radius of AGs determined by travel mode preference, the service radius of AGs based on walking is 1.12 km, and the corresponding ideal travel time is 17.84 minutes; the service radius of AGs based on cycling is 2.97 km, with the corresponding ideal travel time of 10-30 minutes; the service radius of AGs based on electromobile riding is concentrated in the range of 1-7.45 km, and the corresponding ideal travel time is 35.04 minutes; the service radius of AGs based on the travel mode of public transit is 10.26 km, and the corresponding ideal travel time is within the range of 30-60 minutes; and, finally, the service radius of AGs based on driving is concentrated in the range of 5-27.5 km, and the corresponding ideal travel time is 30-60 minutes. The service radius of AGs based on driving is the largest, followed by that of public transit, of electromobile riding, of cycling, and then of walking. The relevant government departments can set the service radius of AGs according to the public s preference for travel modes. Based on the above discussion, most of the respondents believe that walking is the most ideal way to travel from the home to the AG, followed by cycling, and then by driving. Consequently, the service radius of AGs should be set at 1.12 km, 2.97 km, or within the range of 5-27.5 km around their houses, and the corresponding travel time ought to be controlled at 17.84 minutes by walking, 10-30 minutes by cycling, or 30-60 minutes by driving.
5. Conclusions and Policy Recommendation
Conclusion:
(1) In view of the overall urban planning and citizens opinions, future Beijing AGs should be built in UFED of the main city and NDUD. In UFED, Haidian District and Fengtai District are the primary layout locations, and Shijingshan District is an auxiliary layout location. The specific location is the non-centralized construction land of the green isolated area, encircling 10 edge groups or the periphery of the central area. In NDUD, Tongzhou District is the feasible area, and AGs can intensively be constructed in the urban green heart area or be integrated into the park green space of Tongzhou for the convenience of public use considering that this region is the main area of CDCF population evacuation and will experience an increase in population in the future.
(2) The service radius of AGs based on urban functional zones is not much different, with its mean fluctuating between 5.81 km and 8.26 km. However, minor nuances in the service radius of AGs in different urban functional zones can be seen that the service radius of AGs in UFED is slightly longer than that in NDUD. The reasonable service radii of AGs located in UFED and NDUD are 2-7.65 km and 1-3.5 km, respectively, and the corresponding travel time from the home to the AG in UFED and NDUD is controlled at 10-30 minutes and 23.75 minutes, respectively.
the most ideal mode, followed by cycling, and then by driving. As for the service radius of AGs based on travel mode preference, it should be set at 1.12 km by walking, 2.97 km by cycling, and 5-27.5 km by driving, and the corresponding travel time ought to be respectively controlled at 17.84 minutes, 10-30 minutes, and 30-60 minutes.
Policy Recommendation:
The rational spatial layout of AGs needs to be elaborated from both macro and micro aspects. The Master Plan provides potential and feasible spatial locations for AGs from the macro level, while the reasonable service radii of AGs are determined from the micro level, not only based on the citizens opinions, but also within the scope of the Master Plan. Therefore, the following policy recommendation 1 is to locate the AGs from a macro perspective, while policy recommendations 2 and 3 calculate the service radii from a micro perspective. Among them, there are two main factors affecting the service radii of AGs: one is the Beijing functional zones, and the other is the citizens travel mode preferences.
(1) The urban construction of Beijing should not be at the expense of green. Building a city with agriculture is the direction of future urban development. Therefore, when formulating urban development strategies, it is necessary for policy makers to reserve a part of green space to intersperse the resettlement of AGs or other types of urban agriculture. The rational layout of the future AGs is in UFED of the main city and Tongzhou District. However, UFED is a predominantly built-up area, and the acquisition of new land in this area is costly and less feasible. Therefore, the current feasible method is to integrate and convert existing discard construction land or abandoned agricultural land into AGs, which will not only improve the utilization rate of abandoned land, but also reserve land for the city s future development. In addition, it is also a desirable method for the combination of AGs and residential areas, which will greatly shorten citizens travel distance and improve the utilization rate of AGs. Since Tongzhou District is the sub-center of Beijing and is still under construction, the planning of this region will be more reasonable than the main city. Therefore, the government can introduce relevant policies to allocate certain land as the land for AGs which should be close to the urban green heart. As an alternative, a small-scale AGs can be built in the urban park green space as a school-age farm to give play to the natural education function of the AGs.
(2) The service radius and travel time of AGs analyzed by this study is an ideal state, and it exclusively represents the opinions of some citizens. Thereupon, in the specific site selection process, the service radius of AGs can be appropriately expanded taking into account the actual situation of land use in Beijing, but one guideline should be followed that the service radius of AGs located in NDUD should be smaller than that of AG located in UFED. Apart from that, AGs should be placed within 6 km from large residential areas, and the travel time should be controlled within 30 minutes.
(3) Government should conduct a large-scale investigation on the preference of citizen s travel mode before officially launching the construction of AGs in order to determine the service radius of AGs. According to the conclusions of this study, walking and cycling are the two most preferred travel modes of the public. Both of these modes hope that AG can be built within 3 km from one s house. Therefore, government should look for suitable land around the large residential areas, adopt an approach of small area, multiple points, scattered distribution to layout AGs. Driving is also an acceptable way for the public, but government should make the service radius of AGs no more than 27 km and make the corresponding travel time no more than one hour when arranging a long-distance AG.
6.Acknowledgement
This work was supported by JSPS Grant-in-Aid for Scientific Research (B), and the Grant Number is 15H04105.
Notes
1
References
1. FUKAMI Satoshi, NAKAMURA Osamu. (2016). Consideration of Multifaceted Value of Allotment Garden.
29-34.
2. Da Silva, M. I., Fernandes, O. C., Castiglione, B., Costa, L. (2016). Characteristics and Motivations of Potential Users of Urban Allotment Gardens: The Case of Vila Nova de Gaia Municipal Network of Urban Allotment Gardens.
56-64.
3. Guitart, D. A., Byrne, J. A., Pickering, C. M. (2015). Greener Growing: Assessing the Influence of Gardening Practices on the Ecological Viability of Community Gardens in South East Queensland, Australia. 189-212. 4. HE Baojie, ZHU Jin. (2018). Constructing Community Gardens? Residents Attitude and Behavior towards Edible Landscapes in
Emerging Urban Communities of China. 154-165.
5. Colding, J., Lundberg, J., Folke, C. (2006). Incorporating Green-area User Groups in Urban Ecosystem Management. 237-244.
6. Ricci, J. M. P., Conrad E. (2018). Exploring the Feasibility of Setting up Community Allotments on Abandoned Agricultural Land: A Place, People, Policy Approach. 102-115.
7. Okvat, H. A., Zautra, A. J. (2011). Community Gardening: A Parsimonious Path to Individual, Community, and Environmental
Resilience. 374-387.
8. Kiesling, F.M., Manning, C.M. (2010). How Green is Your Thumb? Environmental Gardening Identity and Ecological Gardening
Practices. 315-327.
9. Van den Berg, A.E., Van Winsum-Westra, M., De Vries, S., Van Dillen, S.M.E. (2010). Allotment Gardening and Health: A Comparative Survey among Allotment Gardeners and Their Neighbors without An Allotment. 74.
10. Soga, M., Cox, D.T.C., Yamaura, Y., Gaston, K.J., Kurisu, K., Hanaki, K. (2017). Health Benefits of Urban Allotment Gardening: Improved Physical and Psychological Well-being and Social Integration. 81.
11. Milligan, C., Gatrell, A., Bingley, A. (2004). Cultivating Health: Therapeutic Landscapes and Older People in Northern England. 1781-1793.
12. Bowker, R., Tearle, P. (2007). Gardening as A Learning Environment: A Study of Children s Perceptions and Understanding of School Gardens as Part of An International Project. 83-100.
13. Partalidou, M., Anthopoulou, T. (2017). Urban Allotment Gardens during Precarious Times: From Motives to Lived Experiences. 212-228.
14. Holland, L. (2004). Diversity and Connections in Community Gardens: A Contribution to Local Sustainability. 285-305.
15. Hynes, H.P., Howe, G. (2004). Urban Horticulture in the Contemporary United States: Personal and Community Benefits. 171-181.
16. Guitart, D., Pickering, C., Byne, J. (2012). Past Results and Future Directions in Urban Community Gardens Research. 364-373.
17. Scheromm, P. (2015). Motivations and Practices of Gardeners in Urban Collective Gardens: The Case of Montpellier. 735-742.
18. Torres, A. C., Prévot, A. C., Nadot, S. (2018). Small but Powerful: The Importance of French Community Gardens for Residents. 5-14.
19. SUGIYAMA Takemi, Carver, A., Koohsari, M. J., Veitch, J. (2018). Advantages of Public Green Spaces in Enhancing Population
Health. 12-17.
20. Cabral, I., Keim, J., Engelmann, R., Kraemer, R., Siebert, J., Bonn, A. (2017). Ecosystem Services of Allotment and Community
Gardens: A Leipzig Germany Case Study. 44-53.
21. Egli, V., Oliver, M., Tautolo, E. (2016). The Development of A Model of Community Garden Benefits to Wellbeing. 348-352.
22. Filkobski, I., Rofè, Y., Tal, A. (2016). Community Gardens in Israel: Characteristics and Perceived Functions. 148-157.
23. YUAN Shuai, WU Shouxue, HAN Zhengyan. (2016). The Business Methods of Urban Farming Garden and The Development
Strategy. 204-207.
24. ZHOU Yuxin. (2007). Research on Business Model of Japanese Allotment Garden. 42-46.
25. SHAO Jun, ZHANG Yujun, LI Xiong, LI Zhao. (2012). Study on the Recreational Mode of Community-supported Agriculture-type
Urban Farms. 74-79.
26. CHEN Yijie, YAN Xiaohui, HUANG Zhiyou, LI Cuihuan. (2018). Research on Construction Standards and Management Norms of
Beijing Allotment Garden. 5-12.
27. WANG Zhifang, CAI Yang, ZhANG Chen, KOU Miao. (2017). The Research on Public Acceptance of Community Garden Based on Landscape Preference Analysis̶A Case Study of Beijing. 86-94.
28. ZHAO Chen. (2017). The Dilemma and Countermeasure of Beijing Little Donkey Farm. 10-16.
29. Žlender, V., Tompson, C. W. (2017). Accessibility and Use of Peri-urban Green Space for Inner-city Dwellers: A Comparative
Study. 193-205.
30. Van Herzele, A., Wiedemann, T. (2003). A Monitoring Toll for the Provision of Accessible and Attractive Urban Green Spaces. 109-126.
31. Giles-Corti, B., Broomhall, M., Knuiman, M., Collins, C., Douglas, K., Ng, K., Lange, A., Donovan, R. J. (2005). Increasing Walking: How Important Is Distance to, Attractiveness, and Size of Public Open Space? 169-176. 32. Stessens, P., Khan, A. Z., Huysmans, M., Canters, F. (2017). Analysing Urban Green Space Accessibility and Quality: A GIS-based
Model as Spatial Decision Support for Urban Ecosystem Services in Brussels. 328-340.
33. Gupta, K., Roy, A., Luthra, K., Maithani, S., Mahavir. (2016). GIS Based Analysis for Assessing the Accessibility at Hierarchical
Levels of Urban Green Spaces. 198-211.
34. La Rosa, D. (2014). Accessibility to Greenspaces: GIS Based Indicators for Sustainable Planning in A Dense Urban Context. 122-134.
35. CHEN Xiaoqiu, WAN Li, YANG wie. (2014). Travel Distance-based Accessibility Evaluation for Urban Public Park: The Example
of Yueqing City. 348-352.
36. TONG Liga, NING Xiaoli, ZHANG Jing. (2013). Combing GIS and RS Technique to Understand Recreational Service Radius of
City Green Spaces in Baotou City, Inner Mongolia, China. 202-208.
37. MIYAKE Yasunari, MATSUMOTO Yasuo. (1997). Analysis of the User Radius and Attitudes of Allotment Gardens for the
Aged. , 240-250.
38. YE Meng, YOSHIDA Tomohiko. (2018). A study on the Locational Distribution of Allotment Gardens and Its Impact Factors in
Osaka Prefecture. 103-126.
39. ZHAO Yuankuan. (1992). The Choice of Spatial Expansion Mode in Urban Fringe Area of Beijing. 19-22. 40. AN Tonghe, SHEN Yue. (2017). Study on the Development of Large-scale Residential District in the Urban Fringe.
41. SUN Qiang, CAI Yunlong, WANG Yue. (2007). Ecological Assessment of Green Space Based on Land Use Type̶Taking the Key New City of Tongzhou District of Beijing as An Example. 36-42.
42. Hou, J., Grohmann, D. (2018). Integrating Community Gardens into Urban Parks: Lessons in Planning, Design and Partnership