50 コンクリートの表面性状が各種微破壊試験の測定値に及ぼす影響 論 文 Article
コンクリートの表面性状が各種微破壊試験の測定値に及ぼす影響
原稿受付 2012 年 4 月 2 日 ものつくり大学紀要 第 3 号 (2012) 50~55後藤正明
*1,澤本武博
*2,飛内圭之
*2,大塚秀三
*2 *1 高崎市役所(ものつくり大学大学院 ものつくり学研究科 修了) *2 ものつくり大学 技能工芸学部 建設学科Effects of Concrete Surface Properties
on Measurement Values of Semi-Destructive Testing
Masaaki GOTO*1, Takehiro SAWAMOTO*2, Keishi TOBINAI*2 and Shuzo OTSUKA*2
*1
TAKASAKI City Office (Graduate, Institute of Technologists)
*2
Dept. of Building Technologists, Institute of Technologists
Abstract The properties of concrete such as strength and durability are affected by placing, curing and aging. And
they can affect concrete surface because of bleeding water, dryness of surface water, and so on. However, correlation between variation of concrete surface and measurement value of semi-destructive testing has not been obvious. In this study, the effects of concrete surface properties on rebound number, rebound speed ratio, and scratch width were investigated. The main conclusions are as follows. (1)The rebound number of the top surface of the member was smaller than that of the side surface. And, the rebound speed ratio showed the same tendency as the rebound number. (2)The rebound number of concrete cured in water was smaller than that of concrete cured in air. And, the rebound speed ratio showed the same tendency as the rebound number. The scratch width of concrete cured in water was wider than that of concrete cured in air. (3)The rebound number and the rebound speed ratio of concrete at the age of 91 days were higher than those of concrete at the age of 28 days.
Key Words : Concrete, Semi-destructive testing, Rebound number, Rebound speed ratio, Scratch width
51 The Bulletin of Institute of Technologists, No. 3
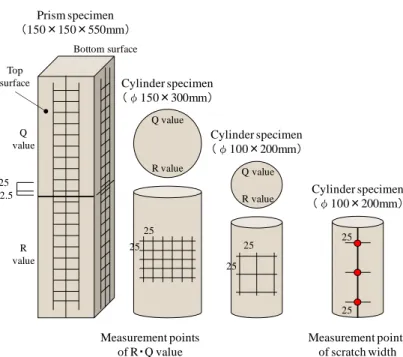
種類(以下,試験室と略記)と,呼び強度を変化 させた 3 種類(以下,実機と略記)を使用するこ ととした.それぞれのコンクリートの使用材料お よび配合は,表 1~表 4 に示す通りである.なお, 表 2 および表 4 に示した圧縮強度は,標準水中養 生を行った材齢 28 日における強度である. 2.2 供試体の作製 実験に用いた供試体は,試験室・実機ともに 150 × 150 × 550mm の 角 柱 供 試 体 お よ び φ 100 × 200mm の円柱供試体とした.また,試験室のみφ 150×300mm の円柱供試体も作製した.角柱供試 体の作製は,図 4 に示すように 150×550mm の開 口部からコンクリートを打ち込んだ.そして,角 柱供試体およびφ150×300mm の円柱供試体は材 齢 7 日で脱型し,試験材齢まで室温 20℃・相対湿 度 60%の環境下で気中養生を行った.φ100× 200mm の円柱供試体については,気中養生(材齢 7 日で脱型),封かん養生および水中養生(材齢 1 日で脱型)を行った.
Fig. 4 Placement of prism specimen Table 2 Mix proportions and test results (Laboratory)
Material Locality or brand Specification
Surface-dry condition:2.61g/cm³ Water-absorption rate:2.14% Surface-dry condition:2.59g/cm³ Water-absorption rate:2.14% Surface-dry condition:2.71g/cm³ Water-absorption rate:0.39% Chemical admixture Density:3.16g/cm³ Product of Kimitsu Product of Kodama Fine aggregate
Water-reducing and air-entraining admixture High-range water-reducing and air-entraining admixture Product of Ome Cement Coarse aggregate Ordinary portland cement
Table 1 Raw materials of concrete (Laboratory)
60.0 49.4 184 307 435 431 924 C×1.0% 19.0 3.7 31.9 50.0 46.8 184 368 395 392 954 C×1.0% 20.0 3.9 42.6 40.0 48.4 165 413 416 413 924 C×0.85% 19.5 4.8 58.9 35.0 47.0 165 471 393 390 921 C×1.0% 20.5 4.0 67.8 30.0 48.0 165 550 402 399 902 C×1.2% 52.0 2.1 87.9 25.0 45.0 165 660 380 377 854 C×1.8% 57.0 1.5 96.7
** W/C40%~25%:High-range water-reducing and air-entraining admixture *** W/C60%~35%:Slump *** W/C30%~25%:Slump flow
W/C (%)
s/a (%)
Unit content (kg/m³) Test result
W C S1* Slump(flow) *** (cm) Air content (%) Compressive strength (N/mm²) S2* G Ad**
* S1:Product of Kimitsu * S2:Product of Kodama ** W/C60%~50%:Water-reducing and air-entraining admixture
Table 4 Mix proportions and test results (Factory)
Material Locality or brand Specification
Surface-dry condition:2.61g/cm³ F.M.:2.75 Surface-dry condition:2.64g/cm³ Peroentage of solid volume:59.0%
Surface-dry condition:2.70g/cm³ Peroentage of solid volume:60.0% Fine
aggregate
Coarse aggregate
Cement Ordinary portland
cement Density:3.16g/cm³ Product of Tochigi Product of Tochigi Product of Sano (Limestone) Chemical admixture
Water-reducing and air-entraining admixture High-range water-reducing and air-entraining admixture
Table 3 Raw materials of concrete (Factory)
24 58.5 48.5 181 310 856 919 C×1.2% 16.0 3.0 34.1 40 42.0 48.4 170 405 791 935 C×1.0% 20.5 4.9 53.6 60 31.0 46.1 170 549 773 851 C×1.4% 57.0 5.0 84.1
S G* Ad**
** fc24:Water-reducing and air-entraining admixture
** fc40~fc60:High-range water-reducing and air-entraining admixture *** fc24~40:Slump *** fc60:Slump flow
Slump(flow)*** (cm)
Air content (%)
* fc24~fc40:Product of Tochigi * fc60:Product of Sano
Compressive strength (N/mm²) Nominal strength W/C (%) s/a (%)
Unit content (kg/m³) Test result
W C
Fig. 2 Rebound speed ratio test
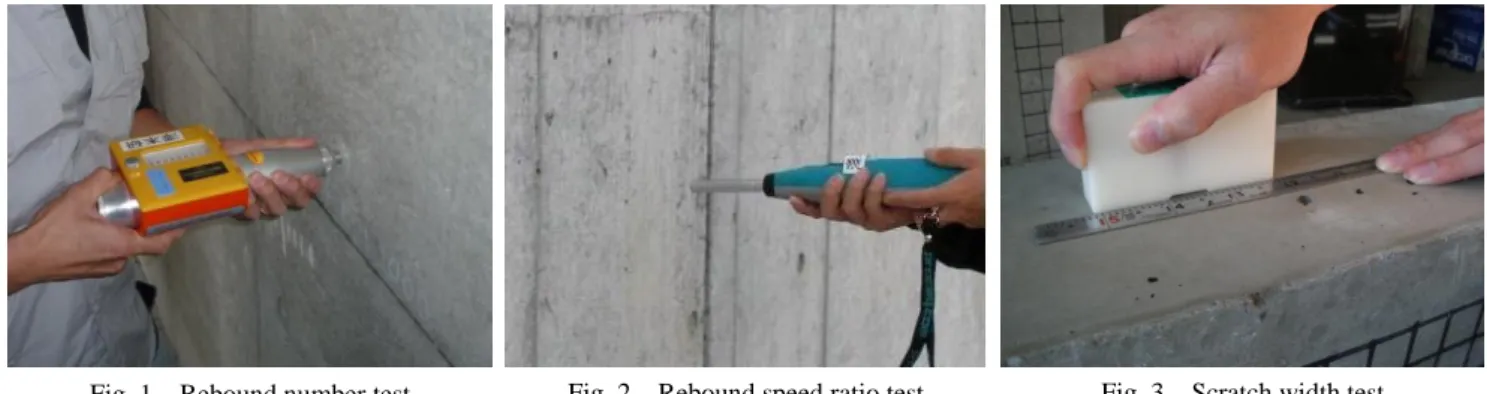
52 コンクリートの表面性状が各種微破壊試験の測定値に及ぼす影響 2.3 各種微破壊試験の測定方法 各種微破壊試験の測定箇所は,図 5 に示した通 りであり,反発度(以下,R 値と略記)および反 発速度比(以下,Q 値と略記)の測定は,耐圧試 験機を用いてそれぞれの供試体を 3.5N/mm2の力 で拘束2,3)して行うこととし,角柱供試体において は打込み面(以下,上面と略記)・側面および底 面からそれぞれ 30 点ずつ(図 6),φ150×300mm の場合も 30 点ずつ(図 7),φ100×200mm の場 合は 9 点ずつの R 値および Q 値の測定を行い,平 均値を求めた.なお,打撃角度による影響をなく すため,R 値および Q 値の測定は水平に打撃する こととした.引っかき傷幅試験では,φ100× 200mm の円柱供試体にのみ行うこととし,供試体 に引っかき試験器を押し当てて引っかき,表面に ついた傷から 3 点の傷幅(荷重 1.0kg)を測定した. なお,引っかき傷幅の測定は,クラックスケール およびフラッシュルーペを用いて行った1,4).
3.実験結果および考察
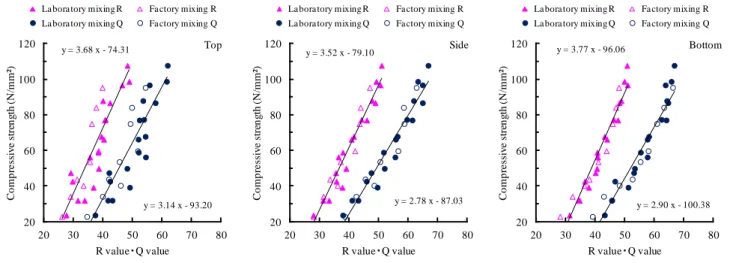
3.1 測定面の違いが測定値に及ぼす影響 3.1.1 平面・曲面の影響 平面(側面)と 曲面の R 値および Q 値の関係は,図 8 に示す通り である.平面と曲面の違いによる測定値への影響 はあまり見られず,測定面の違いが R 値および Q 値に及ぼす影響はほとんどないと考えられる. 3.1.2 上面・側面・底面の影響 上面・側 面・底面の R 値および Q 値と圧縮強度の関係は, 図 9 に示す通りである.上面の測定では,R 値お よび Q 値いずれの場合にも,側面や底面の測定値 より小さい値を示した.これは,ブリーディング などの影響によって上面に脆弱な層が形成されて いたためと考えられる.そのため,上面を測定す る際には,補正を行うなどの考慮が必要になると 思われる 3).上面・側面・底面の違いがそれぞれ の測定値に及ぼす影響としては,R 値の場合,側 面の測定値に比べて上面が 4 程度小さく,底面は 2 程度大きくなる傾向にあり,Q 値の場合,側面 Cylinder specimen (φ150×300mm) R value Q value 25 25 Cylinder specimen (φ100×200mm) R value Q value 25 25 Prism specimen (150×150×550mm) Top surface Bottom surface 25 12.5 Q value R value Measurement points of R・Q value 25 25 Cylinder specimen (φ100×200mm) Measurement points of scratch width Fig. 5 Measurement points of 3 semi-destructive testsFig. 6 Measurement of prism specimen
Fig. 7 Measurement of cylinder specimen
Fig . 8 Effects of plane・curve surface on R・Q value
20 30 40 50 60 70 20 30 40 50 60 70 Cu rv ed su rf ac e R ・Q val u e (φ 150)
Plane surface R・Q value (Prism)
53 The Bulletin of Institute of Technologists, No. 3
の測定値に比べて上面が 5 程度 小さく,底面が 3 程度大きくな る傾向にあった. 3.2 養生方法の違いが測定値 に及ぼす影響 気中養生と封かん養生および 水中養生の R 値および Q 値の関 係は,図 10 に示す通りである. 封かん養生した供試体の R 値・ Q 値は,気中養生した供試体と 同程度の値となった.一方,水 中養生した供試体の R 値・Q 値 の測定値は,水セメント比が大 きい(R 値・Q 値が小さい)場 合には,気中養生した供試体よ りも値が小さくなったが,水セ メント比が小さい(R 値・Q 値 が大きい)場合には同程度の値 となった.これは,高強度にな るほど表層の湿潤状態の影響を 受けにくいことを表していると 考えられる.養生方法の違いに よる影響としては,普通コンク リートに近い配合で水中養生を 行った場合,R 値が 5 程度小さ くなり,Q 値が 7 程度小さくなる傾向にあった. 気中養生と封かん養生および水中養生の引っか き傷幅の関係は,図 11 に示す通りである.気中養 生と封かん養生の関係では,測定値に多少のばら つきはあったが,概ね同程度の測定値となった. しかし,気中養生と水中養生の関係では,水セメ ント比が小さくなる(傷幅が小さくなる)ほど, 水中養生を行った場合には,気中養生を行った場 合に比べ傷幅が大きくなる傾向にあり,傷幅の測 定値は 0.2mm 程度大きくなる傾向にあった. y = 3.14 x - 93.20 y = 3.68 x - 74.31 20 40 60 80 100 120 20 30 40 50 60 70 80 Co m p re ss iv e s tre n g th (N /m m ²) R value・Q value
La bora tory mixing R Fa ctory mixing R La bora tory mixing Q Fa ctory mixing Q
Top y = 2.78 x - 87.03 y = 3.52 x - 79.10 20 40 60 80 100 120 20 30 40 50 60 70 80 Co m p re ss iv e s tre n g th (N /m m ²) R value・Q value
La bora tory mixing R Fa ctory mixing R La bora tory mixing Q Fa ctory mixing Q
Side y = 2.90 x - 100.38 y = 3.77 x - 96.06 20 40 60 80 100 120 20 30 40 50 60 70 80 Co m p re ss iv e s tre n g th (N /m m ²) R value・Q value
La bora tory mixing R Fa ctory mixing R La bora tory mixing Q Fa ctory mixing Q
Bottom
Fig. 9 Effects of top・side・bottom surface on R・Q value (Prism specimen)
0 0.1 0.2 0.3 0.4 0.5 0.6 0 0.1 0.2 0.3 0.4 0.5 0.6 S e a le d c u ri n g o n s cra tc h w id th (m m )
Atmospheric curing on scratch width (mm)
Atmospheric a nd sea led y = x
0 0.1 0.2 0.3 0.4 0.5 0.6 0 0.1 0.2 0.3 0.4 0.5 0.6 U n d e rw a te r c u ri n g o n s c ra tc h w id th (m m )
Atmospheric curing on scratch width (mm)
Atmospheric a nd underwa ter y = x
Fig. 11 Effects of curing on scratch width (Cylinder specimen)
20 30 40 50 60 70 20 30 40 50 60 70 S e a le d c u ri n g o n R ・Q v al u e (φ 1 0 0 )
Atmospheric curing on R・Q value (φ100)
R va lue Q va lue y = x 20 30 40 50 60 70 20 30 40 50 60 70 U n d e rw a te r c u ri n g o n R ・Q v a lu e (φ 1 0 0 )
Atmospheric curing on R・Q value (φ100)
R va lue Q va lue y = x
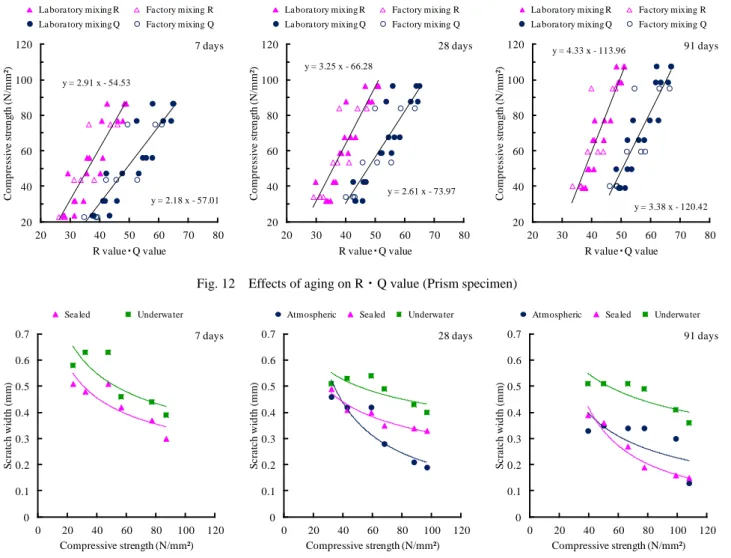
54 コンクリートの表面性状が各種微破壊試験の測定値に及ぼす影響 3.3 材齢の違いが測定値に及ぼす影響 各材齢における R 値および Q 値と圧縮強度の関 係は,図 12 に示した通りであり,コンクリートの 材齢が進行するほど,圧縮強度の増加に伴う R 値・Q 値の増加の割合は小さくなる(グラフの傾 きが大きくなる)傾向にあった.そのため,材齢 が長期間になるほど,コンクリートの強度推定が しにくくなると思われる. また,圧縮強度が 40N/mm2程度の場合の R 値お よび Q 値は,材齢 7 日と材齢 28 日では測定値に あまり差は見受けられないが,材齢 91 日の測定値 は,材齢 28 日の測定値に比べて,R 値では 3 程度 大きくなり,Q 値では 4 程度大きくなる傾向にあ った.これは,材齢の経過に伴う乾燥や中性化の 影響を大きく受けるため,材齢が進行すると,同 程度の強度であっても表面硬度が大きくなること が原因と考えられる5). 各材齢における圧縮強度と引っかき傷幅の関係 は,図 13 に示す通りである.ばらつきは大きいも のの,材齢の違いによる測定値の全体的な傾向の 変化はさほど見受けられないため,材齢が引っか き傷幅の測定値に及ぼす影響はあまりないと考え られる.これは,リバウンドハンマーの測定値は, コンクリート表面から 5~10mm 程度の深さまで 影響するのに対して,引っかき傷幅はごく表層を 測定するため,材齢 28 日と材齢 91 日の表層部は 完全に中性化していると考えられ,ごく表層部に 差が見られなかったためと考えられる.
4.まとめ
150 × 150 × 550mm の 角 柱 供 試 体 , φ 150 × 300mm およびφ100×200mm の円柱供試体を作製 し,測定面・養生・材齢の異なる条件が各種微破 壊試験の測定値に及ぼす影響について検討を行っ た結果,以下のような傾向を示した. y = 2.18 x - 57.01 y = 2.91 x - 54.53 20 40 60 80 100 120 20 30 40 50 60 70 80 Co m p re ss iv e s tre n g th (N /m m ²) R value・Q valueLa bora tory mixing R Fa ctory mixing R La bora tory mixing Q Fa ctory mixing Q
7 days y = 2.61 x - 73.97 y = 3.25 x - 66.28 20 40 60 80 100 120 20 30 40 50 60 70 80 Co m p re ss iv e s tre n g th (N /m m ²) R value・Q value
La bora tory mixing R Fa ctory mixing R La bora tory mixing Q Fa ctory mixing Q
28 days y = 3.38 x - 120.42 y = 4.33 x - 113.96 20 40 60 80 100 120 20 30 40 50 60 70 80 Co m p re ss iv e s tre n g th (N /m m ²) R value・Q value
La bora tory mixing R Fa ctory mixing R La bora tory mixing Q Fa ctory mixing Q
91 days
Fig. 12 Effects of aging on R・Q value (Prism specimen)
0 0.1 0.2 0.3 0.4 0.5 0.6 0.7 0 20 40 60 80 100 120 S c ra tc h w id th (m m ) Compressive strength (N/mm²)
Sea led Underwa ter
7 days 0 0.1 0.2 0.3 0.4 0.5 0.6 0.7 0 20 40 60 80 100 120 S c ra tc h w id th (m m ) Compressive strength (N/mm²)
Atmospheric Sea led Underwa ter
28 days 0 0.1 0.2 0.3 0.4 0.5 0.6 0.7 0 20 40 60 80 100 120 S c ra tc h w id th (m m ) Compressive strength (N/mm²)
Atmospheric Sea led Underwa ter
91 days
55 The Bulletin of Institute of Technologists, No. 3