Addition of Novel Biomarkers for Predicting All-Cause and
Cardiovascular Mortality in Prevalent Hemodialysis Patients
Kazuomi Yamashita,
1,2Sonoo Mizuiri,
2Yoshiko Nishizawa,
2Kenichiro Shigemoto,
2Shigehiro Doi,
1and Takao Masaki
1Departments of Nephrology,1Hiroshima University Hospital, and2Ichiyokai Harada Hospital, Hiroshima, Japan
Abstract: Novel biomarkers might improve the prediction of mortality in hemodialysis (HD) patients. We simulta-neously measured the levels of conventional and novel bio-markers [serum N-terminal pro-brain natriuretic peptide (NT-proBNP), intact fibroblast growth factor-23 (FGF23), β2-microglobulin (β2MG), cystatin C, and high-sensitivity C-reactive protein (hsCRP)] in 307 prevalent Japanese HD patients. There were 66 all-cause deaths, and 25 car-diovascular (CV) deaths during 2 years, which were assessed using Cox models and concordance (C)-statistics.
The addition of NT-proBNP alone (P < 0.05) or
NT-proBNP, hsCRP, and β2MG as a panel (C-statistics:
0.834 vs. 0.776, P< 0.01) to a conventional risk model
com-posed of age, diabetes, and the serum albumin level signif-icantly improved the prediction of 2-year all-cause mortality, and the addition of NT-proBNP and hsCRP as a panel to a conventional risk model composed of age sig-nificantly improved the prediction of 2-year CV mortality
(P < 0.05) in Japanese prevalent HD patients. Neither
FGF23 nor cystatin C improved mortality prediction. Key Words: Fibroblast growth factor-23, Hemodialysis patients, High-sensitivity C-reactive protein, Mortality, N-terminal pro-brain natriuretic peptide.
Hemodialysis (HD) is associated with significant excess mortality and high social costs. Thus, the appropriate identification, risk stratification, and treatment of HD patients is important. Conventional risk factors for mortality, such as advanced age, diabetes, and low serum albumin levels, frequently coexist in HD patients, but they cannot fully account for the high prevalence of mortality in these patients. Therefore, research must be performed to create better and easier-to-use tools for mortality risk stratification in this population. Although numerous previous studies have explored various novel biomarkers for predicting mortality in HD patients, but the majorities of these studies were conducted in the United States (US) or Europe.
The 5-year survival rates of dialysis patients in the 2009 cohort was 41.5% in the US (1) and 60.5% in Japan (2), while that for the 2005–2009 cohort in
Europe was 63.3% (3). Mean age and the association of comorbid conditions such as cardiovascular diseases and diabetes differed across regions, and certain features of dialysis treatments, such as a single treatment time and the amount of blood flow, are unique to Japan (4). Based on these findings, the best biomarkers for predicting mortality in Japanese HD patients might differ from those for American and European HD patients.
Specific biomarkers were selected for this study on the basis of the commercial availability of assays and published data regarding the prognostic value of potential biomarkers of mortality in HD patients. N-terminal pro-brain natriuretic peptide (NT-proBNP) can be used to non-invasively mea-sure cardiac stretching, and there have been many reports about the associations between elevated serum NT-proBNP levels and all-cause or cardio-vascular (CV) mortality in HD patients (5–8). High-sensitivity C-reactive protein (hsCRP) is a key marker of inflammation, and inflammation is a major risk factor for mortality in patients with chronic kidney disease (6,8). Fibroblast growth fac-tor 23 (FGF23) is secreted by osteocytes, and
Received February 2017; revised June 2017; accepted June 2017. Address correspondence and reprint requests to Dr. Kazuomi Yamashita, Department of Nephrology, Hiroshima University Hospital, 1-2-3 Kasumi Minami-ku, Hiroshima, 734-8551 Japan. Email: [email protected]
Therapeutic Apheresis and Dialysis 2017;••(••):••–••
doi: 10.1111/1744-9987.12593
© 2017 The Authors. Therapeutic Apheresis and Dialysis published by John Wiley & Sons Australia, Ltd on behalf of International Society for Apheresis, Japanese Society for Apheresis, and Japanese Society for Dialysis Therapy
promotes phosphaturia and decreases calcitriol pro-duction (9). There is a pervasive view that elevated se-rum FGF23 levels are associated with increased mortality in HD patients (9,10). Cystatin C is a well known alternative marker of kidney function, and strong correlations have been detected between the serum levels of cystatin C and residual renal function in dialysis patients (11). Furthermore, residual renal clearance was found to be a predictor of survival in dialysis patients (12).β2-microglobulin (β2MG) is a low-molecular-weight protein (11800 Da) and is considered to be a surrogate marker of middle molecular-weight uremic toxins, which might affect nutritional status and have immunosuppressive ef-fects, andβ2MG is reported to be a significant pre-dictor of mortality in maintenance HD patients (13). Thus, we undertook this analysis to assess whether the addition of five biomarkers (NT-proBNP, hsCRP, FGF23, cystatin C, and β2MG) could improve the prediction of 2-year all-cause and/or CV mortality in Japanese prevalent HD patients.
PATIENTS AND METHODS
The subjects of this study were 307 prevalent HD patients who were treated at Ichiyokai Harada Hos-pital, Japan. Patients with hepatic insufficiency, acute or chronic infections, severe heart failure, or malig-nancies were excluded. This study was approved by the institutional review board of Ichiyokai Harada Hospital, Hiroshima, Japan (authorization No. 201201), and conforms to the provisions of the Decla-ration of Helsinki (as revised in Tokyo in 2004). All of the patients underwent routine HD three times a week (4 h per session) using standard high-flux dialysis membranes. Underlying diseases included chronic glomerulonephritis (125 patients, 40.7%), diabetic nephropathy (112 patients, 36.5%), nephrosclerosis (38 patients, 12.4%), polycystic kidney disease (11 patients, 3.6%), other diseases (11 patients, 3.6%), and unknown conditions (10 patients, 3.3%). The patients’ (N = 307) serum NT-proBNP, hsCRP, intact FGF23, cystatin C, β2MG, Kt/Vurea, hemoglobin (Hb), serum albumin, phosphate, intact parathyroid hormone (iPTH), and albumin-adjusted serum calcium (Ca) levels were measured only at baseline just before and at the end (for Kt/Vurea only) of the first day of the first week dialysis session in September 2012. In addition, the 24-h urine volume at 1 day before the baseline blood sampling was measured from the patients that produced≥100 mL/day of urine. The urinary volume was considered to be zero in patients that produced
<100 mL/day of urine. These values have been used for statistics. In each case, we examined the subject’s age, sex, dialysis vintage, pre-HD systolic blood pressure (BP), pre-HD diastolic BP. urinary volume (mL/day), and whether they were suffering from diabetes mellitus. CV death, including death due to myocardial infarction, congestive heart failure, peripheral arterial disease, and/or stroke, was diag-nosed based on the patients’ medical records. The patients’ NT-proBNP and hsCRP levels were determined using immunoassays (ECLIA Roche Diagnostics, GMBH Mannheim, Germany) by BML Inc. (Tokyo, Japan). The patients’ serum intact FGF23 levels were determined by SRL Inc. (Tokyo, Japan) using a sandwich ELISA kit (Kainos Laboratories, Tokyo, Japan). Other clinical biochemical analyses were performed at our hospi-tal’s laboratory.
Statistical analysis
All statistical analyses were performed with SPSS software (version 22.0, IBM, Armonk, NY, USA). The parameters that demonstrated normal distribu-tions are expressed as mean ± standard deviation values and were analyzed with the t-test. Non-parametric variables are expressed as median values and interquartile ranges (IQR) and were analyzed with the Wilcoxon-signed rank test.
The additional predictive value of the novel bio-markers was evaluated using the following steps for each of the outcomes, i.e., 2-year all-cause mortality or CV mortality.
Base model: We first developed univariate and multivariate Cox proportional hazards models for 2-year all-cause or CV mortality in prevalent HD patients using conventional risk markers. Indepen-dent variables included age, sex, dialysis vintage, presence of diabetes, urine volume, Kt/Vurea, serum albumin and serum phosphate. Base model was composed of only significant traditional independent variables.
Novel models: Then we added individual novel biomarkers (NT-proBNP, hsCRP, FGF23, cystatin C and β2MG) to the base model and calculated adjusted hazard ratios (HR) for each model using multivariate Cox proportional hazards models. NT-proBNP, hsCRP, FGF23 and cystatin C that exhibited non-parametric distributions were trans-formed to the logarithm (log) to achieve normality prior to the analyses.
The optimal model for 2-year all-cause or CV mor-tality: We created an optimal model for 2-year all cause or 2-year CV mortality by adding all of the novel biomarkers that had significant positive effects
on the prediction of the target variable to the base model. Multivariate logistic regression analyses for 2-year all-cause and CV mortality were also per-formed on all models. Akaike Information Criterion (AIC) (14) for the overall fit of the models and C-statistics (area under the ROC curves) (6,15) for model discrimination were obtained. Statistical tests for differences in C-statistics were also performed (15). The cut-off points of each model for the non-survivor and survivor groups were obtained in the optimal model. Kaplan–Meier survival analyses for predicting 2-year all-cause mortality using the cut-off points for the non-survivor group in the optimal model were also performed.
RESULTS
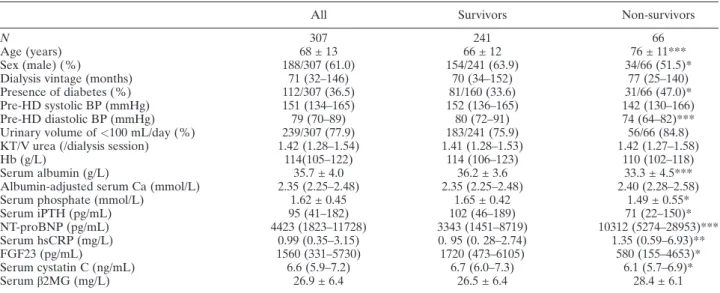
All of the subjects (N = 307) were Japanese, and baseline clinical data are shown in Table 1. After 24 months, a total of 66 patients had died, and the causes of death included CV mortality, infection, ma-lignancy, sudden death, wasting, other diseases and unknown in 25 (37.9%), 14 (21.2%), seven (10.6%), seven (10.6%), two (3.0%), nine (13.7%), and two (3.0%) patients, respectively. The median ages of non-survivors were significantly higher than survi-vors (P < 0.001). The non-survivors exhibited a higher frequency of diabetes (47.0% vs. 33.6%, P < 0.05); had lower pre-HD diastolic BP levels (P < 0.01), and displayed lower serum albumin
(33.3 ± 4.5 g/L vs. 36.2 ± 3.6 g/L, P< 0.001), phos-phate (P < 0.05), iPTH (P < 0.05), FGF23 (P < 0.05), and cystatin C levels (P < 0.05) than the survivors. On the other hand, the NT-proBNP [10312 (5274–28953) pg/mL vs. 3343 (1451–8719) pg/mL, P < 0.001] and serum hsCRP [1.35 (0.59–6.93) mg/L vs. 0. 95 (0. 28–2.74) mg/L, P < 0.01] levels of the non-survivors were signifi-cantly higher than those of the survivors. No significant difference in serum β2MG values were detected between the groups.
Cox proportional hazards regression analyses of 2-year all-cause and CV mortality in prevalent HD patients based on conventional markers are shown in Table 2. In the univariate analyses, age (P< 0.0001), urinary volume (P< 0.05), the serum albumin level (P < 0.0001), and the serum phosphate level (P< 0.01) were found to be significantly associated with 2-year all-cause mortality, and sex (P = 0.06) and presence of diabetes (P = 0.07) were shown to be marginally associated with 2-year all-cause mor-tality (Table 2A). In the multivariate analysis, only age (P < 0.0001), presence of diabetes (P < 0.05), and the serum albumin level (P< 0.05) were found to be significantly associated with 2-year all-cause mortality (Table 2A). While, age (P< 0.0001) and the serum albumin level (P < 0.01), and age (P< 0.0001) alone were found to be significantly as-sociated with 2-year CV mortality in the univariate and multivariate analyses, respectively (Table 2B).
TABLE 1. Subjects’ baseline clinical data
All Survivors Non-survivors
N 307 241 66
Age (years) 68 ± 13 66 ± 12 76 ± 11***
Sex (male) (%) 188/307 (61.0) 154/241 (63.9) 34/66 (51.5)*
Dialysis vintage (months) 71 (32–146) 70 (34–152) 77 (25–140)
Presence of diabetes (%) 112/307 (36.5) 81/160 (33.6) 31/66 (47.0)*
Pre-HD systolic BP (mmHg) 151 (134–165) 152 (136–165) 142 (130–166)
Pre-HD diastolic BP (mmHg) 79 (70–89) 80 (72–91) 74 (64–82)***
Urinary volume of<100 mL/day (%) 239/307 (77.9) 183/241 (75.9) 56/66 (84.8)
KT/V urea (/dialysis session) 1.42 (1.28–1.54) 1.41 (1.28–1.53) 1.42 (1.27–1.58)
Hb (g/L) 114(105–122) 114 (106–123) 110 (102–118)
Serum albumin (g/L) 35.7 ± 4.0 36.2 ± 3.6 33.3 ± 4.5***
Albumin-adjusted serum Ca (mmol/L) 2.35 (2.25–2.48) 2.35 (2.25–2.48) 2.40 (2.28–2.58)
Serum phosphate (mmol/L) 1.62 ± 0.45 1.65 ± 0.42 1.49 ± 0.55*
Serum iPTH (pg/mL) 95 (41–182) 102 (46–189) 71 (22–150)* NT-proBNP (pg/mL) 4423 (1823–11728) 3343 (1451–8719) 10312 (5274–28953)*** Serum hsCRP (mg/L) 0.99 (0.35–3.15) 0. 95 (0. 28–2.74) 1.35 (0.59–6.93)** FGF23 (pg/mL) 1560 (331–5730) 1720 (473–6105) 580 (155–4653)* Serum cystatin C (ng/mL) 6.6 (5.9–7.2) 6.7 (6.0–7.3) 6.1 (5.7–6.9)* Serumβ2MG (mg/L) 26.9 ± 6.4 26.5 ± 6.4 28.4 ± 6.1
Data are shown as mean ± standard deviation or median (interquartile ranges), as appropriate. *P<0.05, **P < 0.01, ***P < 0.001 compared with the survivors; β2MG, β2-microglobulin; BP, blood pressure; Ca, calcium; FGF23, fibroblast growth factor-23; HD, hemodialysis; hsCRP, high-sensitivity C-reactive protein; iPTH, intact parathyroid hormone; NT-proBNP, N-terminal pro-brain natriuretic peptide.
Thus, in the base models we included age, presence of diabetes, and the serum albumin level as independent predictors of 2-year all-cause mortality and age as an independent predictor of 2-year CV mortality.
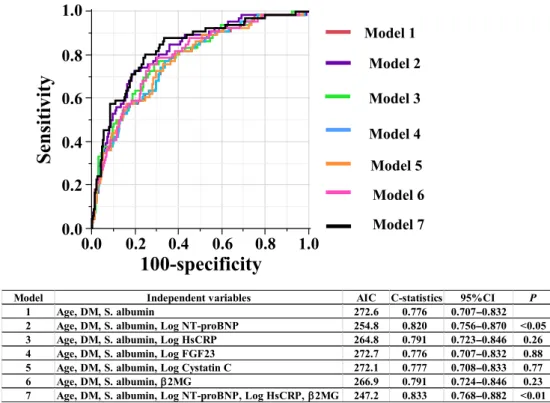
Predictive models of 2-year all-cause mortality in prevalent HD patients based on the conventional and novel biomarkers were assessed by Multivariate Cox proportional hazards regression analyses (Table 3). Model 1 was the base model and only in-cluded the conventional markers that were found to be significantly associated with 2-year all-cause mor-tality, i.e., age (P < 0.0001), presence of diabetes (P< 0.05), and the serum albumin level (P < 0.01). After the serum Log NT-proBNP was added to the base model, Log NT-proBNP (P < 0.0001), age (P < 0.0001), and serum albumin level (P < 0.05), but not the presence of diabetes were found to be sig-nificantly associated with 2-year all-cause mortality (Table 3, Model 2). After the addition of Log hsCRP to the base model, Log hsCRP (P < 0.01), age (P < 0.0001), and presence of diabetes (P < 0.05) but not the serum albumin level, were found to be significantly associated with 2-year all-cause mortal-ity (Table 3, Model 3). Neither adding Log FGF23 nor Log cystatin C to the base model resulted in any improvement in mortality risk stratification (Table 3, Models 4 and 5). After the serum β2MG level was added to the base model, the serum β2MG level (P < 0.01), age (P < 0.0001), presence of diabetes (P< 0.05), and the serum albumin level (P< 0.05) were all found to be significantly associ-ated with 2-year all-cause mortality (Table 3, Model 6). Model 7 is the optimal model and included con-ventional markers in the base model and all novel biomarkers that exhibited significance in Models 2–6. In Model 7, age (HR: 1.08, P < 0.0001), presence of diabetes (HR: 1.78, P < 0.05), Log NT-proBNP (HR: 2.17, P < 0. 001), Log hsCRP (HR: 1.73, P < 0.05), and β2MG (HR: 1.04, P< 0.05) were all found to be significantly associated with 2-year all-cause mortality, but the serum albu-min level was not (HR: 0.77, P = 0.43). Figure 1 shows the receiver operating characteristic (ROC) curves for the prognostic performance of predicting 2-year all-cause mortality from models 1–7 in Table 3. During the addition of individual novel bio-markers to the base model, Model 2 (the addition of Log NT-proBNP) had large impact on the model’s fit (AIC: 254.8 vs. 272.6) and discriminatory ability, the latter of which improved by 4.4% compared with the base model (C-statistics: 0.820 vs 0.776, P< 0.05) (Model 2). The C-statistics were not signif-icantly improved in Models 3, 4, 5 and 6. The
T ABLE 2. Un ivariate and multivariate Cox pr oport ional hazar d models of 2-y ear all-cause mortality or 2-y ear car diovascular (CV) mortality in pr evalent hem odialysis patients (N = 307) based on conventional risk factors A. Con ventiona l risk facto rs for all-c ause mo rtality B. Con vention al risk fact ors for CV mortalit y Un ivariate ana lysis Mu ltiva riate analys is Univa riate ana lysis M ultivariate ana lysis H R (95%C I) P HR (95% CI) P HR (95% CI) P HR (95% CI) P Ag e (yea rs) 1.0 7 (1.05 –1.10) < 0.0 001 1.06 (1. 04 –1.09) < 0.0001 1.10 (1.05 –1.14) < 0.0001 1.08 (1.04 –1.1 3) < 0.000 1 Sex (male) 0.6 3 (0.06 –0.39) 0.0 6 0.74 (0. 42 –1.32) 0.30 0.55 (0.25 –1.21) 0.14 D ialysis vintag e (mon ths) 1.0 0 (0.99 –1.00) 0.7 9 1.00 (0.99 –1.01) 0.29 Pre sence of diabe tes 1.5 7 (0.96 –2.54) 0.0 7 1.91 (1.1 1– 3.31) < 0.05 1.00 (0.42 –2.21) 1.00 U rinary volu me (mL /day) 0.9 9 (0.99 –1.00) < 0.0 5 1.00 (0. 99 –1.00) 0.18 1.00 (0.99 –1.00) 0.17 Kt /V urea (/sess ion) 1.7 0 (0.55 –5.01) 0.3 5 2.1 1 (0. 34 –1 1.64) 0.42 Seru m albu min (g/L) 0.2 2 (0.13 –0.38) < 0.0 001 0.51 (0. 27 –0.99) < 0.05 0.21 (0.09 –0.53) < 0.01 0.45 (0.17 –1.2 8) 0.13 Seru m phos pha te (mmol/L) 0.7 8 (0.65 –0.93) < 0.0 1 0.92 (0. 76 –1.12) 0.41 0.94 (0.70 –1.26) 0.67
decrease in AIC (247.2 vs. 272.6) and a 5.7 % in-crease in C-statistics (0.833 vs. 0.776, P < 0.01) for 2 year all-cause mortality were observed in Model 7 (the optimal model). The 2-year cut-off values in the non-survivor group vs. survivor group were as follows; age; 68 vs. 70 years old, serum albumin; 36 vs. 36 g/L, NT-proBNP; 8742 vs. 2947 ng/mL, high-sensitivity CRP 3.79 vs. 10.40 mg/L, β2-MG; 31.9 vs. 27.5 mg/L, which resulted in sensitivity and specificity values of 94.4% and 69.1% in both groups (data for the non-survivor group are shown in Figure 2, while data for the survivor group are not shown).
Kaplan–Meier 2-year survival curves for prevalent HD patients based on the baseline cut-off values of non-survivors group for each of the parameters in-cluded in the optimal model (Table 3, Model 7) are shown in Figure 2.
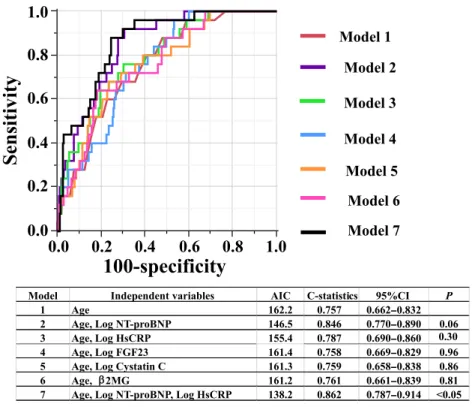
Predictive models of 2-year CV mortality in preva-lent HD patients based on conventional and novel biomarkers were assessed by Multivariate Cox pro-portional hazards regression analyses (Table 4). During the addition of individual novel biomarkers to the base model, Log NT-proBNP (P < 0.0001) and age (P< 0.0001) showed significant association with 2-year CV mortality (Model 2). After the addi-tion of Log hsCRP to the base model, Log hsCRP (P< 0.01) and age (P < 0.0001) were found to be sig-nificantly associated with 2-year CV mortality (Model 3). Conversely, Log FGF23, Log cystatin C, and the β2MG level (Models 4–6) were not shown to be signif-icantly associated with 2-year CV mortality after their addition to the base model. Model 7 is the optimal model, and included conventional marker in the base model and all of novel biomarkers that exhibited sig-nificance in Models 2–6. In Model 7, age (HR: 1.09, P < 0.0001) and the serum Log NT-proBNP level (HR: 4.79, P < 0.0001) were demonstrated to be significantly associated with 2-year CV mortality, al-though the association between the serum Log hsCRP level and 2-year CV mortality was not significant (HR: 1.81, P = 0.09). Figure 3 shows the ROC curves for the prognostic performance of predicting 2-year CV mortality from models 1–7 in Table 4. Compared with the base model (Model 1), the C-statistics were not significantly improved in Models 2, 3, 4, 5 and 6. Compared with the base model, the decrease in AIC (138.2 vs. 162.2) and 10.5 % increase in C-statistics (0.862 vs. 0.757, P< 0.05) were observed in Model 7, and the optimal cut-off values in the 2 year-CV death and survivor groups were the same and for age, NT-proBNP, and hsCRP were 81 years, 5335 ng/mL, and 0.75 mg/L, respectively. These cut-off points resulted in sensitivity 88.0 vs. 75.5% and specificity
T ABLE 3. Pr ed ictive models of 2-year all-cause mortality in pr evalent hemodialysis patients composed of conventional and novel biomarkers (N = 307). Model 1 Model 2 Model 3 Model 4 Model 5 Model 6 Model 7 HR (95%CI) P HR (95%CI) P HR (95%CI) P HR (95%CI) P HR (95%CI) P HR (95%CI) P HR (95%CI) P Age (years) 1.06 (1.04 –1.09) < 0.0001 1.06 (1.03 –1.09) < 0.0001 1.07 (1.05 –1.10) < 0.0001 1.06 (1.04 –1.09) < 0.0001 1.06 (1.04 –1.09) < 0.0001 1.07 (1.05 –1.10) < 0.0001 1.08 (1.05 –1.1 1) < 0.0001 Presence of DM 1.64 (1.00 –2.69) < 0.05 1.49 (0.91 –2.46) 0.16 1.84 (1.1 1– 3.05) < 0.05 1.65 (1.00 –2.73) 0.05 1.64 (1.00 –2.70) 0.05 1.80 (1.09 –2.96) < 0.05 1.78 (1.06 –2.98) < 0.05 Serum albumin (g/L) 0.41 (0.22 –0.76) < 0.01 0.53 (0.29 –0.97) < 0.05 0.57 (0.30 –1.09) 0.09 0.41 (0.22 –0.76) < 0.01 0.41 (0.22 –0.77) < 0.01 0.51 (0.27 –0.97) < 0.05 0.77 (0.40 –1.47) 0.43 Log NTproBNP (pg/mL) 2.56 (1.70 –3.85) < 0.0001 2.17(1.39 –3.39) < 0.001 Log hsCRP (mg/L) 1.96 (1.26 –3.05) < 0.01 1.73 (1.1 1– 2.70) < 0.05 Log FGF23 (ng/mL) 1.02 (0.74 –1.41) 0.89 Log cystatin C (ng/mL) 1.15 (0.04 –35.52) 0.94 β2MG (mg/L) 1.06 (1.02 –1.10) < 0.01 1.04 (1.00 –1.09) < 0.05 All abb reviations are the sam e a s in T able 1. CI, confid ence in terval; D M , d iabetes mell itus; HR, haz ard ratio.
FIG. 1. The receiver operating characteristic curves showing the prognostic performance of predicting 2-year all-cause mortality for models 1–7 (in Table 3). Note that C-statistics of the model 2 (P < 0.05) and the model 7 (P < 0.01) are significantly higher than that derived from the base model (model 1). AIC, Akaike information criterion; DM, presence of diabetes mellitus; P, probability compared with C-statistics for model 1. [Color figure can be viewed at wileyonlinelibrary.com]
N N N N N N N N N N P N N P P P P P
FIG. 2. Kaplan–Meier 2-year survival curves of prevalent HD patients. The groups were divided based on the cut-off values of each marker for non-survivors group in the best model (model 7 in Table 3). [Color figure can be viewed at wileyonlinelibrary.com]
values of 75.5 vs. 88.0.%, respectively in 2 year-CV death vs. survivor groups (data not shown).
DISCUSSION
It is reported that good diagnostic tests are charac-terized by C-statistics values of >0.8 (16). In our study, a model consisting of age, diabetes, and the se-rum levels of albumin and NT-pro BNP (the signifi-cant model for 2-year all-cause mortality), a model consisting of age, diabetes, and the serum levels of al-bumin, NT-proBNP, hsCRP, andβ2MG (the optimal model for predicting 2-year all-cause mortality), and a model consisting of age and the serum levels of NT-proBNP and hsCRP (the optimal model for predicting 2-year CV mortality) exhibited C-statistics values of 0.820, 0.833, and 0.862, respectively, whereas the base models for 2-year all-cause mortal-ity and CV mortalmortal-ity did not reach the 0.8 C-statistics threshold.
The cut off point for serum albumin levels in both groups (survivors and non-survivors) was 36.0 g/L in HD patients in the present study, and the multivari-ate adjusted population-attributable fraction of death due to baseline serum albumin< 3.8 g/dL was 19% in a 2-year cohort of 58058 maintenance HD patients (17). The relationship observed between low serum albumin levels and mortality in HD patients may be due to cachexia, which is known to be responsible for the worse survival of these patients (18).
Previously, there have been many reports about the associations between elevated serum NT-proBNP levels and all-cause or CV mortality in HD patients (5–8). The elevated serum NT-proBNP levels have dual significance as a marker of LVH and fluid volume overload, both of which are known to have a great impact on all-cause and CV mortality in HD patients (5,19). We measured all biomarkers at baseline only, just before the beginning of the first week’s HD session and considered the pre-HD levels of NT-proBNP to be higher than post-HD levels reflecting high values; however, the pre-HD levels of NT-proBNP were also predictive of mortal-ity, as previously reported (5). A previous study showed that an extracellular water (ECW) excess be-fore dialysis was strongly associated with mortality, and these patients also had increased ECW after dial-ysis (19). From a clinical perspective, it is important to keep in mind that our NT-proBNP cut-off values (8742 pg/mL for 2-year all-cause mortality and 5335 pg/mL for 2-year CV mortality) have high sensi-tivity (94.4%, 88.0%, respectively) and acceptable specificity (69.1%, 88.0%, respectively). The NT-proBNP cut-off value for 2-year all-cause mortality
T ABLE 4. Pr edictive models of 2-y ear car diovascular mortality in pr evalent hemodialysis patients composed of conventional and novel biomarkers (N = 307). Model 1 Model 2 Model 3 Model 4 Model 5 Model 6 Model 7 HR (95%CI) P HR (95%CI) P HR (95%CI) P HR (95%CI) P HR (95%CI) P HR (95%CI) P HR (95%CI) P Age (years) 1.10 (1.05 –1.14) < 0.0001 1.09 (1.05 –1.14) < 0.0001 1.10 (1.06 –1.15) < 0.0001 1.10 (1.06 –1.15) < 0.0001 1.10 (1.06 –1.14) < 0.0001 1.10 (1.06 –1.14) < 0.0001 1.09 (1.05 –1.14) < 0.0001 Log NT -proBNP (pg/mL) 5.30 (2.77 –10.12) < 0.0001 4.79 (2.42 –9.48) < 0.0001 Log hsCRP (mg/L) 2.55 (1.29 –5.04) < 0.01 1.81 (0.92 –3.55) 0.09 Log FGF23 (ng/mL) 1.26 (0.76 –2.10) 0.38 Log cystatin C (ng/mL) 4.93 (0.01 –2292.56) 0.61 β2MG (mg/L) 1.06 (0.99 –1.13) 0.10 All abb reviations are the sam e a s in T able 1. CI, confid ence in terval; H R , hazar d ratio.
identified in this study were comparable with the value used in the previous studies (5,7,20).
The results of previous studies regarding the im-pact of serum hsCRP concentrations on mortality in end-stage renal disease patients were not consistent. It is reported that hsCRP is a significant predictor of all-cause mortality in incident HD patients (6) and prevalent HD patients (8). While, Oh et al. (7) and Madsen et al. (5) reported that hsCRP was not a significant predictor of all-cause mortality in inci-dent HD patients and prevalent HD patients, respec-tively. The current study found that hsCRP is associated with the risk of 2-year all-cause and CV mortality in prevalent HD patients, although NT-proBNP, demonstrated to be the most powerful biomarker.
In the present study, the optimal model for predicting 2-year all-cause mortality including serum β2MG levels is consistent with previous findings (13). β2MG may be directly, rather than indirectly, for ex-ample, as a surrogate of RRF, implicated in the greater morbidity and mortality associated with end stage kidney disease (21).
FGF23 has been included in the statistical analysis and did not have a significant impact on mortality in this study, which is in contrast to previous findings (9,10). Olauson et al. (22) reported that no associa-tion exists between high serum FGF23 levels and mortality in HD patients, which is consistent with our findings. Furthermore, non-diabetes mellitus
patients were found to have higher plasma FGF23 levels than diabetes mellitus patients (23). The dis-crepancies between the results of these studies might be partly explained by differences in gender, previ-ous CV diseases, residual renal function levels (22), variations in the prevalence of diabetes (23), and ra-cial differences (9).
Cystatin C was less influenced by factors other than glomerular filtration rate (24), and is consid-ered to be a significant predictor of all-cause mortality and CV events in non-dialysis chronic kidney disease patients (6) and incident dialysis patients (24). In our study, 77.9% of the subjects exhibited urinary volumes of <100 mL/day, and the addition of cystatin C to the base model did not improve the model’s ability to predict 2-year all-cause or CV mortality in prevalent HD patients with depleted renal function.
This study had several limitations. First, since the subjects were all Japanese prevalent HD patients, the associations detected between various bio-markers and mortality might not be applicable to other populations. Second, the sample size and num-ber of adverse events were relatively small, and therefore, the Cox regression analysis was restricted to a limited number of potential confounders. Third, the biomarker measurements were only performed once. Therefore, it was difficult to examine whether the changes in the levels of the biomarkers had any impact on clinical outcomes.
FIG. 3. The receiver operating characteris-tic curves showing the prognoscharacteris-tic perfor-mance of predicting 2-year cardiovascular mortality for models 1–7 (in Table 4). Note that only C-statistic of the model 7 (P< 0.05) is significantly higher than that de-rived from the base model (model 1). AIC, Akaike information criterion; P, probability compared with C-statistics for model 1.
[Color figure can be viewed at
CONCLUSIONS
The addition of novel biomarkers, i.e., N-terminal pro-brain natriuretic peptide alone or NT-proBNP, high-sensitivity C-reactive protein, and β2MG as a panel, to a conventional risk model (age, presence of diabetes, serum albumin) significantly improved the prediction of 2-year all-cause mortality, and the addition of novel biomarkers, i.e., N-terminal pro-brain natriuretic peptide and high-sensitivity C-reactive protein as a panel, to a conventional risk model (age) significantly improved the prediction of 2-year cardiovascular mortality in Japanese prevalent hemodialysis patients.
Acknowledgments: The authors are grateful to Dr. Kohji Usui and Dr. Chie Tangi of Ichiyokai Clinic, Ichiyokai, Hiroshima, Japan, for their intensive support. There was no specific funding.
Conflicts of Interest: The authors have no conflicts of
interest to declare.
REFERENCES
1. US Renal Data System. 2016 Annual Data Report. Mortality (https://www.usrds.org/). Am J Kidney Dis 2016;67:S1–434. 2. Masakane I, Nakai S, Ogata S et al. Annual Dialysis Data
Report 2014, JSDT Renal Data Registry (JRDR). Renal Replacement Therapy 2017;3:18.
3. Pippas M, Kramer A, Noordzij M et al. The European Renal Association– European Dialysis and Transplant Association Registry Annual Report 2014: a summary. Clin Kidney J 2017:1–16.
4. Kimata N, Tsuchiya K, Akiba T, Nitta K. Differences in the Characteristics of Dialysis Patients in Japan Compared with those in Other Countries. Blood Purif 2015;40:275–9. 5. Madsen LH, Ladefoged S, Corell P, Schou M, Hildebrandt
PR, Atar D. N-terminal pro brain natriuretic peptide predicts mortality in patients with end-stage renal disease in hemodial-ysis. Kidney Int 2007;71:548–54.
6. Levin A, Rigatto C, Barrett B et al. Biomarkers of inflamma-tion, fibrosis, cardiac stretch and injury predict death but not renal replacement therapy at 1 year in a Canadian chronic kid-ney disease cohort. Nephrol Dial Transplant 2014;29:1037–47. 7. Oh HJ, Lee MJ, Lee HS et al. NT-proBNP: is it a more signif-icant risk factor for mortality than troponin T in incident he-modialysis patients? Int J Artif Organs 2015;38:69–75. 8. Apple FS, Murakami MM, Pearce LA, Herzog CA.
Multi-biomarker risk stratification of N-terminal pro-B-type natriuretic peptide, high-sensitivity C-reactive protein, and cardiac troponin T and I in end-stage renal disease for all-cause death. Clin Chem 2004;50:2279–85.
9. Gutiérrez OM, Mannstadt M, Isakova T et al. Fibroblast growth factor 23 and mortality among patients undergoing he-modialysis. N Engl J Med 2008;359:584–92.
10. Jean G, Terrat JC, Vanel T et al. High levels of serum fibro-blast growth factor (FGF)-23 are associated with increased mortality in long haemodialysis patients. Nephrol Dial Trans-plant 2009;24:2792–6.
11. Hoek FJ, Korevaar JC, Dekker FW, Boeschoten EW, Krediet RT. Estimation of residual glomerular filtration rate in dialysis patients from the plasma cystatin C level. Nephrol Dial Trans-plant 2007;22:1633–8.
12. Termorshuizen F, Dekker FW, van Manen JG et al., NECOSAD Study Group. Relative contribution of residual renal function and different measures of adequacy to survival in hemodialysis patients: an analysis of the Netherlands Coop-erative Study on the Adequacy of Dialysis (NECOSAD)-2. J Am Soc Nephrol 2004;15:1061–70.
13. Okuno S, Ishimura E, Kohno K et al. Serum beta2-microglobulin level is a significant predictor of mortality in maintenance haemodialysis patients. Nephrol Dial Transplant 2009;24:571–7.
14. Bozdogan H. Akaike’s Information Criterion and Recent De-velopments in Information Complexity. J Math Psychol 2000;44:62–91.
15. Grund B, Sabin C. Analysis of biomarker data: logs, odds ra-tios, and receiver operating characteristic curves. Curr Opin HIV AIDS 2010;5:473–9.
16. Swets JA. Measuring the accuracy of diagnostic systems. Sci-ence 1988;240:1285–93.
17. Kalantar-Zadeh K, Kilpatrick RD, Kuwae N et al. Revisiting mortality predictability of serum albumin in the dialysis popu-lation: time dependency, longitudinal changes and population-attributable fraction. Nephrol Dial Transplant 2005;20:1880–8. 18. Reid J, Noble HR, Porter S, Shields JS, Maxwell AP. A literature review of end-stage renal disease and cachexia: understanding experience to inform evidence-based healthcare. J Ren Care 2013;39:47–51.
19. Tangvoraphonkchai K, Davenport A. Pre-dialysis and post-dialysis hydration status and N-terminal pro-brain natriuretic peptide and survival in haemodialysis patients. Int J Artif Organs 2016;39:282–7.
20. Artunc F, Nowak A, Müller C et al. Mortality prediction using modern peptide biomarkers in hemodialysis patients--a com-parative analysis. Kidney Blood Press Res 2014;39:563–72. 21. Roumelioti ME, Nolin T, Unruh ML, Argyropoulos C.
Revisiting the Middle Molecule Hypothesis of Uremic Toxic-ity: A Systematic Review of Beta 2 Microglobulin Population Kinetics and Large Scale Modeling of Hemodialysis Trials In Silico. PLoS One 2016;11 e0153157.
22. Olauson H, Qureshi AR, Miyamoto T et al. Relation between serum fibroblast growth factor-23 level and mortality in inci-dent dialysis patients: are gender and cardiovascular disease confounding the relationship? Nephrol Dial Transplant 2010;25:3033–8.
23. Kojima F, Uchida K, Ogawa T, Tanaka Y, Nitta K. Plasma levels of fibroblast growth factor-23 and mineral metabolism in diabetic and non-diabetic patients on chronic hemodialysis. Int Urol Nephrol 2008;40:1067–74.
24. Shin MJ, Song SH, Kwak IS et al. Serum cystatin C as a predictor for cardiovascular events in end-stage renal disease patients at the initiation of dialysis. Clin Exp Nephrol 2012;16:456–63.