Enteropathogenic Escherichia coli (EPEC) Infection in Kenya
Masahiko EHARA1, Shigenori WATANABE1 Yoshio ICHINOSE2, Shoichi SHIMODORI3,
Kibue Ali Ahamed MURIITH4 and Florence Chepkimoi SANG4
Abstracts: About two thousands of rectal swab‑specimens were examined for enteropa‑
thogenic Escherichia coli (EPEC) in rural area in Kenya in 1983 by using 28 of mono‑
valent antisera which were commercially available. According to the results obtained, there was no significant difference in the isolation rate of EPEC strains (about 20%) be‑
tween diarrheal patients and healthy individuals. No marked difference was also observed in the isolation rate by age‑group as well as by sex. The most dominantly isolated strain of EPEC was O27: K+ which is a well known enterotoxigenic Escherichia coli (ETEC).
Most of EPEC strains isolated were identified as ETEC and some were enteroinvasive Escherichia coli (EIEC) by serotyping alone. In the three surveys with 2‑3 months in‑
terval carried out for the fixed populations, the same serotype as found in the former survey was not isolated from the same individual. Although nineteen cases showed EPEC positive more than twice during the surveys. The isolation rate of EPEC in food‑handlers working at the hotels in the South Coast was 20%, although they were healthy without
diarrhea.
Key words: EPEC, Epidemiology.
Department of Bacteriology, Institute of Tropical Medicine, Nagasaki University‑ 12‑4 Sakamoto‑machi Nagasaki, Japan 852 Department of Bacteriology, School of Medicine, University of the
Ryukyu‑ Nishihara‑machi, Okinawa. Japan 903‑01 Department of Microbiology, School of Health Sciences, Kyushu
University, Higashi‑ku, Fukuoka, Japan 812 4 Centre for Microbiology Research, Kenya Medical Research
lnstitute (KEMRI), P. O. 5o^ 5462S, Nairobi, Kenya
Received for Publication, January 21, 1986
Contribution No. 1795 from the Institute of Tropical Medicine, Nagasaki University.
I NTRODUCTION
EPEC are defined as diarrheagenic E. coll belonging to serogroups epidemiologically incriminated as pathogen but whose pathogenic mechanisms have not been proven to be related either to heat‑labile enterotoxins (LT) or heat‑stable enterotoxins 〔ST) or to Shigella‑like invasiveness. In this paper EPEC mean socalled EPEC by Kauffman's serotyp‑
ing scheme. EPEC appear to have become less frequent in developed, countries except in‑
fantile diarrhea, they may have persisted as an important cause of sporadic diarrhea in developing countries. Our work was designed to provide epidemiological information of EPEC in rural area in Kenya in 1983.
MATERIALS AND METHODS
EPEC surveys were conducted three times in Kwale District, Coast Province, Ken‑
ya to know the present status oJ EPEC infection such as the infection rate, dominant
Fig. 1. Map of Kenya.
SUDAN
ETHIOPIA
UGANDA
LAKE VICTORL
紅isumu
らay
rNairobi
0 100 200 km
■ ■ l⊥‑ J
TANZANIA
SOMALIA
E【コuator
/Mombasa cKwa良
イ
」
い」「′へナ〓■
J
㌔
hT ! ∫
V
一い一べ 一,
T
¥v 十
㌔sい ^S
strains and the change of E. coli‑flora. Ractal swab specimens were taken from the fixed villagers and the students staying at the dormitory. These specimens were kept in Gary‑
Blair transport media for 1 to 2 days untill use. Three colonies per one specimen su‑
spected to be E. coli were picked up from BTB or SS agar plates (Eiken products〕 and re‑inoculated on BTB agar plates. Then they were sero‑typed by slide agglutination a‑
gainst EPEC typing antisera (Denka Seiken No. 1 and No. 2). During the surveys health status of the objective individuals were checked by medical doctors. EPEC were
a一so examined in the same manner as mentioned above through the other surveys such as
ETEC, Campylobacter jejuni and Vibrio cholerae.
RESULTS
Abbreviations used in the Table and Figure were as follow : LD ; Likoni Dispensary, WD ; Waa Dispensary, ND ; Ngombeny Dispensary, MD ; Matuga Dispensary, KH ; Kwale Subdistrict Hospital, TH; Tiwi Health Centre, MV; Mvita Clinic, CG; Coast General Hospital, KF; Kwale Field, DB; Hotels in Diani Beach, HA, HB, HC; fields used for the cholera survey in South Nyanza. Tentative sero numbers used in the Table and Figure wereas follows: 1. 026: K60,2. O86a: K61,3. 086: K62,4. O127a: K63,5. O136:
K78,6.O144: Kx2,7.O55: K59,8.0111: K58, 9. Ol12: K66,10.Ol19:K69,ll.
O124:K72,12. O146: K89,13. O28:K?3,14. 044: K74,15. O125: K70,16. O126. K71,17.
O128: K67,18. O143: Kxl,19. Ol: K51,20. O6: K15,21. O25: Kl,22. O27: K+,23.
Ol14: K90,24. O142:K+,25. O148:K+,26. O152:K+,27. O159: K+,28. O164:.+.
When the rectal swab specimens were taken during the 3 surveys, all individuals were healthy without diarrhea.
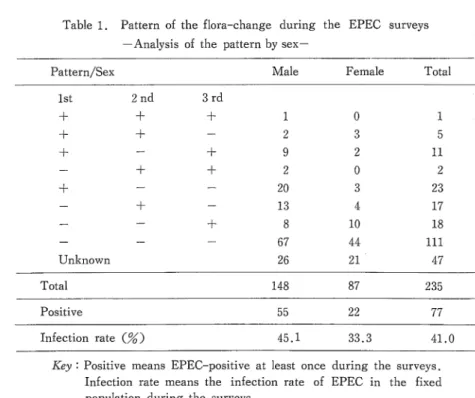
Table 1 showed the pattern analysis by sex. Only one case showed EPEC positive in each survey. Forty one percent of the fixed population showed EPEC positive at least once during the surveys. The Infection rate of EPEC was relatively high in male than in female. Table 2 showed the pattern analysis by age‑group. Age‑groups were divided into six tentative groups such as o「2, 3‑5, 6‑12, 13‑19 and 20「39, over 40 years. The
infection rate of 13 to 19 years of age―group seemed relatively high compared with the
other group. They were the students of a secondary school staying at the domitory. In this dormitory, most of the strain No. 22 were isolated. This finding suggested that there was a long「lasting small outbreak due to EPEC strain of O27: K‑f‑ as shown in Table 3 Table 4 and 5 showed the summarized data of EPEC from various sources in Kenya.
Rectal swab specimens from diarrheal patients were collected at medical facilities from LD to CG, on the other hand specimens from nondiarrheal individuals were from KF to GK shown in Table 4. Most dominant EPEC strain isolated was Sero No. 22, O27: K+.
Relatively dominant strains were O26: K60, O44: K74, O125: K70, 0128: K67, Ol:
K51, O142: K+, and O148: K+.
Every strain which corresponds to EPEC typing sera used was isolated in 1983 as
Table 1. Pattern of the flora‑change during the EPEC surveys
‑Analysis of the pattern by sex―
Pattern/Sex Male Female Total 1st
+ + +
+
Unknown 2nd
+ +
+
+
3rd 十
+ +
+
1 2 9 2 20 13 8 67 26
0 3 2 0 3 4 10 44 21
1 5 ll 2 23 17 18 111 M Tota1 148 87 235
Positive 55 22 77
Infection rate 〔%) 45.1 33. 41.0
Key 'Positive means EPEC‑positive at least once during the surveys.
Infection rate means the infection rate of EPEC in the fixed population during the surveys.
Table 2. Pattern of the flora―change during the EPEC surveys
‑Analysis of the pattern by age‑group‑
Pattern/Age‑Group 0‑2 ― 6‑12 13〓1 9 20‑39 40‑
1st 2nd + + + + +
+ +
+
Unknown 3rd
+
+ +
+
0 0 0 0 3 1 2 4 2
0 1 0 0 2 0 1 10 2
1 1 1 0 2 1 2 21 10
0 1 7 2 OE 10 8 37 14
0 2 0 0 2 3 4 31 14
0 0 3 0 0 2 1 8 5
1 5 ll 2 23 17 18 111 47
Positive 8 77
Infection rate {%〕 42.9 41.0
Tota
Tota1 12 16 39 93 56 19 235
42 11 60.0 28.6 27. 53.2 26.2
Table 3. Sero‑type of enteropathogenic E. coli isolated in Kwale in 1983
seroNo.とrstsurveysecondsurveyThirdsurveyTota1 14/3‑3/4)(23/5‑4/6)(ll/9‑23/9)
ユ
1 2 3 4 5 6 7 8 9 10 ll 12 13 IE 55 16 17 18 19 20 21 22 23 24 25 26 27 28
5 1 2 1 1 0 3 0 0 1 1 0 2 0 2 0 4 0 3 1 2 9 1 5 4 0 0 3
2 1 1 3 0 2 0 0 0 1 0 0 1 3 1 0 0 0 1 1 0 7 0 1 2 1 1 2
1 0 1 1 1 0 1 0 0 0 0 2 0 4 4 3 2 2 3 0 4 3 0 2 1 0 0 1
8 2 4 5 2 2 4 0 0 2 1 2 3 7 7 3 6 6 7 2 6 19 1 8 7 1 1 6
Positive 5 1 Negative 180 D.I.
118 536 6
Total samples 229 220 199
Key: D.I. means double infection with different serotypes of EPEC.
31 190 1
36 166 3
648
shown in Table 4 and Fig. 2. A small variation in the infection rateofEPEC bylocation was observed as shown in Fig. 3 however the infection rate by age‑group showed no significant difference as shown in Fig. 4. The infection rate by sex was observed relative‑
ly higher in male than female. Thirty four strains 〔8.7%) were identified as EIEC by se‑
ro‑type alone as shown in Table 6
Table 4, Sero‑type of enteropathogenic E. coli isolated in Kenya in 1983 Sero No. LD WD ND MD KH TH MV CG KF DB HA HB HC GK
1 2 3 4 5 6 7 8 9 10 Ill 12 13 14 15 16 17 18 19 20 21 22 23 24 25 26 27 28
0 0 0 0 0 0 10
0 0 0 0 0 0 0 0 0 0 0 0 0 0 0 0 0
0 0 0 0 0 0 o o o o o o o o 0 0 0 0 o o o o o o o o 0 0 0 0 0 0 0 0 0 0 0 0 0 0 0 0 0 0 0
O 0 0 0 0 0 0 0 O 0 0 0 0 0
O 0 0 0 0 0 I 0 0 0
0 0 0 0
O O 13 0 0 0 0 0 0 0 0 0 0 0 0 0 0 0 0 0 0 11 0 0 0 0
0 0 0 0 11
o o o o o o 0 0 0 0 O 0
O 0 0 0 0 0 O 0 0 0 0 0
19
0 0 0 0 0 0 0 0 0 0 0 0 0 0 0 0 0 0
0 0
0 0 0 0 0 0 0 0 0 0 0 0 0 0
23 6 10 15 4 2 15 6 4 7 7 ll 12 26 20 18 29 5 21 8 13 41 13 22 22 13 8
9
EPEC(H‑) D.I.
EPEC(‑ )
10 13 40 105 118 36 17 10 0 0
25 37 12 14 44 21 190 453 536 111 52 68 45 30 390
23 1,638
Total 28 228 554 648 144 60 82 54 37 2,005
Total
33 4‑7 16 19 55
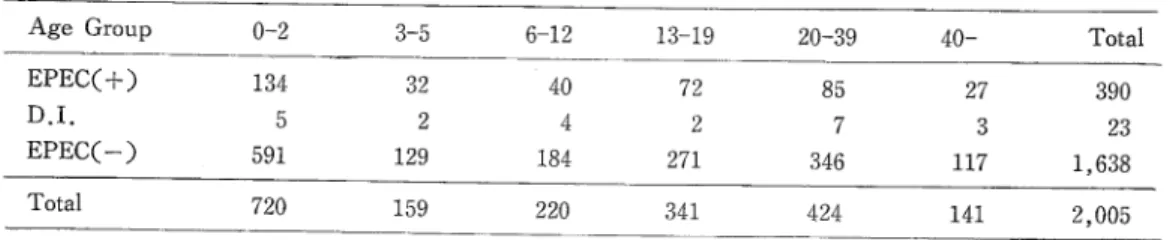
Table 5. Age and sex distribuion of EPEC Infecion
Age Group o‑2 3‑5 ‑12 13‑19 20‑39 40‑ Total EPECC +〕 134 32 40 72 85 27 390 D.I. 23
EPECト 591 129 184 271 346 117 1 , 638
Tota1 720 159 220 341 424 141 2, 005
D.I. means double infection with different sero‑types of EPEC.
Sex Male Female Total EPEC〔+) 263
D.I. 17 EPEC(‑〕 996 Tota1 1 , 274
127 390 6 23 642 1,638
763 2,005
Table 6. Enteroinvasive Escherichia colt (EIEC)
Sero‑type Numbers of strains O28a,c : K73
Ol12a,c : K66 0124 : K72 0136 : K78 0143 : K×1 0144 : K×2 Total number
B.O.S./I・R・ 0 10
LD ivra ND MD KH TH MV CG KF DB HB GK
12 4 7 4 5 2
Fig. 2. Infection rate of enteropathogenic Et coli by location in Kenya.
34
20 30 鵬 糊
…≡
■=――〓‖ ― ― ― o―― ―― 〓―
―――――― ―― ― ―― 二
Serotype / rb.O
I 2 3 4 5 6 丁 8 9 10 ll 12 13 14 15 16 1丁 18 19 20 21 22 23 ヱ叫 25 26 2丁 28
10 20 30 40 50
■ ● ● ● ●
Fig. 3. Serotype of enteropathogenic E. coli isolated in Kenya in 1983.
Fig. 4. Infection rate of enteropathogenic E. cell by age and sex.
「. I+一 1' 二 ' =
匡
「―――― ――三
l■
L二二二二=二二]
l■■
―――――――――――――――――――――――――――――⊥
工=::コ
■――■
‖ ― ― ―――――――一 ― ―― ― ― ― ― ‥―――――― ―――――― ― ―― ― ―― ― 〓―― ― ― ―
Age‑group, se
O ‑ 2 3 ‑ 5 6 ‑12 13‑19 20 ‑39 斗0 ‑ male female
「"― 10 ―..―巾―仙 20 ?‑. ,̲上型=, 1 10 20
二―――――――――――――――――――――――――――――――――――――――――――――――――――――――――――――――――――――――――――――――――――」
二――――――――――――――――――――――――――――――――――――――――――――――――――――――――――――――――――――――――――――――――――――――――――――――⊥
――――――――――――――――――――――――――――――――――――――――――――――――――――――――――――――――――――――――――――――――――――――――――――――――――――――――――――――――――――――――⊥
二―――――――――――――――――――――――――――――――――――――――――――――――――――――――――――――――――――――――――――――――――――⊥
二二――――――――――――――――――――――――――――――――――――――――――――――――――――――――――――――――――――――――――――――――――――――――――⊥
――――――――――――――――――――――――――――――――――――――――――――――――――――――――――――――――o=‥―――――――――――――――――――――――――――⊥
二――――――――――――――――――O
≡――――――――――――――――――――――――――――――――――――――――――――――――――――――――――――――――――⊥
DISCUSSION
Three pilot areas were set up to know the real status of bacterial diarrheal diseases in rural Kenya. The first one was in Kwale District to check socalled classical enteropa「
thogens, i.e. Vibrio cholerae, Vibrio parahemolyticus, EPEC, Shigella Salmonella and Kl‑
ebsiella. The second one was in Mombasa to check Campylobacter jejuni and ETEC in addition to the classical enteropathogens. The third one was in South Nyanza to obtain the epidemiological information on cholera. Data concerning C. jejuni, ETEC and cholera have been reported elsewhere (Shimotori et al., 1984; Watanabe et al., 1984; Ehara et al.9 1985; Ichinose, 1985).
A workshop on enteropathogenic Escherichia coll was held at the National Institute of Health 〔NIH〕, Bethesda, Md. The summary of the workshop was reported from the
National Institute of Allergy and Infectious Diseases (Edelman et al., 1983). Referring to the above report, we discussed our results.
Change of EPEC‑flora: People in develop!腸countries seemed to face the dangerous cir「
cumstance full of EPEC. Four EPEC positive individuals were found with different sero―
types in a family composed of 5 members. The change of EPEC―flora was observed in the
second and third survey. These findings suggest that the individuals in developing counト ries are frequently exposed to EPEC and change their flora of E. coll one after another Outbreak: O23 :K+ strain of EPEC was found dominantly in the first and the second sur「
vey, even in the third survey at the dormitory of a secondary school. This fact shows that EPEC strains are maintained in a closed circumstance causing a long‑lasting outbreak.
Infection rate: There was no significant difference in the infection rate between age‑
groups and between diarrheal patients and healthy individuals. No marked difference was also observed in the rate by sex. Above data suggest that EPEC strains isolated from diarrheal patients do not necessarily mean causal pathogens, although attention must be paid for their isolation from infantile diarrhea! cases. why was there no change in the infection rate among age「groups? If they aquire the protective immunity against EPEC, the infection rate must change in accordance with their age. We supposed that the in‑
dividuals in developing countries are exposed frequently to many strains of EPEC through「
out the year. The infection rate of food‑handlers working at the different hotels in South
Coast was 25 perce叫however they were quite healthy without diarrhea. Tourists from
developed countries will suffer from diarrhea, once they take foods contaminated with EP‑
EC. For they do not have the protective immunity. As a matter of fact, food‑handlers are educated strictly in the hygienic practice. Therefore, the possibility for sightseers to have diarrhea is not necessarily high. As the result of our work, we recommended health edu‑
cation for the youth to protect not only themselves but also their infants from diarrheal diseases,
A CKNOWLEDGEMENTS
The authors would like to thank the Government of Kenya for enabling them to conduct the present study, and the Ministry of Health for the full support of the project.
special thanks are due to Prof. M. Mugambi, Director of Kenya Medical Research In‑
stitute (KEMRI〕 who assisted in every stage and aspect of the present study. Finally we express our gratitude to Japan International Cooperation Agency (JICA〕 for giving us the chance to work on the present study.
REFERENCES
1) Edelman, R. & Levine, M. M. (1983): From the National Institute of Allergy and Infectious Diseases‑ Summary of a workshop on enteropathogenic Escherichia coli. J. Infect. Dis. , 147 (6), 1108‑1118.
2) Ehara, M‥ Watanabe, S., Ichinose, Y., Shimodori, S., Siongok, T. K. arap, Muriith, Kibue A. A. and Sang F. C. (1985): Epidemiological observation of cholera in rural Kenyain 1983.
Trop. Med., 27 (4), 229‑240.
3 ) Ichinose, Y. (1985): Geographical and chronological changes of biological properties especially hemolysis to sheep erythrocytes among Vibrio cholerae O‑1. Trop. Med., 27 (2), 53‑66 (in Japanese with English abstract).
4) Shimotori, S., Ehara, M., Watanabe, S., Ichinose, Y., Kibue, A. A. and Sang, F. C. (1984):
survey on enterotoxigenic Escherichia coli and Campylobacter jejuni in Kenya. The 20th Joint conference US‑Japan Cooperative Medical Science Program Cholera Panel, in press.
5) Watanabe, S., Ehara, M., Ichinose, Y., Shimotori, S., Kibue A. M., Sang, F. C. and Ngugi J. (1984): A study on enterotoxigenic Escherichia coli infection in Kenya. Trop. Med., 26 (3),
137‑145.
ケニアにおける病原性大腸菌感染
江原雅彦,渡邊繁徳(長崎大学熱帯医学研究所病原細菌学部門) 一瀬休生(琉球大学医学部細菌学教室)
霜鳥翔一 (九州大学医療技術短期大学部)
KIBUE ALI A. M., F. C. SANG (ケニア中央医学研究所)
病原性大腸菌(EPEC)の保菌者の動態を把握するため,Kwale地区の住民約400人から約3 ヵ月間隔で3回,検体(Rectal swab)を収集し,菌検索を行った.各検体からE. coliを3 colonyずつ拾って市販のEPEC抗血清(デンカ生研)による凝集で,型別を行った.毎回の本 菌陽性率は同程度で約20%であった.そのうち毎回陽性であったのは1例のみで,2回陽性は19 例であったが,いずれも異なった血清型を示していた.即ち,同一血清型株の再感染は認められ ず,病原性大腸菌の場合にもlong term immunityを考慮する必要があることを示唆するもの とみられた.sample提供者は全て健康であった.また,Cholera survey, C. jejuni survey 等で集めたE. coliも全て凝集を行い,約2,000人からのデータをまとめてEPECの保菌率, 型別,ETEC検出率,性差,年齢差,地域差,健康者と下痢患者間の検出率の相異などに検討 を加えた結果,いずれの場合にも感染率に有意の差は認められなかった.