EXPERIMENTAL STUDY ON R I V E R D Y K E B R E A C H CHARACTERISTICS DUE TO OVERTOPPING
Pawan Kumar BHATTARAI
*・Hajime NAKAGAWA
**・Kenji KAWAIKE
***・ Hao ZHANG
****EXPERIMENTAL STUDY ON RIVER DYKE BREACH CHARACTERISTICS DUE TO OVERTOPPING
Pawan Kumar B
HATTARAI*, Hajime N
AKAGAWA**, Kenji K
AWAIKE***and Hao Z
HANG****Abstract
Every year flood discharge induced overtopping flow through river dykes causes large damage to society, the environment and infrastructure. Although several researches have been conducted to understand embankment dam failure, there has been little focus on river dyke breaches. The lateral widening of the breach process and the duration time at failure are poorly understood. Therefore, preliminary laboratory tests were conducted to investigate the dynamic lateral widening process and breach characteristics. The entire process was recorded optically using video and three-dimensional cameras for detailed analysis of the breaching phenomena. The result indicates the important effect of particle size on the dynamic lateral widening process, breach discharge and the time of failure. A systematic variation of the particle size reveals important findings regarding breach characteristics. Finally, the curve for the duration time at failure is also proposed.
Key words: Dyke, Breach process, Lateral widening, Overtopping, Breach Discharge
* Student Member of JSNDS, Doctoral Student, Department of Civil and Earth Resources Engineering, Kyoto University (Katsura Campus, Nishikyo-ku, Kyoto 615-8540, JAPAN)
** Member of JSNDS, Dr. of Eng., Prof., DPRI, Kyoto University (Yoko-oji, Fushimi, Kyoto 612-8235, JAPAN)
*** Member of JSNDS, Dr. of Eng., Assoc. Prof., DPRI, Kyoto University (Yoko-oji, Fushimi, Kyoto 612-8235, JAPAN)
**** Member of JSNDS, Dr. of Eng., Assist. Prof., DPRI, Kyoto University (Yoko-oji, Fushimi, Kyoto 612-8235, JAPAN)
65
1. INTRODUCTION
A large number of embankment structures have been built by humans or formed naturally along rivers, lakes, and coastal lines throughout the world. A dyke is defined by geometric properties (e.g. height and width of the crest, slopes etc.) and by material characteristics (density, grain size diameter, cohesive strength, erodability, permeability etc.). River dykes are constructed to prevent flooding of valleys and their population and confine the flow of the river for higher and faster flow. Flooding of river valleys is a longstanding problem and numerous events still occur yearly causing both monetary and human losses. Recent major dyke failures include those of the Yangtze flood in China 1998 , the Elbe flood in Germany in 2002 , the New Orleans flood in 2005 , the Mississippi flood in 2008 , the Pakistan flood in 2010 and the Queensland flood in Australia in 2011 (Schmocker et al. 2011 ). The lack of proper repair and maintenance and increased flood discharges are important factors in the dyke failures in recent years.
From the study of past dyke breach phenomena, the failure by overtopping constitutes the primary failure modes of earth embankments besides internal erosion. The resulting breach flow is particularly dangerous and damaging to the surrounding infrastructure and the environment as it usually occurs unpredictably both on a temporal and a spatial scale. In flood defence projects, dyke breach scenarios should be accounted for in the assessment of the residual risk for the overload case, when determining the emergency action plans and the associated preparedness measures.
(Schmocker et al. 2011 )
Although the risks of dyke breach processes are known from historical incident, little research has been conducted in this field by hydraulic researchers. The main reason behind this is the complexity associated with the dyke breach
phenomena. The process of breaching is the result of the interaction between three elements, i.e.
water, soil and structure. Therefore, the breaching process differs according to hydraulic loading, material type and state as well as embankment condition (Naulin et al. 2010 ).
During breach initiation, the so-called residual strength of the dyke is consumed by different mechanisms and processes. For most authors, breach growth starts when the dyke crest lowers significantly and erosion cuts through the upstream face of the dyke. According to Morris et al. ( 2009 ), breach formation is the stage of the breaching process when rapid and continued vertical and lateral erosion of the embankment occurs. The erosion process itself is 3 -dimensional and the hydraulic conditions vary constantly.
Chinnarasri et al. ( 2003 ) observed four stages in plane dyke erosion, namely: ( 1 ) small erosion on dyke crest after initial overtopping, ( 2 ) slope sliding failure with ongoing erosion, ( 3 ) wavelike- shaped dyke profile and ( 4 ) large sediment wedge deposition with small slope at erosion end.
Recently, the Civil Engineering Research Institute for cold regions, Hokkaido, Japan performed a real scale model study in the Chiyoda Experimental Flume regarding observation of breach phenomena. They observed that the breach phenomena start with frontal shoulder erosion and accelerate in the downstream direction.
In the past several years, many studies have been
performed regarding dam breaches. The most
commonly studied breaching parameter of dams
includes depth and breach width together with the
breach side slopes or shape at the final stage. The
time at failure was reported in less than half of the
cases and often with great uncertainty. Ultimate
breach depth can be estimated with acceptable
accuracy in terms of dam height. Several
investigators have attempted to relate the elapsed
time required for failure in terms of the hydraulic
head above invert, breach height and volume of eroded materials but these are parameters that can be determined following a breach, so they are less useful for the prediction of time at failure. Given the enormous damage potential regarding dyke breaching, it is necessary to understand the damage process of dykes in detail.
As the majority of dyke breaches are due to overtopping, this is investigated in detail in the current research. Systematic breach tests were conducted at the Ujigawa Open Laborator y, Disaster Prevention Research Institute, Kyoto University, Kyoto, Japan. The main goals of this study are to establish a simple model setup for testing the pure overtopping failure mode, obtain information such as the temporal and spatial lateral widening process and resulting water and sediment hydrograph, develop simple curves to determine the time at failure prediction and finally provide laborator y data for the next stage of the experiment and a numerical model.
2. Laboratory setup
2.1 Model flume
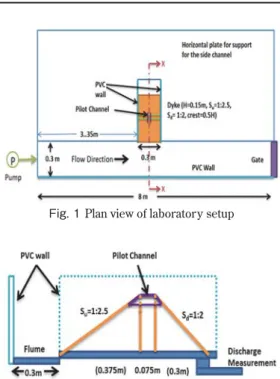
The main hydraulic test conditions assumed in the current study include: 1 ) Trapezoidal shaped dyke kept parallel to the river flow direction (
Fig. 1and
Fig. 2), 2 ) homogenous sediment, 3 ) 5 % moisture content by weight was added initially to dyke materials and compacted using a similar procedure throughout all the experiments and no core layer was added, 4 ) steady inflow with downstream gate control, 5 ) optical recording by video, high-speed and three-dimensional cameras.
The breach test was performed in a Poly Vinyl Chloride (PVC) sided flume as the river and the dyke were placed parallel to the river flow also having PVC walls on both sides (see Photo. 1 ). The maximum discharge provided is 7 . 89 liters/sec.
The horizontal channel is 0 . 3 m wide, 0 . 3 m high and 8 m long and dyke opening at the side of
channel is also 0 . 3 m at a distance of 3 . 35 m from the upstream. The water flows out from the dyke into the downstream reser voir through the horizontal plate. The horizontal plate acts like a supporter for the side channel and as a working platform. The intake is equipped with a flow straightener to generate undisturbed flow from the underground tank with a pump that circulates water continuously between upstream and downstream. The eroded sediment and the resulting water flow were collected manually with a
Fig. 1 Plan view of laboratory setup
Fig. 2
Cross-section along X-X shown in
Fig.1Photo 1. Flume view
plastic box at the end point of the dyke. The plan and section of the experimental setup are shown in
Fig. 1and
Fig. 2, respectively.
The parameters investigated include: Flume discharge Q = 7 . 89 l/s, dyke height H = 0 . 15 m, dyke length L = 0 . 3 m, dyke crest width, b = 0 . 075 m ( 0 . 5 H), and particle size = No. 5 , No. 6 , No. 7 and No. 8 (See
Fig. 3). The upstream dyke slope is S
u= 1 : 2 . 5 (V: H) and downstream slope is S
d= 1 : 2 (V: H) resulting in a total dyke width of B = 2 . 5 H+ 0 . 5 H+ 2 H
= 5 H. The pilot channel ( 2 . 5 cm x 2 cm) is made at the center of the dike as a point for the initiation of breach at the desired location.
To prevent seepage-induced dyke failure prior to
overtopping, a temporary wooden plate was used to cover the dyke area until the required depth of water in front of the dyke was reached. Then, the wooden plate was slowly removed to generate pure overtopping flow. The discharge was measured at the end of the dyke point with the help of plastic boxes at certain time intervals.
2.2 Experimental procedure
All experiments were conducted using a constant flow discharge in a flume Q
in, referred to as the inflow, to obtain the simple boundary condition.
The dyke material was initially provided with 5 % moisture content by weight and thoroughly mixed and then compacted with the help of a tamping plate and cylindrical roller by spraying water layer by layer until about approx. 90 % compaction was achieved. The inflow was added rapidly to attain a steady state before over topping star ted by adjusting the gate at downstream and closing the dyke area by the wooden plate. The flow overtopped the dyke from the pilot channel thus resulting in the lateral widening of the breach from that point.
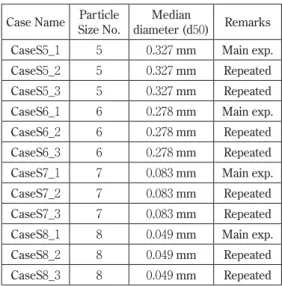
A total of 12 experiments were conducted for four sediment types. Each experiment was repeated three times to observe the effect of repeatability. The three experiments for each particle size showed a similar trend and values. So, only the representative values here are taken for the analysis i.e. the values from the one experiment only. There was no tail water effect and the dyke overflow was always free. The test was stopped when the entire dyke material was washed out and the flow from the dyke reached its equilibrium state. The experiments were therefore limited to dynamic change in the lateral widening process. To represent an actual dyke breach scenario, the hydraulic model should consist of a main channel representing the actual river and a perpendicular side channel where the dyke is placed.
Fig. 3
Particle size distribution of materials for model dyke
Table 1: Experimental Condition
Case Name Particle
Size No.
Median
diameter (d50) Remarks
CaseS5_1 5 0.327 mm Main exp.
CaseS5_2 5 0.327 mm Repeated
CaseS5_3 5 0.327 mm Repeated
CaseS6_1 6 0.278 mm Main exp.
CaseS6_2 6 0.278 mm Repeated
CaseS6_3 6 0.278 mm Repeated
CaseS7_1 7 0.083 mm Main exp.
CaseS7_2 7 0.083 mm Repeated
CaseS7_3 7 0.083 mm Repeated
CaseS8_1 8 0.049 mm Main exp.
CaseS8_2 8 0.049 mm Repeated
CaseS8_3 8 0.049 mm Repeated
Furthermore, the basic upstream boundary condition is obtained by selecting the constant inflow scenario. In prototypes, a dyke is overtopped once the river water level exceeds the dyke crest elevation. The overtopping flow depends on the breach progress and the river discharge (Schmocker, 2011 ). The breach and river discharges interact so that there is an almost constant inflow to the breach section.
2.3 Experimental evaluation
As the pilot channel was constructed at the center of the dyke to clearly visualize the lateral widening patter n, the lateral view was representative for the breaching process analysis.
The process was recorded with a Casio Exlim high- speed camera, Go-Pro Black edition high-speed Camera, Sony HD camera and Fuji film 3 D camera continuously. The 3 D camera was used to record the 3 D image at intervals of 5 sec and later Fujifilm software was used to generate the spatial coordinates. The lateral widening process at intervals of 5 sec was generated with the 3 D camera while breach discharge, sediment discharge and seepage movement were analyzed using the recorded images of the optical instrument.
3. General observations
3.1 Lateral widening process
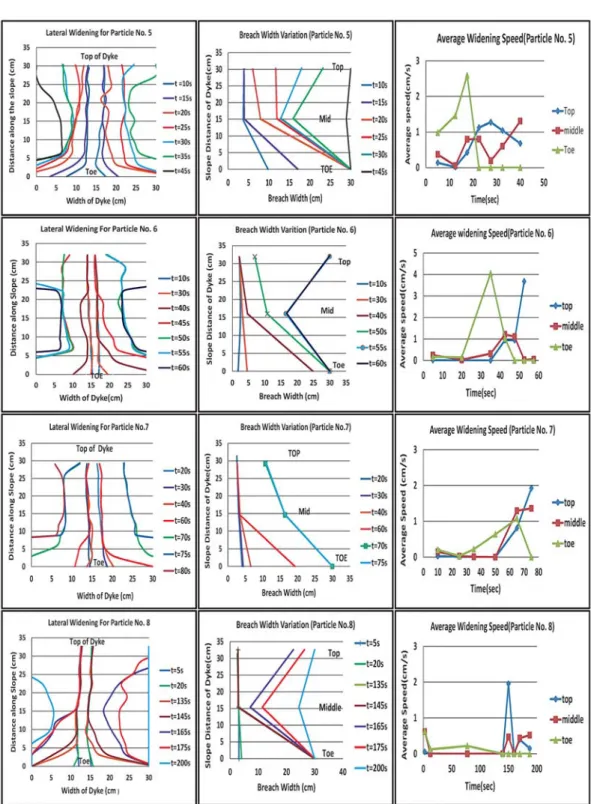
The effect of particle size on the lateral widening process is presented below in
Fig 4.For particles No. 5 , 6 , 7 and 8 with all other parameters constant, different breach shapes resulted- but the process of the widening seems to follow similar procedures.
For all the processes, initially, as the overtopping begin in the dyke, the channel is eroded vertically layer by layer through the pilot channel until the water surface touches the fixed bed. The reason for this is that the top layer beneath the water in the pilot channel is saturated quickly with the flow that
creates erosion of the channel surface by shear stress. Interestingly, on both sides of the channel there is the formation of a vertical slope.
The vertical slope seems to be sufficiently stable due to the matric suction of the unsaturated soil.
When the vertical undermining reaches the fixed bed, then the erosion starts to expand laterally from the toe of the opposite slope of the dyke. In the meantime, the seepage travels through the vertical slope developed on both sides of the channel. If the vertical slope is sufficiently saturated to overcome the sectional resistance stress, then those slopes collapse in the channel flow at the center. The relatively dry sand in the beginning has a minimal tensile strength. As the degree of saturation of the dyke progressively increases when the overtopping starts, the tensile strength first increases to a maximum depending on the particle size and porosity, followed by a reduction to zero at near full saturation (Lu et al.
2009 )
Consequently, both the collapsing of vertical slopes as well as the increase of lateral width of the channel from the toe occur simultaneously and finally the entire dyke collapses.
Figure 4shows the breach width change pattern with respect to time. The first two columns of
Fig. 4show the widening patterns with absolute values while the third column shows the widening speed derived from the second column of the figure. The result shows that the breaching phenomenon was very slow at the beginning at the top, middle and toe section. Then as the vertical breaching reached the fixed bed, the toe section as well as the top section rapidly eroded in comparison with other sections causing most of the breaches of the dyke. The middle section acts like a hinge section for both the erosion and finally the middle section collapse suddenly. Thus, finally the collapse of the entire dyke occurs.
Similarly, the widening speed curve (
Fig. 4) also
Fig. 4 Lateral widening process and average widening speed for different particle sizes
shows that for all the particle sizes, toe widening velocity increases rapidly in comparison with the top and middle point;-as the time passes the top and middle widening velocity increases together but finally when the toe widening speed becomes nearly zero, the top widening speed overpasses the middle and finally collapse occurs.
From all the results obtained, it can be concluded that Particle No. 8 seems to be more resistive to the erosion in the first few seconds than the other particle types due to particle size and slow saturation rate i.e. the suction pressure acts more in the case of Particle No. 8 and breach took a long time to develop and finally collapse.
Consequently, Particle No. 7 , Particle No. 6 and Particle No. 5 follow the Particle No. 8 in the breaching time and collapse process.
3.2 Particle and water discharge
Figure 6
shows the flow hydrograph generated due to river dyke breaches due to overtopping for different particle sizes. The breach discharge increases rapidly after initial overtopping until the maximum breach discharge Q
max> Q
inis attained.
Here Q
maxis the discharge of the hydrograph and Q
inis the inflow discharge in the flume After reaching the maximum outflow, the breach discharge decreases slowly to Q = Q
inand then remains constant. Given the constant inflow scenario, Q
maxdepends on Q
inin contrast to dam break analysis considering reservoir where Q
maxconstantly increases. In
Fig. 6, the dimensionless maximum breach discharge Q
max/Q
inis discussed for dif ferent par ticle types. The maximum discharge obtained is around 1 . 6 times the discharge in the flume. The graph clearly shows that the time lag of peak of the hydrograph
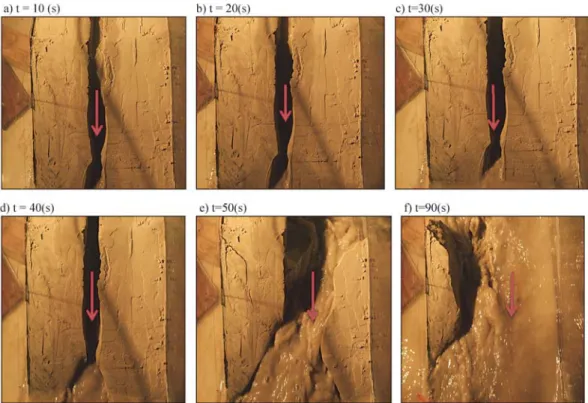
Fig. 5 Lateral widening process (sample example for Particle No. 8)
increases with the increase in sediment number i.e.
decreasing d
50
(median diameter or the medium value of the particle size distribution).
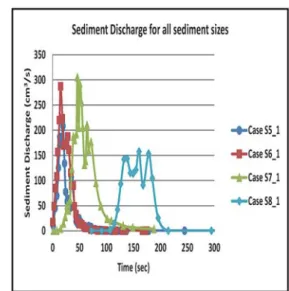
Figure 7shows the obtained particle discharge hydrograph.
The sediment graphs have more than one peak which reveals that the vertical stable wall at the side of the channel collapses into the center of breach at different times. The figure also clearly demonstrates the particle size effect on the erosion of the sediments that determines the breach width.
As previously stated, Particle No. 8 seems more resistive than other sediment sizes.
3.3 Prediction of time of failure
The time of failure, here, is defined as the time taken for the breach discharge to be maximum from the time that overtopping starts. The time of failure is therefore directly observed from the flow hydrograph from the breach. To generalize the results obtained with the current test, the governing parameters considered are described as a functional relationship i.e. Time of failure,
where, q is discharge per unit width at flume, K
shydraulic conductivity of the dyke materials, y is
overtopping depth, d
50
is particle size 50 % finer by weight (median diameter), H height of the dyke S
uis upstream slope, S
dis downstream slope and θ
iinitial moisture content of the dyke materials respectively. Parameters like y,
θi, S
uand S
dwere not systematically varied and are therefore dropped. As only variation with particle sizes were tested, dyke height and specific discharge is considered as impor tant parameters. By Buckingham-π theorem, we get,
( 1 )
Out of the three dimensionless quantities, the first one on the left side is named dimensionless time of failure (A) i.e. the second one first on the right side is named dimensionless specific discharge (B) i.e. and the third one second from the right is named dimensionless height of dyke (C) i.e. The viscosity and surface tension are assumed to be constant for all tests and therefore not taken into account here, given that scale effects are excluded.
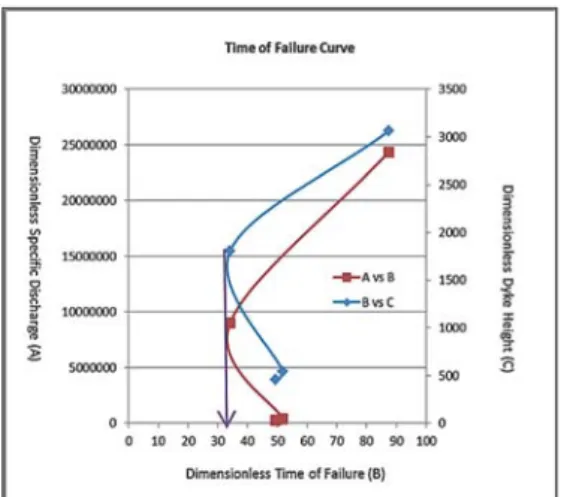
Figure 8
shows a graph of the relations between different dimensional parameters obtained through
Fig. 7 Particle discharge hydrograph Fig. 6 Breach hydrograph
the dimensional analysis using experimental results. The curve is obtained by joining the calculated value from the most suitable experiment out of all the experiments. The curve shows that it has a minimum value when dimensionless time of failure value = 33 . 5 which can be considered as the critical dimensionless failure time. For the uniform particle case as in the current experiment, this value determines the minimum value of time reaching the peak breach discharge. From Particles No. 5 to 8 , the dimensionless time of the failure value decreases at first when both d i m e n s i o n l e s s s p e c i f i c d i s c h a r g e a n d dimensionless dyke height increase up to a critical value then increase from the critical value as the other parameters increase.
Validation of the curve is still not complete due to unavailability of such data but this curve can be used later to check the validity of the next stage experiment of lateral dyke failure cases of our research. However, the result from the real scale model study in the Chiyoda Experimental Flume of the Civil Engineering Research Institute for cold regions, Hokkaido, Japan shows good validation of the curve.
4. Conclusion
The present experimental work investigated the lateral widening breach characteristics with different particle sizes due to overtopping. A simple dyke model was used consisting of homogenous, uniform materials of various particle sizes. A steady inflow scenario was tested and all the breaching processes were recorded using high- speed camera and a 3 D camera.
Within the range of test parameters, the dyke breach process was accelerated with the increase in median diameter of particle d
50
. For coarse sediment, due to quick saturation of the dyke body, the collapse time decreased. The width of the breach increased at the top and toe section compared to the middle section which acted as a hinge point. In the final stage, the middle section also failed leading to the entire dyke collapse. The breach discharge and particle discharge showed the time lag and peak according to the particle size.
Finally, the time of failure curve was proposed for the pre-determination of occurrence of peak breach discharge based on the pre-disaster parameters which, if later, validated, will be an important tool for the natural disaster mitigation.
Once the hydraulic and physical mechanisms of the simple model dyke are understood, the test set- up can be adapted to account for fur ther parameters affecting the dyke-breach such as surface protection, soil layers, core, compaction or soil moisture content. The current findings have to be expanded in the next experiment consisting larger dykes with a more realistic experimental arrangement. The next stage experiment is currently in progress.
ACKNOWLEDGMENT:
The research is suppor ted by JST/JICA SATREPS Program on disaster prevention/
mitigation measures against floods and storm surges in Bangladesh (PI: Dr. Hajime Nakagawa).
Fig. 8: Time of failure curve