The Determinants of Discount Rates on
Retirement Benefits in Japan
journal or
publication title
International review of business
number
15
page range
45-80
year
2015-03
1. Introduction
Pension deficits (i.e., defined benefit liabilities) represent one of the most important issues facing Japanese firms today. Only a small percentage of Japanese firms listed on Japanese stock exchanges have defined benefit plans that are either adequately funded or overfunded. Pension deficits are calculated as the difference between defined benefit obligations and plan assets, and are recognized on the balance sheet. Actuarial assumptions are important factors in estimating an entity’s defined benefit obligations and defined benefit cost. The assumptions include discount rates, expected rates of return on plan assets, rates of future salary increases, mortality, rates of employee turnover, and other elements. The changes in these assumptions can have either a negative or positive effect on the amounts of
Eriko KASAOKA*
Abstract
Actuarial assumptions are important factors in estimating an entity’s defined benefit obligations and defined benefit cost. The assumptions include discount rates, expected rates of return on plan assets, rates of future salary increases, mortality, rates of employee turnover, and other elements. Among other actuarial assumptions, there are several different requirements for the determination of discount rates between Japanese accounting standards and IAS19. In Japan, accounting standards for retirement benefits require an entity to determine the discount rate-based yields on safe and secure long bonds, whereas IAS19 requires an entity to refer to market yields on high quality corporate bonds. Also, Japanese accounting standards require an entity to revise the discount rate when the change in the rate has a significant effect on the amount of defined benefit obligations; this is known as the principle of changes in discount rate. IAS19 does not adopt the principle. There are other important differences in setting discount rates between Japanese accounting standards for retirement benefits and IAS19. To consider the impact of the accounting change to IFRSs, this paper compares financial data from fiscal 2009 through fiscal 2013 for Japanese listed firms adopting IFRSs versus those adopting Japanese accounting standards. It reveals that most firms would have some negative impacts on their financial statements because of the adoption of IFRSs.
Keywords: discount rate, the principle of changes in discount rate, interest income on plan assets, expected return on plan assets
defined benefit obligations and defined benefit cost. Several prior research studies show that managers change their actuarial assumptions to reduce these amounts when they manage their earnings.
There are several requirements when an entity determines actuarial assumptions, and these requirements are different for each accounting standard. Currently, Japan is making progress toward convergence with, and adoption of, International Financial Reporting Standards (IFRSs). Given this transitional stage, it is important to recognize the differences in setting actuarial assumptions between Japanese accounting standards for retirement benefits and International Accounting Standard No.19: Employee Benefits (IAS19). Among other actuarial assumptions, there are several different requirements for the determination of discount rates between Japanese accounting standards and IAS19.
In Japan, accounting standards for retirement benefits require an entity to determine the discount rate-based yields on safe and secure long bonds, including both corporate and government bonds, whereas IAS19 requires an entity to refer to market yields on high quality corporate bonds (HQCB). If there is no deep market for these bonds, the entity has to use market yields on government bonds. There are three other important differences in setting actuarial assumptions between Japanese accounting standards for retirement benefits and IAS19: a revision of the discount rate, the treatment of yield curve, and the calculation of interest cost on plan assets. All of these items are related to discount rates. Therefore, the focus of this paper is the requirements of discount rates.
Okumura (2005) states that if an entity’s discount rate is increased one percentage point from 3% to 4%, and certain reasonable actuarial conditions are assumed, the amount of defined benefit obligations will drop 23%. The change in discount rates would have a significant effect on both an entity’s financial condition and operating results. Therefore, this paper first refers to several prior researches on the determination of discount rates and discusses the effect of changing discount rates on an entity’s financial statements. Second, the paper explains the differences in setting discount rates between Japanese accounting standards for retirement benefits and IAS19. Finally, we compare financial data from fiscal 2009 (when Japanese accounting standards required an entity to review the discount rate annually) through fiscal 2013 (the latest year for which data are available) for Japanese firms listed on Japanese stock exchanges adopting IFRSs versus those adopting Japanese accounting standards; we then consider the impact of the accounting change to IFRSs.
2. The Effect of Changing Discount Rates on Financial Statements
The discount rate has an important role in estimating the present value of defined benefit obligations and, as a result, the funding status of a firm’s defined benefit plan. Patel and Daykin (2010) mention that in practice there is a reasonable range of discount rates for
firms to choose from different data sources, including HQCB whose interest rates can be used as a basis for determining the yield curve for the discount rate. If a firm sets the discount rate at a level that does not rationally reflect market conditions, it will conceal the actual amount of Projected Benefit Obligations (PBO) ! as well as mislead employees about the amounts they have available for retirement1. If the discount rate is too volatile, it
will cause wildly fluctuating current values and lead to firms and trustees being unable to make decisions. An inappropriate discount rate can result in poor decision-making in transactions2.
Blankley et al. (2010) recognize the material impact of a discount rate change on the financial statements, and indicate that firms should choose discount rates corresponding to a benchmark consisting of the rates on a portfolio of HQCB. Firms change their discount rates in a manner that reduces the volatility in corporate bond rates. Blankley and Tang (1995) test if there is a relationship between a firm’s discount rate change and the funding ratio. The test indicates that firms which decrease their discount rates tend to lower their funding ratios more often than those which increase their rates. On the other hand, firms which increase their discount rates tend to raise their funding ratios more often than those which decrease their rates. However, nearly half of those firms which decrease their discount rates increase their funding ratio. They conclude that the discount rate change can explain a portion of the funding reduction, and a firm’s improved economic condition can also affect the firm’s funding status.
Newell et al. (2002) examine the relationship between a firm’s discount rate and the funding status of defined benefit plans. Their results show that firms which have overfunded their defined benefit plans assume higher discount rates than those that have underfunded. Setting higher discount rate assumptions results in better funding status. Butt (2012) also mentions that almost all of the variance in funding ratio movements can be explained by the movement in actuarial assumptions, including the discount rate and pension increases, as well as the difference between investment returns and the discount rate.
Blankly et al. (2004) estimate the likely effect of discount rate changes on future pension expense, earnings, and cash flows. They develop a two-period model for pension expense and its associated earnings impact. They indicate that firms’ defined benefit costs tend to increase significantly when they lower their discount rates in response to past and current economic conditions. The decline in the discount rate also has a negative effect on cash flows: all firms would face additional funding requirements in order to prevent funding ratios from deteriorating. These researches indicate the effect of a firm’s discount rate
1 Guay, R. and L. A. Jean (2013), p.13.
2 Cowling, C. A., R. Frankland, R. T. G. Hails, M. H. D. Kemp, R. L. Loseby, J. B. Orr and A. D. Smith
change on the financial statements. The discount rate change affects the amounts of PBO, defined benefit liability, and defined benefit cost, and the effect is significant on all.
The discount rate can be determined at a firm’s discretion. Some researches indicate that corporate managers might change their discount rates for earnings management. Gopalakrishnan and Sugrue (1995) examine which factors affect the choice of discount rate. They find that a firm’s leverage and degree of pension funding can have important roles in the choice. Asthana (1999) also finds that a firm’s pension funding status affects the choice of discount rate. The study reports that firms with overfunded status tend to choose conservative actuarial choices to maximize tax benefits. On the other hand, firms with underfunded status make liberal actuarial choices to minimize contributions. The study also indicates that a firm’s profitability, cash flow from operations, tax liability, and debt have an effect on the choice of discount rate. Obinata (2000) examines which criterion firms refer to use when they determine their discount rates and concludes that firms choose their discount rates in consideration of the rate of return on equity. Ghicas (1990) employs a logit model to investigate a firm’s determination of a change in method for defined benefit cost allocation. This change leads to a decrease in defined benefit cost and in the funding status of the defined benefit plans. The paper finds that firms use higher actuarial assumptions including discount rates when their pension funding becomes worse.
Godwin et al. (1996) examine whether six factors including changes in cash flows, earnings per share, leverage, dividends, tax status, and market interest rate motivate managers to change their actuarial assumptions. They conclude that managers are likely to increase their actuarial assumptions to deal with declines in earnings, tighter dividend restrictions, and higher leverage. Parker (2009) studies whether or not managers manipulate defined benefit cost to meet analysts’ earnings forecasts. He employs the estimated cross-sectional regression model, and examines the relationship between the change in defined benefit cost and the capital-market-based incentive measure to manipulate earnings. The incentive of earnings management is calculated as the difference between pre-tax earnings absent pension manipulation and analysts’ earnings forecasts. He concludes that managers have strong incentives for earnings management to achieve analysts’ earnings forecasts in order to support their stock price and avoid lower valuations.
Lew (2009) investigates whether financially distressed firms use the pension actuarial assumptions for earnings management. He analyzes 588 firms over the period of 1988-2002 using the three-stage-least-square method. To explain the relationship between firms’ financial condition and their discount rate changes, the equation includes changes in earnings per share, debt to equity ratio, cash flows, funding ratio, and so on as exogenous variables. The analysis shows that a change in discount rate is related to defined benefit cost; therefore, firms use discount rates to manipulate their defined benefit costs.
There are some rules firms have to follow to determine their discount rates. Several studies show that the determination of a firm’s discount rate can be affected by several financial factors, such as the firm’s profitability, leverage, or pension funding status. Also, if Japanese firms change to adoption of IFRSs, the rules for setting discount rates would be different. The change in discount rate has a significant effect on a firm’s financial statements. Therefore, it is important to understand the rules for setting discount rates under Japanese accounting standards and IFRSs to see if the firm sets the discount rate appropriately, and the effect of the change to IFRSs should also be considered.
3. Setting Rules for Discount Rate on Retirement Benefits
3.1 Reference YieldASBJ Statement No.26: Accounting Standard for Retirement Benefits (ASBJ Statement 26) states that an entity shall determine the discount rate based on yields on safe and secure long bonds. These include government bonds, government agency securities, and high-grade corporate bonds (ASBJ Statement 26, par.20). High-grade corporate bonds are bonds with an AA rating or better, assigned by several credit-rating agencies (ASBJ Guidance 25, par.24).
On the other hand, the International Accounting Standards Board (IASB) requires an entity to use the discount rate as determined by market yields on HQCB at the end of the reporting period; if there is no deep market for these bonds, the entity has to use the market yields on government bonds (IAS19, par.83). The discount rate reflects the time value of money, the currency, and the estimated remaining period of benefit payments. It does not reflect the actuarial or investment risk, the entity-specific credit risk borne by the entity’s creditors, and the risk that future experience may differ from actuarial assumptions (IAS19, pars.84, 85).
The IFRS Interpretations Committee discussed a request for guidance on the determination of the discount rate for post-employment benefit obligations in February, March, May, July and November 2013. The issues on which guidance was requested were as follows:3
(a) according to paragraph 83 of IAS19, the discount rate should be determined by reference to market yields at the end of the reporting period on HQCB;
(b) IAS19 does not specify which corporate bonds qualify to be HQCB;
(c) according to prevailing practice, listed corporate bonds have usually been considered to be HQCB if they receive one of the two highest ratings given by a recognized rating agency (e.g., “AAA” and “AA”); and
(d) because of the financial crisis, the number of corporate bonds rated “AAA” or “AA” has decreased in proportions that the submitter of the request considers significant.
Agenda Reference No.7: IAS19 Employee Benefits -Discount Rate (Agenda Reference 7) mentions that the Interpretations Committee proposed to delete paragraph 83 ! which requires an entity to determine the discount rate by reference to market yields at the end of the reporting period on HQCB, and yields on government bonds are to be used if there is no deep market for HQCB! and modify paragraph 84 as follows to address these issues in the IFRS Interpretations Committee meeting in May 2013 (Agenda Reference 7, par.9):
84 One actuarial assumption that has a material effect is the discount rate. The objective of the discount rate is to reflect only the time value of money and at most very low credit risk, the currency and the estimated term of the post-employment benefit obligations. The discount rate does not reflect but not the actuarial or investment risk of the plan assets (as defined in paragraph 28). Furthermore the discount rate does not reflect the entity-specific credit risk borne by the entity’s creditors, and nor does it reflect the risk that future experience may differ from actuarial assumptions.
The Interpretations Committee suggested clarifying the following factors to adopt amended paragraph 84: time value of money, very low credit risk, currency, and maturity (Agenda Reference 7, par.11). The Interpretations Committee also discussed whether the government bonds should be of high quality, and how to meet the objective if there is no deep market in HQCB or high quality government bonds (Agenda Reference 7, par.14). It concluded that staff proposals on these issues were too broad an amendment to IAS19. Therefore, the Interpretations Committee suggested that staff consider whether “high quality” is a relative or an absolute concept4.
In the subsequent meeting in July 2013, the Interpretations Committee discussed whether the term “high quality” used in paragraph 83 of IAS19 is a relative or an absolute concept. Agenda Reference No.11: IAS19Employee Benefits −Discount Rate (Agenda Reference 11) notes that the term “high quality” in paragraph 83 is an absolute concept in common understanding, because it does not require an entity to use corporate bonds with the highest quality (Agenda Reference 11, par.11)5. If HQCB is an absolute concept, the Interpretations
Committee recommends establishing the reference point for HQCB in Implementation Guidance (because rating agencies can change their rating scales over time) (Agenda Reference 11, par.21). If the relative concept is introduced for HQCB, it is necessary to amend paragraph 83 (Agenda Reference 11, par.14).
If the absolute concept is adopted for HQCB, it is suggested clarifying which credit ratings should be used to determine an entity’s discount rate (Agenda Reference 11, par.20). Under current practice, corporate bonds rated higher than AA are considered HQCB. The idea is largely based on an Securities and Exchange Commission Staff Announcement from 1993 based on the premise of capital markets in the U.S.; other capital markets might have different characteristics6. In addition, a number of corporate bonds were downgraded in the
aftermath of the financial crisis ! e.g., the volume of corporate bonds rated AA significantly declined7. Therefore, it is not reasonable to consider corporate bonds with
ratings higher than AA to determine discount rates in other jurisdictions with capital markets of different characteristics. On the other hand, if the relative concept is adopted for HQCB, it is necessary to set out requirements for an entity on how it should select the population of bonds to use to determine the discount rate (Agenda Reference 11, par.25). The Interpretations Committee decided to stop this project, because it could not reach a consensus on a timely basis on how the entity should choose the population of HQCB, or when it can use lower quality bonds to determine the discount rate (Agenda Reference 11, par.29).
Through these frequent discussions, the Interpretations Committee decided not to add these issues to its agenda, because it would be difficult to issue additional guidance on, or change the requirements for, the determination of the discount rate in an efficient manner8.
However, it would be useful to consider these issues stated by staff to estimate more
5 The Interpretations Committee explains the terms of a relative and an absolute concept of HQCB as
follows (Agenda Reference 11, pars.7, 8): A relative concept of high quality means that:
(a) The notion of high quality is defined by reference to the highest quality corporate bonds issued in the same currency of the liability;
(b) The notion of high quality should not be linked to a fixed credit rating, such as “AA”; and (c) The reference point for high quality will change as the population changes. Consequently,
the population of bonds used as the reference for determining the highest quality bond will need to be defined based on a characteristic other than credit quality. In other words, the number of HQCB, or the market depth of HQCB, used to determine the discount rate should be stable over time.
An absolute concept of high quality means that:
(a) The reference point for high quality should be consistent over time and independent of the number of bonds, or the depth of the market in such bonds;
(b) It should be linked to a fixed credit rating, for example the two highest ratings given by an internationally recognized rating agency;
(c) Changes in the depths of the HQCB market should not change the reference point for high quality. It should remain, for example, equivalent to “AA” from period to period. In the absence of a deep market in HQCB, the entity should revert to a government bond rate; and (d) The number of HQCB used to determine the discount rate may change over time.
6 Financial Accounting Standards Board (2012), par.S99-1. 7 Accounting Standards Committee of Germany (2012), pp.1-2. 8 Ibid., p.12.
appropriate discount rates for Japanese entities.
As indicated, ASBJ Statement 26 requires an entity to refer to market yields on both government and corporate bonds. On the other hand, IAS19 requires an entity to refer to market yields on corporate bonds. If there is no deep market for these bonds, the entity has to refer to market yields on government bonds. It is assumed that market yields on corporate bonds are higher than those on government bonds, because they generally have a higher default risk. If Japanese firms place a heavy emphasis on yields on corporate bonds to determine their discount rates, the adoption of IFRSs will not have a significant effect on firms’ financial statements. However, if they determine their discount rates based on government bonds rather than corporate bonds, the accounting change might increase their discount rates and, as a result, decrease the amount of their defined benefit obligations.
3.2 Yield Curve
The Japanese Society of Certified Pension Actuaries (JSCPA) and The Institute of Actuaries of Japan (IAJ) revised Standards for Mathematical Practice on Accounting Standards for Retirement Benefits (Standards for Mathematical Practice) and Guidance for Mathematical Practice on Accounting Standards for Retirement Benefits (Guidance for Mathematical Practice) in 2014 for the purpose of providing reliable information for financial statement users (Standards for Mathematical Practice, par.1).
Under the Guidance for Mathematical Practice, a yield curve is defined as a curve representing several yields on discount bonds with different length of period, which are called spot rates. Discount bonds are bonds which have no interest payment during the period and redeemed only on maturity. To estimate the yield curve, an entity sets a universe of market data on corporate and government bonds and uses a well-known model such as Nelson-Siegel or Svenson. When an entity sets a universe of market data, it has to consider bond type, bond grading, treatment for structured bonds, data reliability, elimination of abnormal value and outlier, and appropriate revision of the universe of market data (Guidance for Mathematical Practice, par.3.2.1). Table 1 shows the movement of spot rate yield curves for Japanese corporate and government bonds rated “AAA” or “AA” by Moody’s.
As mentioned above, market yields on corporate bonds are higher than on those on government bonds owing to a higher default risk. To estimate a yield curve based on corporate and government bonds, the following factors should be considered:9
(a) many bonds are traded on a negotiated basis, and not all trading results are disclosed;
0.00% 0.50% 1.00% 1.50% 2.00% 2.50%
1 3 5 7 9 11 13 15 17 19 25 35 45 Remaining Period for Benefit Payment Government Bonds Corporate Bonds
(b) some bonds are not traded actively;
(c) when bonds are not traded actively or market turbulence occurs, it is difficult for firms to estimate tradable bond prices based only on bid/ask information; (d) corporate bonds with long maturities in the marketplace are far fewer than
government bonds; a yield curve calculated based on corporate bonds has to be estimated with interpolated data; and
(e) when a rating agency delays changing firms’ ratings, some bonds which should be excluded might be in a universe of bonds used to calculate a yield curve.
The figure of a yield curve (flat or steep) and the stability (whether the change in the figure of the yield curve over time is significant) affect the determination of a discount rate10.
ASBJ Guidance No.25: Guidance on Accounting Standard for Retirement Benefits (ASBJ Guidance 25) states that “discount rates have to reflect the estimated remaining period of
10 Ibid, p.14.
Table 1. The Movement of Spot Rate Yield Curves for Japanese Corporate and Government Bonds
Note: Corporate bonds are those rated “AAA” or “AA” by Moody’s. Coupon-bearing bonds refer to the average value listed on the statistical chart of over-the-counter government and corporate bonds at the end of March, 2014.
each retirement benefit payment.” To calculate the defined benefit obligations, an entity can use (1) a single weighted average discount rate calculated with consideration of the estimated remaining period and the amounts of each retirement benefit payment, or (2) multiple discount rates based on the estimated remaining period of each benefit payment (ASBJ Guidance 25, par.24).
Guidance for Mathematical Practice states that it is important to understand yield curves when an entity determines the discount rate in accordance with the ASBJ Guidance 25 (Guidance for Mathematical Practice, par.3.2).
There are four approaches for determining discount rates (Guidance for Mathematical Practice, par.3.2.2):
(a) Yield curve direct approach
A number of discount rates are used, which are calculated based on spot rates with different estimated payment periods according to employees’ retirement dates.
(b) Yield curve equivalence approach
A single weighted average discount rate is used, which leads to the same amount of defined benefit obligations calculated under the yield curve direct approach.
(c) Duration approach
A single weighted average discount rate is used, which is a spot rate with a time-period equivalent to the duration of defined benefit obligations.
(d) Weighted average period approach
A single weighted average discount rate is used, which is a spot rate with a weighted average period based on the amount of defined benefit obligations that has occurred by the end of the period.
Table 2 shows the difference between approaches (a) and (b). Approach (a), the yield curve direct approach, sets multiple discount rates depending on the estimated benefit payment period. For example, if the discount rate for the estimated defined benefit obligations is i% for T-year maturity, the present value is calculated by the following formula:
Present Value = Estimated Defined Benefit Obligations with T-year Maturity × (1/(1+i/100))T
Therefore, if the discount rate for estimated defined benefit obligations with a 2-year maturity is 0.2%, the present value is the estimated defined benefit obligations multiplied by (1/1.002)2. Under approach (b), which adopts a single weighted average discount rate, the
amount of defined benefit obligations is estimated based on approach (a), and a single discount rate which results in the same amount of defined benefit obligations under approach (a) is calculated.
Discounted
1 year lat er 2 years lat er … 5 years lat er T years lat er
Yield i1 i2 i5 it Year Yield i Year Defined Benefit Obligations
<Yield Curve Direct Approach>
<Yield Curve Equivalence Approach>
Approaches (c) and (d) also adopt a single weighted average discount rate, which is a spot rate with a time-period equal to the duration of defined benefit obligations. The duration indicates an average benefit payment period.
Approaches (a) and (b) have theoretical consistency. Approach (d) can be considered a Table 2. Yield Curve Direct Approach and Yield Curve Equivalence Approach
specific case of approach (c), because it sets a single discount rate as 0% and calculates the duration (Guidance for Mathematical Practice, par.3.2.2).
Approaches (b), (c), and (d) have a potential drawback in that they do not adequately reflect the configuration of a yield curve, because they adopt a single weighted average discount rate. However, they are more practical, because (1) an entity can use a matrix representation when it determines whether the discount rate should be revised with consideration of the principle of changes in discount rates, and (2) it is easier to calculate the interest cost on defined benefit obligations.
On the other hand, approach (a) has clarity, as it applies the estimated remaining period of each benefit payment to the discount rate11. If an entity adopts approach (a), the interest
cost can be smaller than when adopting other approaches, because defined benefit obligations with shorter estimated remaining periods of benefit payments have lower discount rates and are of greater size. There is also the possibility that the amount of defined benefit obligations calculated with a discount rate under approaches (c) and (d) will be significantly different from that under approaches (a) and (b), because approaches (c) and (d) refer to a single point on a yield curve corresponding to the duration or weighted average period12. Therefore, choosing one of these approaches affects the amount of defined
benefit obligations and interest cost for the period.
Until fiscal 2012, JICPA Accounting Practice Committee Report No.13: Practical Guidance on Accounting for Retirement Benefits (JICPA Report 13) allowed an entity to determine the discount rate based on the average remaining service period of employees (JICPA Report 13, par.1.11)13. In practice, firms generally used the average remaining
service period of employees to calculate their defined benefit obligations. The Report also stated that data on bond yields at the end of the reporting period were based on yields on long-term government bonds, or a matrix representation of rated bonds provided by the Japan Securities Dealers Association (JICPA Report 13, par.1.59).
However, there were two problems in using discount rates on an average remaining service period based on the matrix representation:14
(a) Most bonds in the marketplace are interest-bearing bonds, not discount bonds; and
(b) The number of samples of 10-years-plus maturity bonds is far fewer than of up
11 Mikami, T. (2013). 12 Shibata, S. (2013), p.3.
13 However, as mentioned above, the report required an entity to set the discount rate which reflects the
estimated average remaining period of each retirement benefit payment in principle (JICPA Report 13, par.1.11).
-to-10-year maturity bonds. There is great variability in these observable data.
The Report was superseded in accordance with the revision of Accounting Standard for Retirement Benefits, ASBJ Statement 26 in 2012. The new accounting standard that requires firms to adopt discount rates with consideration of the estimated timing of benefit payments is adopted for annual periods beginning on or after April 1, 2014.
On the other hand, IAS19 states that “the discount rate reflects the estimated timing of benefit payments. In practice, an entity often achieves this by applying a single weighted average discount rate that reflects the estimated timing and amount of benefit payments and the currency in which the benefits are to be paid (IAS19, par.85).” The JSCPA interviewed nine firms in England, five firms in Germany, three firms in Netherland, and two firms in Switzerland which adopt IFRSs, and it reported the following five methods were adopted by these firms to set their discount rates:15
(a) Yield curve direct approach; (b) Yield curve equivalence approach; (c) Yield duration approach;
(d) Index approach; and
(e) Sample cash-flow approach.
Approaches (a), (b), and (c) are the same as approaches (a), (b), and (c) under Guidance for Mathematical Practice in Japan, respectively. Approach (d) sets a discount rate based on average trading values on HQCB or yield value on bond indexes with consideration of average estimated period of benefit payments on defined benefit plans. It does not use a yield curve. Approach (e) sets a discount rate based on sample cash flows with different features, including durations under a number of defined benefit plans. Adopting approach (b) for sample cash-flows, a single weighted average discount rate is calculated, which leads to the equivalent amount of defined benefit obligations. Countries which adopt the sample cash-flow approach have some similarities in that most defined benefit plans are lifetime annuities, and a firm’s benefit formula is straight-line. On the other hand, Japanese firms provide retirement lump sum grants and pension plans to their employees. Employees can decide whether to receive their pension benefits as lump-sum withdrawal payments. Their benefit formulas have different curve lines depending on the defined benefit plan, and are significantly affected by rates of employee turnover. Under these conditions, it is difficult for Japanese firms to adopt the sample cash-flow approach16.
There is no significant difference in setting a yield curve between Japanese standards and IAS19. The yield curve can move up and down depending on which bonds an entity
15 The Japanese Society of Certified Pension Actuaries (2011), pp.3, 26-28. 16 Ibid., pp.26, 27.
chooses to emphasize in determining the discount rate. Therefore, reference yields indicated in Section 3.1 affect the entirety of the yield curve.
3.3 The Principle of Changes in Discount Rate
There is an approach for determining whether the discount rate should be revised called the principle of changes in discount rate. ASBJ Guidance 25 states the discount rate is required to be revised when the defined benefit obligations as measured using a discount rate at the end of the year are compared to those at the end of the previous year, and this amount exceeds 10% of the previous year’s obligations (ASBJ Guidance 25, par.30).
On the other hand, IAS19 does not adopt the principle of changes in discount rate. It requires an entity to determine the discount rate in reference to market yields at the end of the reporting period on HQCB (IAS19, par.83). Therefore, the rate is reviewed annually, and the change in the rate is reflected in the amount of defined benefit obligations.
Both ASBJ Statement 26 and current IAS19 are applied to annual periods from fiscal 2013 (IAS19, par.172, ASBJ Statement 26, par.34)17. These accounting standards create a
significant change in the disclosure of unrecognized obligations, including unrecognized past service cost and unrecognized actuarial gains or losses. When an entity changes the discount rate, the effect of the discount rate change on PBO is recognized as actuarial gains and losses (ASBJ Statement 26, par.11). IAS19 requires an entity to recognize actuarial gains and losses in other comprehensive income immediately, and they are not reclassified to profit or loss in a subsequent period (IAS19, par.122). ASBJ Statement 26 requires an entity to recognize actuarial gains and losses in profit or loss. The entity is allowed to recognize the cost over several years. The length of the period should be less than the employees’ average remaining service period. The cost that is not recognized for the period is included as unrecognized actuarial gains or losses in other comprehensive income (ASBJ Statement 26, par.24).
Under IAS19, when there is a change in discount rates, actuarial gains and losses in net assets are recognized immediately. In contrast, under ASBJ Guidance 25, an entity considers whether the discount rate should be revised with the principle of changes in discount rate.
17 ASBJ Statement 26 made following major changes from the previous requirements:
(a) Treatment of actuarial gains and losses and past service costs;
(b) Determination of retirement benefit obligations and current service costs; (c) Enhanced disclosures;
(d) Amendment to the treatment of multi-employer plans; and (e) Clarification of the concept of long-term expected rate of return.
All amendments except for the items (b) are applied from the end of annual periods beginning on or after April 1, 2013. The requirement for discount rates included in items (b) is applied from the end of annual periods beginning on or after April 1, 2014.
Therefore, if an entity decides not to change the discount rate, it has an undisclosed risk in the amount of defined benefit liability. Thus, when the amount of defined benefit obligations as measured using a discount rate at the end of the year exceeds 10% of the previous year’s obligations, an entity shall include a significant amount of unrecognized actuarial gains or losses in net assets18.
3.4 Interest Income on Plan Assets and Expected Return on Plan Assets
The expected return on plan assets is defined as an expected return resulting from the management of plan assets (ASBJ Statement 26, par.10). The return is calculated by multiplying the plan assets at the beginning of the period by the expected rate of return on plan assets (ASBJ Statement 26, par.23). The expected rate of return on plan assets is determined with consideration of the plan asset portfolio, management performance in the past, management policy, and the market situation during the period of time when the plan assets are allocated for the payment of employee benefits (ASBJ Guidance 25, par.25). The difference between the actual rates and the expected rates of return on plan assets is recognized as actuarial gains and losses which is a part of defined benefit cost in profit or loss (ASBJ Statement 26, par.11). When the actuarial gains and losses are recognized in profit or loss, the cost can be spread over the average remaining service lives of employees (ASBJ Statement 26, par.24).
With regard to IAS19, the expected return on plan assets is eliminated in current IAS19, because the IASB found it difficult to determine the return in an objective way, and the possibility existed that the return would include a return that occurred not simply from the passage of time (IAS19, par.BC78). Currently IASB requires an entity to recognize interest income on plan assets in the net interest on the net defined benefit liability (IAS19, par.124)19. The interest income on plan assets is calculated by multiplying the fair value of
plan assets at the beginning of the period by the discount rate, which is determined by reference to market yields at the end of the reporting period on HQCB (IAS19, pars.83, 125). The discount rate is used to determine both interest cost on the defined benefit obligations and the return on plan assets. The difference between the interest income on plan assets and the return on plan assets is recognized in the remeasurement of the net defined benefit liability (assets) (IAS19, par.125).
Japanese firms tend to set their expected rates of return on plan assets higher than their
18 Teikoku Databank, Ltd. (2013).
19 The net interest on the net defined benefit liability (asset) consists of interest income on plan assets,
interest cost on the defined benefit obligation, and interest on the effect of the asset ceiling (IAS19, par.124).
discount rates20. If they use the discount rate to calculate the return on plan assets due to the
accounting change to IFRSs, they will increase the amount of the defined benefit cost.
4. The Effect of the Differences in Setting Discount Rates Between Japanese
Accounting Standards for Retirement Benefits and IAS 19
As explained in Section 3, there are several differences between setting discount rates under Japanese accounting standards for retirement benefits and under IAS19. These differences would have a significant effect on the amount of defined benefit obligations and defined benefit cost when firms change their accounting standards to IFRSs. In this section, financial data for Japanese listed firms adopting IFRSs and those adopting Japanese accounting standards are compared to consider the effect of the accounting change to IFRSs.
4.1 Reference Yield and Yield Curve
As mentioned in Section 3.1, Japanese accounting standards for retirement benefits require an entity to reference yields on both government and corporate bonds. IAS19 states that an entity should determine the discount rate based on market yields on HQCB. It is assumed that entities adopting IFRSs would use higher discount rates, because corporate bonds generally have a higher default risk than government bonds.
Table 3 shows discount rates adopted by Japanese listed firms, yields on government bonds in March, and yields on corporate bonds at the end of March from fiscal year 2009 to 2013. Firms that are treated in this research (excluding banks and insurance firms) adopt Japanese accounting standards. They are listed on Japanese stock exchanges within the 12-month fiscal years ending in March from fiscal 2009, when firms are required to review their discount rates annually, through the latest year (fiscal 2013) for which data are available21. Firms were selected that set both discount rates and expected rates of return on
plan assets for accounting standards for retirement benefits, and disclose plan assets on financial statements. Financial data used in this study were collected from Nikkei Economic Electronic Databank System (2014) which is provided by the Nikkei Digital Media, Inc.
Table 3 shows the range of discount rates firms adopting Japanese accounting standards
20 Kasaoka, E. (2014), pp.65, 71.
21 Until fiscal year 2008, the discount rate could be determined with consideration of the movement in
bond yields over a preceding time-period, less than five years in each firm (Accounting Standard for Retirement Benefits, par.footnote6). With the ongoing convergence project with IASB, Japanese accounting standards eliminated the rule and required firms to review their discount rates annually, because ASBJ Statement No.19: Amendments to Accounting Standard for Retirement Benefits (Part 3) (ASBJ Statement 19) states there is no adequate reason that can explain why this discount rate is more reliable than the one calculated by a market yield at the balance sheet date (ASBJ Statement 19, par. Appendix11).
Table 3. Range of Discount Rates Firms Adopting Japanese Accounting Standards Use 2009 2010 2011 2012 2013 Under 1.0% 2 3 11 137 148 1.0% to 1.99% 293 307 511 837 870 2.0% to 2.99% 973 951 693 234 175 3.0% to 3.99% 1 1 − 3 − 4.0% to 4.99% − 1 2 − 3 5.0% to 5.99% 1 1 1 − − 6.0% to 6.99% 1 − − 1 1 Over 7.0% − − − − − No. of Firms 1,271 1,264 1,218 1,212 1,197 Mean 1.989 1.966 1.824 1.412 1.366 Standard Deviation 0.341 0.331 0.389 0.453 0.455
Yields to Subscribers on Government Bonds (%)
with 10-year Maturity 1.329 1.310 0.973 0.636 0.597
with 20-year Maturity 2.159 2.130 1.795 1.623 1.527
with 30-year Maturity 2.301 2.184 1.964 1.820 1.635
Average Yields on HQCB (%)
with 10-year Maturity 1.626 1.853 1.246 0.852 0.857
with 15-year Maturity 2.039 1.993 1.768 1.369 1.274
with More-Than- 20-year Maturity 2.446 2.488 2.038 1.679 1.882
Notes: The data of average yields on HQCB is weighted average of the information provided by Rating and Investment Information, Inc., Japan Credit Rating Agency, Ltd., Standard and Poor’s, and Moody’s until December 2009, by Rating and Investment Information, Inc., Japan Credit Rating Agency, Ltd., and Standard and Poor’s until June 2011, and Rating and Investment Information, Inc. and Japan Credit Rating Agency from July 2011, which is calculated by IIC Partners Co., LTD.
Source: Nikkei Economic Databank System (2014)
IIC Partners Co., LTD. “Corporate Bond Yields,” http://www.pmas-iicp.jp/Portals/ 0/pdf/ databank /bond/syasai_full.pdf
use. Yields to subscribers of government bonds rather than distribution yields are shown in the table, because firms generally refer to these yields. About 150 to 200 firms disclose several or a range of discount rates on defined benefit plans in both Japan and other countries. Japanese defined benefit plans tend to use lower discount rates than other countries’ plans because of the low interest rates on government and corporate bonds in Japan. Therefore, when firms disclose several or the range of discount rates, the lowest rate is shown in the table. Table 3 indicates that most firms adopt less-than-3% discount rates. The average discount rate in each year is similar to the yield of 20-year government bonds or of 15-year HQCB. Firms tend to refer to these yields to set their discount rates.
Japanese firms are allowed to adopt IFRSs from the end of annual periods ending after March 31, 2010. There were 28 Japanese firms that adopted IFRSs in fiscal 201322. Table 4
shows the 28 firms, their number of employees, average age of employees, average salary, and average length of service23.
The table shows that firms in the pharmaceutical and wholesale trade industries strove to adopt the standards. Firms in pharmaceutical industry can gain advantages in adopting IFRSs owing to the high proportion of overseas sales in total sales. Those in wholesale trade industry are all general trade companies (sogo shosha) that have extended their business operations around the world. Adopting IFRSs increases the comparability of their financial statements for foreign investors and improves a firm’s management systems, including those of their foreign subsidiaries24.
Firms in the electric appliance industry, and in securities and commodity futures, on a consolidated basis have fewer employees than those in other industries. The average age of employees and average length of service for firms in services, securities and commodity futures, and communication and information industries, are shorter than those in other industries. These firms might have fewer defined benefit obligations and plan assets than those in other industries. On the other hand, firms in the wholesale trade industry tend to have more than 50,000 employees on a consolidated basis and provide higher salaries to their employees than those in other industries. Their average length of service ranges from 15 to 20 years. Therefore, it is assumed that these firms would have a large amount of defined benefit obligations and plan assets, and the effect of discount rate changes on its obligations would be significant.
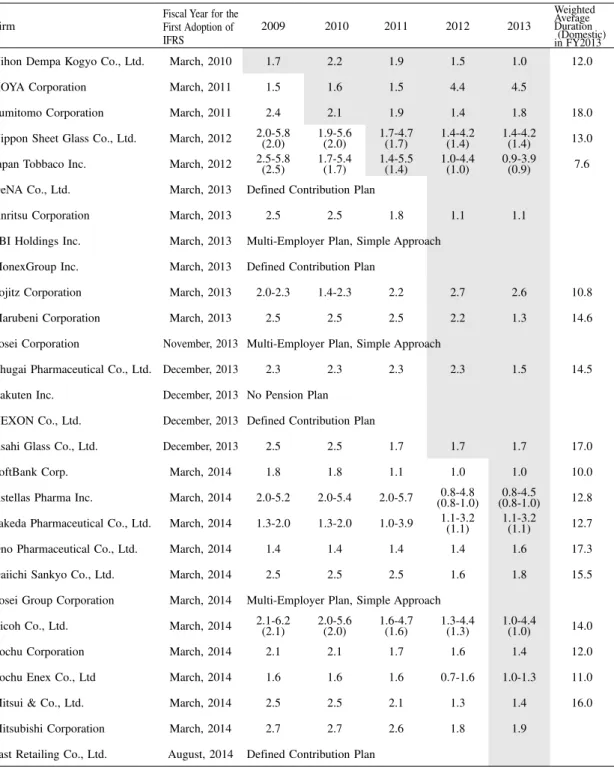
Table 5 represents discount rates of Japanese firms adopting IFRSs. The weighted average duration indicates the average benefit payment period to employees. Four firms out
22 There are 16, 2 and 3 firms which will adopt IFRSs after fiscal year 2014, 2015 and 2016 respectively. 23 Average age of employees, average salary, and average length of service are the data of parent
companies.
Table 4. Japanese Firms Adopting IFRSs
Firm Industry Group
Fiscal Year for the First Adoption of IFRS No. of Employees Average Age of Employees Average Salary (thousand yen) Average Length of Service (years) Nihon Dempa Kogyo Co., Ltd. Electric Appliances March, 2010 (3,713)971 39.2 5,191 13.5 HOYA Corporation Precision Instruments March, 2011 (36,605)3,128 42.4 7,380 17.1 Sumitomo Corporation Wholesale Trade March, 2011 (74,638)5,228 42.7 13,048 18.3 Nippon Sheet Glass Co., Ltd. Glass & CeramicsProducts March, 2012 (27,079)2,053 42.2 7,268 18.8 Japan Tobbaco Inc. Foods March, 2012 (51,563)8,774 43.8 8,944 22.2 DeNA Co., Ltd. Services March, 2013 (2,197)1,045 32.1 7,186 3.1 Anritsu Corporation Electric Appliances March, 2013 (3,880)757 41.0 7,833 17.2 SBI Holdings Inc. Securities & CommodityFutures March, 2013 (5,352)172 37.8 7,256 7.1 Monex Group Inc. Securities & CommodityFutures March, 2013 (992)30 38.3 9,255 5.0 Sojitz Corporation Wholesale Trade March, 2013 (15,915)2,229 42.2 10,520 15.3 Marubeni Corporation Wholesale Trade March, 2013 (39,465)4,289 41.7 12,745 16.8 Tosei Corporation Real Estate November, 2013 (227)120 36.8 6,908 5.6 Chugai Pharmaceutical Co., Ltd. Pharmaceutical December, 2013 (6,872)4,936 41.2 9,276 15.6 Rakuten Inc. Services December, 2013 (10,867)3,762 32.5 6,522 3.8 NEXON Co., Ltd. Information &Communication December, 2013 (4,661)266 32.4 4,998 3.3 Asahi Glass Co., Ltd. Glass & CeramicsProducts December, 2013 (51,448)6,269 40.7 8,024 16.7 SoftBank Corp. Information &Communication March, 2014 (70,336)185 38.9 11,464 6.7 Astellas Pharma Inc. Pharmaceutical March, 2014 (17,649)5,777 41.7 10,359 16.6 Takeda Pharmaceutical Co., Ltd. Pharmaceutical March, 2014 (31,225)6,578 38.8 9,435 14.1 Ono Pharmaceutical Co., Ltd. Pharmaceutical March, 2014 (2,858)2,608 40.1 8,732 15.9 Daiichi Sankyo Co., Ltd. Pharmaceutical March, 2014 (32,791)5,744 42.3 10,363 17.7 Sosei Group Corporation Pharmaceutical March, 2014 (30)12 41.1 8,070 4.9 Ricoh Co., Ltd. Electric Appliances March, 2014 (108,195)9,041 42.1 7,991 17.5 Itochu Corporation Wholesale Trade March, 2014 (102,376)4,235 41.3 13,836 16.1 Itochu Enex Co., Ltd. Wholesale Trade March, 2014 (3,954)493 41.1 8,830 14.9 Mitsui & Co., Ltd. Wholesale Trade March, 2014 (48,090)6,160 42.4 13,515 19.1 Mitsubishi Corporation Wholesale Trade March, 2014 (68,383)6,358 42.8 13,552 18.7 Fast Retailing Co., Ltd. Retail Trade August, 2014 (30,488)1,088 36.5 7,359 5.2
Table 5. Range of Discount Rates Firms with IFRSs Adopt
Firm
Fiscal Year for the First Adoption of IFRS 2009 2010 2011 2012 2013 Weighted Average Duration (Domestic) in FY2013
Nihon Dempa Kogyo Co., Ltd. March, 2010 1.7 2.2 1.9 1.5 1.0 12.0 HOYA Corporation March, 2011 1.5 1.6 1.5 4.4 4.5
Sumitomo Corporation March, 2011 2.4 2.1 1.9 1.4 1.8 18.0 Nippon Sheet Glass Co., Ltd. March, 2012 2.0-5.8(2.0) 1.9-5.6(2.0) 1.7-4.7(1.7) 1.4-4.2(1.4) 1.4-4.2(1.4) 13.0 Japan Tobbaco Inc. March, 2012 2.5-5.8(2.5) 1.7-5.4(1.7) 1.4-5.5(1.4) 1.0-4.4(1.0) 0.9-3.9(0.9) 7.6 DeNA Co., Ltd. March, 2013 Defined Contribution Plan
Anritsu Corporation March, 2013 2.5 2.5 1.8 1.1 1.1 SBI Holdings Inc. March, 2013 Multi-Employer Plan, Simple Approach
MonexGroup Inc. March, 2013 Defined Contribution Plan
Sojitz Corporation March, 2013 2.0-2.3 1.4-2.3 2.2 2.7 2.6 10.8 Marubeni Corporation March, 2013 2.5 2.5 2.5 2.2 1.3 14.6 Tosei Corporation November, 2013 Multi-Employer Plan, Simple Approach
Chugai Pharmaceutical Co., Ltd. December, 2013 2.3 2.3 2.3 2.3 1.5 14.5 Rakuten Inc. December, 2013 No Pension Plan
NEXON Co., Ltd. December, 2013 Defined Contribution Plan
Asahi Glass Co., Ltd. December, 2013 2.5 2.5 1.7 1.7 1.7 17.0 SoftBank Corp. March, 2014 1.8 1.8 1.1 1.0 1.0 10.0 Astellas Pharma Inc. March, 2014 2.0-5.2 2.0-5.4 2.0-5.7 (0.8-1.0)0.8-4.8 (0.8-1.0)0.8-4.5 12.8 Takeda Pharmaceutical Co., Ltd. March, 2014 1.3-2.0 1.3-2.0 1.0-3.9 1.1-3.2(1.1) 1.1-3.2(1.1) 12.7 Ono Pharmaceutical Co., Ltd. March, 2014 1.4 1.4 1.4 1.4 1.6 17.3 Daiichi Sankyo Co., Ltd. March, 2014 2.5 2.5 2.5 1.6 1.8 15.5 Sosei Group Corporation March, 2014 Multi-Employer Plan, Simple Approach
Ricoh Co., Ltd. March, 2014 2.1-6.2(2.1) 2.0-5.6(2.0) 1.6-4.7(1.6) 1.3-4.4(1.3) 1.0-4.4(1.0) 14.0 Itochu Corporation March, 2014 2.1 2.1 1.7 1.6 1.4 12.0 Itochu Enex Co., Ltd March, 2014 1.6 1.6 1.6 0.7-1.6 1.0-1.3 11.0 Mitsui & Co., Ltd. March, 2014 2.5 2.5 2.1 1.3 1.4 16.0 Mitsubishi Corporation March, 2014 2.7 2.7 2.6 1.8 1.9
Fast Retailing Co., Ltd. August, 2014 Defined Contribution Plan
Notes: Numbers shown in parentheses are discount rates for domestic defined benefit plans. Source: Nikkei Economic Electronic Databank System (2014)
of 28 have defined contribution plans. The number of firms having only defined contribution plans has been increasing recently because of the volatility and risks that defined benefit plans have. HOYA Corporation increased their discount rate from fiscal 2012. This firm mainly has defined contribution plans for employees, and only provides defined benefit plans where it is required to by local law or regulations. However, it had defined benefit plans for domestic subsidiaries owing to its merger with PENTAX Corporation in 2008. The plans were implemented by fiscal 2012, and defined benefit plans are adopted mainly for foreign subsidiaries.
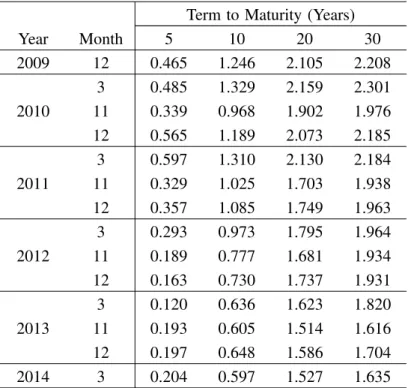
Comparing Table 5 with Tables 6 and 7, most firms adopt discount rates based on yields on 10- to 20-year government and corporate bonds before the adoption of IFRSs, and did not significantly change their discount rates after the adoption of the standards. This result stems from the fact that yields on HQCB are only 0.1%-0.5% higher than those on government bonds25.
Some firms adopt higher discount rates than yields on government bonds. Sumitomo
Table 6. Yields to Subscribers on Government Bonds (%) Term to Maturity (Years)
Year Month 5 10 20 30 2009 12 0.465 1.246 2.105 2.208 3 0.485 1.329 2.159 2.301 2010 11 0.339 0.968 1.902 1.976 12 0.565 1.189 2.073 2.185 3 0.597 1.310 2.130 2.184 2011 11 0.329 1.025 1.703 1.938 12 0.357 1.085 1.749 1.963 3 0.293 0.973 1.795 1.964 2012 11 0.189 0.777 1.681 1.934 12 0.163 0.730 1.737 1.931 3 0.120 0.636 1.623 1.820 2013 11 0.193 0.605 1.514 1.616 12 0.197 0.648 1.586 1.704 2014 3 0.204 0.597 1.527 1.635
Source: Ministry of Finance. “Bidding Information,” http://www. mof.go.jp/jgbs/auction/index.html
Corporation, Marubeni Corporation, Mitsui & Co., Ltd., and Mitsubishi Corporation adopted U.S. GAAP before they adopted IFRSs. Accounting Standards Codification 715 Compensation − Retirement Benefits requires firms to set their discount rates based on available information on rates implicit in current prices of annuity contracts, including available annuity rates published by the Pension Benefit Guaranty Corporation (PBGC) (par.715-30-35-43)26. This requirement is similar to IAS19.
Sojitz Corporation and Ono Pharmaceutical Co., Ltd. increased their discount rates after Table 7. Average Yields on HQCB
(%) Term to Maturity (Years)
Year Month 5-6 10-11 11-12 12-13 13-14 14-15 15-16 16-17 17-18 18-19 19-20 over 20
2009 12 0.759 1.575 1.587 1.767 1.828 1.936 1.984 2.157 2.235 2.259 2.241 2.443 3 0.804 1.626 1.709 1.820 1.883 1.995 2.039 2.129 2.273 2.243 2.306 2.446 2010 11 0.658 1.335 1.494 1.565 1.688 1.870 1.873 1.980 2.040 2.030 2.108 2.219 12 0.614 1.246 1.379 1.458 1.566 1.781 1.758 1.883 1.966 1.973 2.047 2.147 3 0.982 1.853 1.605 1.694 1.801 2.033 1.993 2.139 2.502 2.455 2.451 2.488 2011 11 0.796 1.298 1.436 1.521 1.929 1.778 1.817 1.916 1.976 2.008 2.039 2.081 12 0.757 1.244 1.401 1.472 1.978 1.683 1.729 1.887 1.927 1.962 1.937 2.016 3 0.707 1.246 1.395 1.529 1.968 1.626 1.768 1.830 1.909 1.990 1.898 2.038 2012 11 0.643 1.042 1.141 1.518 1.395 1.463 1.646 1.782 1.789 1.818 1.825 1.986 12 0.667 1.168 1.232 1.625 1.455 1.515 1.801 1.816 1.863 1.866 1.904 2.038 3 0.468 0.852 0.979 1.283 1.044 1.139 1.369 1.390 1.501 1.461 1.552 1.670 2013 11 0.410 0.807 1.084 0.955 1.051 1.160 1.298 1.402 1.464 1.535 1.642 1.790 12 0.492 0.928 1.217 1.068 1.140 1.302 1.365 1.491 1.537 1.636 1.705 1.881 2014 3 0.417 0.857 1.112 0.976 1.050 1.216 1.274 1.409 1.416 1.537 1.608 1.882
Source: IIC Partners Co., LTD. “CorporateBond Yields,” http://www.pmas-iicp.jp/Portals/ 0/pdf/ databank/bond/syasai_full.pdf
25 In the U.S., based on the data provided by the U.S. Department of the Treasury, the difference between
the 10-, 20-, and 30-year treasury nominal coupon-issue yield curve and the 10-, 20-, and 30-year treasury high quality market corporate bond yield curve ranges from 1.5% to 3.0%. The high quality market corporate bonds include bonds with better than A grades. The U.S. Department of the Treasury. “Economic Policy,” http://www.treasury.gov/resource-center/economic-policy/Pages/default.aspx.
26 The interest rates that the PBGC issued to determine the present value of annuities in March from 2010
to 2014 are as follows:
Years 2010 2011 2012 2013 2014
1-20 4.89 4.07 3.74 2.67 3.35
>20 4.63 3.93 3.70 3.01 3.50
Source: Pension Benefit Guaranty Corporation. “ERISA 4044 (Immediate and Deferred) Annuities,” http://www.pbgc.gov/prac/interest/ida.html
they adopted IFRSs. Daiichi Sankyo Co., Ltd. and Mitsubishi Corporation use higher discount rates than average yields on more than 20-year HQCB. Most firms have not changed their discount rates because of the adoption of IFRSs in Japan. However, it is important to understand that there are several firms that might choose higher discount rates after they have adopted the standards, because firms have to determine their discount rates based on yields on HQCB.
4.2 The Principle of Changes in Discount Rate
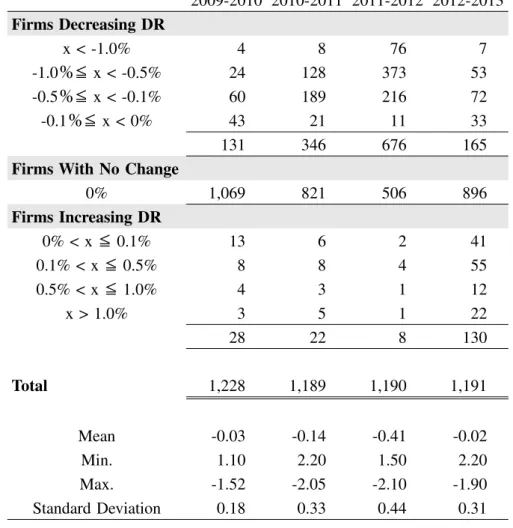
IAS19 requires firms to review their discount rates annually. Table 5 shows that firms adopting IFRSs tend to change their discount rates every fiscal year according to the movement of stock and bond prices in their plan assets. Table 8 represents how often and how much Japanese listed firms adopting Japanese accounting standards change their discount rates.
The table shows that about 75% to 85% of firms did not change their discount rates, except in fiscal 2011-2012. Japanese accounting standards on retirement benefits also require firms to review their discount rates annually; however, as noted in Section 3.3, firms are allowed to leave their discount rates as is when the change in discount rates would not have a significant effect on the amount of PBO in the previous year. Most firms changing their discount rates decrease their rates due to difficult economic conditions in Japan. Japanese stock prices have been increasing since 2013. Therefore, the number of firms increasing their discount rates rises in fiscal year 2013.
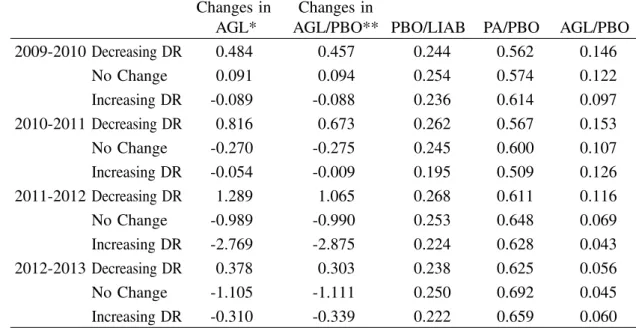
Table 9 shows the changes in the amount of actuarial gains and losses depending on whether firms change or do not change their discount rates. Actuarial gains and losses are caused by the following under Japanese accounting standards on retirement benefits (ASBJ Statement 26, par.11):
(a) A difference between the actual return on plan assets during a period and the expected return on plan assets for that period;
(b) A difference between the actual rate in calculating defined benefit obligations during a period and the estimated rate for that period; and
(c) A modification of estimated rates.
It is important to understand that actuarial gains and losses do not solely represent the amount of changes in discount rates. However, the table displays a tendency that, when firms decrease their discount rates, they have a higher amount of actuarial gains and losses than that in the previous year. On the other hand, when firms increase their discount rates, they have fewer actuarial gains and losses than in the previous year.
Firms with no change in discount rates also show a decrease in the amount of actuarial gains and losses from the previous year ! except for fiscal 2009-2010 when the amount
increases. Table 10 shows the plan asset structure of firms with Employees’ Pension Fund and Defined-Benefit Corporate Pensions, which are Japanese corporate defined benefit plans. Firms tend to allocate 40% to 50% of invested funds to domestic bonds and stocks, and 25% to 30% to foreign bonds and stocks. It is assumed that the return and amount of plan assets reflect a significant impact from Japanese and overseas economic circumstances. Table 11 shows the rates of return on plan assets. Compared with the number of changes in actuarial gains and losses in Table 9, when firms manage their plan assets efficiently ! i.e., firms enjoy some return from the management of plan assets ! firms with no change in discount rates show a decrease in actuarial gains and losses. In 2009-2010, when firms had losses on their plan assets, their actuarial gains and losses increased.
Table 8. Frequency and Level of Change in Discount Rates
2009-2010 2010-2011 2011-2012 2012-2013 Firms Decreasing DR x < -1.0% 4 8 76 7 -1.0#" x < -0.5% 24 128 373 53 -0.5#" x < -0.1% 60 189 216 72 -0.1#" x < 0% 43 21 11 33 131 346 676 165
Firms With No Change
0% 1,069 821 506 896 Firms Increasing DR 0% < x" 0.1% 13 6 2 41 0.1% < x" 0.5% 8 8 4 55 0.5% < x" 1.0% 4 3 1 12 x > 1.0% 3 5 1 22 28 22 8 130 Total 1,228 1,189 1,190 1,191 Mean -0.03 -0.14 -0.41 -0.02 Min. 1.10 2.20 1.50 2.20 Max. -1.52 -2.05 -2.10 -1.90 Standard Deviation 0.18 0.33 0.44 0.31
Table 9. Changes in Actuarial Gains and Losses, and Ratios Related to PBO
Changes in Changes in
AGL* AGL/PBO** PBO/LIAB PA/PBO AGL/PBO
2009-2010 Decreasing DR 0.484 0.457 0.244 0.562 0.146 No Change 0.091 0.094 0.254 0.574 0.122 Increasing DR -0.089 -0.088 0.236 0.614 0.097 2010-2011 Decreasing DR 0.816 0.673 0.262 0.567 0.153 No Change -0.270 -0.275 0.245 0.600 0.107 Increasing DR -0.054 -0.009 0.195 0.509 0.126 2011-2012 Decreasing DR 1.289 1.065 0.268 0.611 0.116 No Change -0.989 -0.990 0.253 0.648 0.069 Increasing DR -2.769 -2.875 0.224 0.628 0.043 2012-2013 Decreasing DR 0.378 0.303 0.238 0.625 0.056 No Change -1.105 -1.111 0.250 0.692 0.045 Increasing DR -0.310 -0.339 0.222 0.659 0.060
AGL = ActuarialGains and Losses, PBO = Projected Benefit Obligations, LIAB = Total Liabilities, PA = Plan Assets
*Changes in AGL = (AGLt - AGLt-1) / AGLt-1
**Changes in AGL / PBO =#% $ AGLt PBOt AGLt-1 PBOt-1 ! % "-1 Source: Nikkei Economic Electronic Databank System (2014)
Table 10. Plan Asset Structure
(%) Domestic Bonds Domestic Stocks Foreign Bonds Foreign Stocks General Account Assets Short-Term Fund Others 2009 26.99 20.34 13.31 13.30 12.59 4.44 9.03 2010 26.11 21.33 12.17 16.65 4.69 4.19 3.16 2011 26.84 18.89 11.49 17.53 12.97 3.70 8.58 2012 27.16 17.43 12.04 16.33 14.00 4.22 8.81 2013 27.89 14.48 13.30 16.27 13.69 4.54 9.83
Source : Pension Fund Association. “The Survey and Comment on Pension Asset Management,” http://www.pfa.or.jp/activity/tokei/shisanunyo/jittai/index.html
Actuarial gains and losses to PBO and PBO to liability ratios show that firms increasing their discount rates have lower ratios than those decreasing their rates. When firms increase their discount rates, they can lower actuarial gains and losses and PBO. Therefore, these firms have higher ratios on plan assets to PBO, and lower ratios on actuarial gains and losses to PBO. The plan assets to PBO ratio represents a firm’s pension funding status. Therefore, firms that increase their discount rates are better funded than those decreasing their rates.
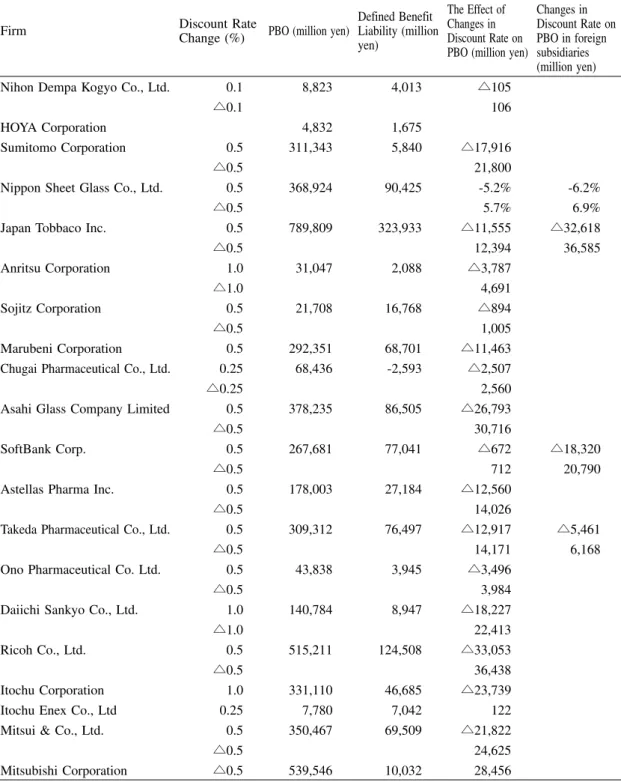
As noted above, actuarial gains and losses do not represent only the changes in discount rates. They also include a difference between the actual rates and the estimated rates to calculate defined benefit obligations and plan assets. IAS19 requires firms to disclose a sensitivity analysis for each significant actuarial assumption as of the end of the period. Firms have to show how the PBO would have affected changes in the actuarial assumption that were reasonably possible at that date (IAS19, par.145(a)). Japanese firms adopting IFRSs disclose a sensitivity analysis; the sensitivity analysis of each firm assumes that other variables remain fixed27. Table 12 shows the details of the sensitivity analysis for various
firms.
Table 12 reveals that when firms increase their discount rates by 0.5%, firms show, on average, about a 6% decline in their PBO. On the other hand, when firms decrease their discount rates by 0.5%, they have an increase of 6.5% in PBO. Table 8 shows that when firms change their discount rates, they tend to decrease the rates by 0.1% to 1.0%. Firms would experience a significant effect from the changes in discount rates on their PBO, and as a result of their pension funding status (overfunded or underfunded) if they adopt IFRSs.
Table 11. Rates of Return on Plan Assets
(%)
2009 2010 2011 2012 2013
Rates of Return on Plan Assets 14.29 -0.54 1.82 11.17 8.80
Source: Pension Fund Association. “The Survey and Comment on Pension Asset Management,” http:// www.pfa.or.jp/activity/tokei/shisanunyo/jittai/index.html
27 However, actuarial assumptions do not always change independently; they might be affected by the
Table 12. Sensitivity Analysis of Japanese Firms Adopting IFRSs
Firm Discount Rate
Change (%) PBO (million yen)
Defined Benefit Liability (million yen) The Effect of Changes in Discount Rate on PBO (million yen)
The Effect of Changes in Discount Rate on PBO in foreign subsidiaries (million yen)
Nihon Dempa Kogyo Co., Ltd. 0.1 8,823 4,013 !105
!0.1 106
HOYA Corporation 4,832 1,675
Sumitomo Corporation 0.5 311,343 5,840 !17,916
!0.5 21,800
Nippon Sheet Glass Co., Ltd. 0.5 368,924 90,425 -5.2% -6.2%
!0.5 5.7% 6.9%
Japan Tobbaco Inc. 0.5 789,809 323,933 !11,555 !32,618
!0.5 12,394 36,585 Anritsu Corporation 1.0 31,047 2,088 !3,787 !1.0 4,691 Sojitz Corporation 0.5 21,708 16,768 !894 !0.5 1,005 Marubeni Corporation 0.5 292,351 68,701 !11,463
Chugai Pharmaceutical Co., Ltd. 0.25 68,436 -2,593 !2,507
!0.25 2,560
Asahi Glass Company Limited 0.5 378,235 86,505 !26,793
!0.5 30,716
SoftBank Corp. 0.5 267,681 77,041 !672 !18,320
!0.5 712 20,790
Astellas Pharma Inc. 0.5 178,003 27,184 !12,560
!0.5 14,026
Takeda Pharmaceutical Co., Ltd. 0.5 309,312 76,497 !12,917 !5,461
!0.5 14,171 6,168
Ono Pharmaceutical Co. Ltd. 0.5 43,838 3,945 !3,496
!0.5 3,984
Daiichi Sankyo Co., Ltd. 1.0 140,784 8,947 !18,227
!1.0 22,413
Ricoh Co., Ltd. 0.5 515,211 124,508 !33,053
!0.5 36,438
Itochu Corporation 1.0 331,110 46,685 !23,739
Itochu Enex Co., Ltd 0.25 7,780 7,042 122
Mitsui & Co., Ltd. 0.5 350,467 69,509 !21,822
!0.5 24,625
4.3 Interest Income on Plan Assets and Expected Return on Plan Assets
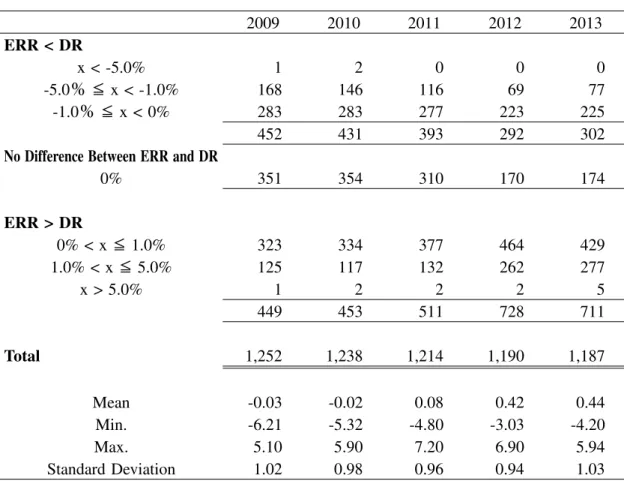
Discount rates are determined based on yields on safe and secure long bonds. As shown in Section 4.1, Japanese listed firms adopting Japanese accounting standards tend to choose discount rates that are similar to the yield of 20-year government bonds or of 15-year HQCB. On the other hand, the expected rates of return on plan assets can be selected based on the firm’s plan assets portfolio, past management performance, management policy, and so on (ASBJ Guidance 25, par.25). Therefore, the range of expected rates of return Japanese firms select might be wider than that for discount rates, and the average expected rates of return would be set higher than the average discount rates28. Table 13 shows the difference
Table 13. Difference between Expected Rates of Return on Plan Assets and Discount Rates 2009 2010 2011 2012 2013 ERR < DR x < -5.0% 1 2 0 0 0 -5.0" ! x < -1.0% 168 146 116 69 77 -1.0" ! x < 0% 283 283 277 223 225 452 431 393 292 302
No Difference Between ERR and DR
0% 351 354 310 170 174 ERR > DR 0% < x! 1.0% 323 334 377 464 429 1.0% < x ! 5.0% 125 117 132 262 277 x > 5.0% 1 2 2 2 5 449 453 511 728 711 Total 1,252 1,238 1,214 1,190 1,187 Mean -0.03 -0.02 0.08 0.42 0.44 Min. -6.21 -5.32 -4.80 -3.03 -4.20 Max. 5.10 5.90 7.20 6.90 5.94 Standard Deviation 1.02 0.98 0.96 0.94 1.03
ERR =Expected Rate of Return on Plan Assets, DR = Discount Rate Source: Nikkei Economic Electronic Databank System (2014)
between expected rates of return on plan assets and the discount rates Japanese listed firms adopting Japanese accounting standards use.
These firms tend to select expected rates of return on plan assets that are higher than discount rates. Before fiscal 2012, IAS19 required firms to adopt expected rates of return on plan assets to calculate return on plan assets, currently, firms have to determine their interest income on plan assets using discount rates. Adopting expected rates of return on plan assets that are higher than discount rates indicates that firms would have a negative impact from the adoption of IFRSs on their financial statements. Following the recent increases in stock prices, in the past two years, the number of firms adopting expected rates of return on plan assets that are more than 1% higher than discount rates is twice as many as those before fiscal 2011.
The expected return on plan assets is calculated by multiplying the plan assets at the beginning of the period by the expected rate of return on plan assets (ASBJ Statement 26, par.23). When firms adopt IFRSs, they have to use discount rates to calculate their return on plan assets, which under IAS19 is defined as interest income on plan assets. Firms that use expected rates of return on plan assets that are higher than discount rates under Japanese accounting standards would have a negative impact from the accounting standard change on their income statement. In turn, firms that adopt expected rates of return on plan assets that are below discount rates would have a positive impact. Table 14 shows the effects of the
Table 14. Impact on Defined Benefit Cost from the Difference between Expected Return on Plan Assets and Interest Income on Plan Assets, and on Income before Taxes for Firms Adopting Japanese Accounting Standards for Retirement Benefits
(%) Difference Between ERR
and DR * PA / DBC
Difference Between ERR and DR * PA / NIBT 2009 ERR < DR 4.11 4.09 ERR > DR -5.28 -6.61 2010 ERR < DR 5.26 3.98 ERR > DR -7.41 -3.88 2011 ERR < DR 4.94 2.42 ERR > DR -4.99 -5.14 2012 ERR < DR 4.05 1.37 ERR > DR -6.73 -8.44 2013 ERR < DR 6.15 1.36 ERR > DR -9.46 -2.69
ERR = Expected Rate of Return on Plan Assets, DR = Discount Rate, PA = Plan Assets, DBC = Defined Benefit Cost,
NIBT = Net Income Before Taxes
adoption of discount rates on defined benefit cost and net income before taxes.
Firms adopting expected rates of return on plan assets that are higher than discount rates would show negative effects on defined benefit cost by 4.99% to 9.46%, and on net income before taxes by 2.69% to 8.44%. Firms adopting expected rates of return on plan assets that are below discount rates would show positive effects on defined benefit cost by 4.05% to 6.15%, and on net income before taxes by 1.36% to 4.09%. The transition to IFRSs would cause a significant impact on firms’ income statements.
Since fiscal 2013, firms adopting IFRSs have adopted discount rates to calculate their interest income on plan assets. In fiscal 2012, these firms used expected rates of return on plan assets for the calculation of expected return on plan assets. In their financial statements for fiscal 2013, they show the amount of interest income calculated using discount rates in the previous fiscal year, fiscal 2012. Comparing these amounts, the effect of the assumptions change from expected rates of return to discount rates on plan assets can be seen. Table 15 displays discount rates and expected rates of return on plan assets firms adopted in fiscal 2012, and expected return on plan assets disclosed in financial statements for the same year. It also shows interest income, which is a return on plan assets calculated by multiplying
Table 15. Expected Return on Plan Assets and Interest Income on Plan Assets of Firms Adopting IFRSs in Fiscal 2012
Firm DR (%) ERR (%)
Plan Assets at the beginning of the period (million yen)
Expected Return on Plan Assets (million yen)
Interest Income (million yen)
Nihon Dempa Kogyo Co., Ltd. 1.5 1.9 4,304 69 69
HOYA Corporation 4.4 6.5 2,442 205 176
Sumitomo Corporation 1.4 2.1 295,201 5,525 5,525
Nippon Sheet Glass Co., Ltd. 1.4-4.2 0.0-8.3 261,177 10,695 9,553
Japan Tobbaco Inc. 1.0-3.7 - 372,425 11,120 11,041
Anritsu Corporation 1.1 2.5 27,190 490 398
Sojitz Corporation 2.7 3.9 4,673 156 156
Marubeni Corporation 2.2 2.7 214,941 6,044 4,968
Chugai Pharmaceutical Co., Ltd. 2.3 0.8-2.5 66,267 1,387 1,114
Asahi Glass Co., Ltd. 1.7 2.8 236,652 5,707 5,125
SoftBank Corp. 1.0
Astellas Pharma Inc. 0.9-4.8 2.5-5.0 137,530 3,439 3,168
Takeda Pharmaceutical Co., Ltd. 1.0-3.2 1.5-3.1 250,407 4,929 4,211
Ono Pharmaceutical Co., Ltd. 1.4 1.0-1.4 40,901 522 771
Daiichi Sankyo Co., Ltd. 1.6 3.0 107,111 2,820 2,502
Ricoh Co., Ltd. 1.6-4.7 1.4-5.5 347,704 10,517 9,495
Itochu Corporation 1.7 2.8 271,842 7,277 4,440
Itochu Enex Co., Ltd 0.7-1.6 0.0-2.5 735 0 7
Mitsui & Co., Ltd. 2.1 3.3 259,243 7,755 5,060
Mitsubishi Corporation 2.6 2.5 483,938 8,058 11,210
DR = Discount Rate, ERR = Expected Rate of Return on Plan Assets Source: Nikkei Economic Electronic Databank System (2014)