TUMSAT-OACIS Repository - Tokyo University of Marine Science and Technology (東京海洋大学)
DNAマーカーを用いたヒラメの分子育種学的研究
著者
藤 加菜子
学位授与機関
東京水産大学
学位授与年度
2005
URL
http://id.nii.ac.jp/1342/00000704/
DNAマーカーを用いたヒラメの分子育種学的研究
平成17年度
(2005)
霧藩大学附寓働
¢ 煙
00690i6、
参 邸
東京水産大学大学院
水産学研究科
資源育成学専攻
藤加菜子
目次
博士論文内容の要旨・・・・・・・・・・・・… 6・・・・・・・・・・・…
緒論・・・・・・・・・・・・・・・・・・・・・・・・・・・・・… 6・…
第1章 DNAマーカーを用いた連鎖解析による有用経済形質関連遺伝子座の推定・・
第1節 ヒラメ・白化関連遺伝子座の推定・・・・・・・・・・・・・・・・・… 第2節 ヒラメのリンホシスチス病抵抗性遺伝子座の推定・・・・・・・・・・… 付記 ヒラメ遺伝子の相同染色体組換えの特徴と分子育種への応用・・・・… 第2章 マーカーアシスト浸透交雑によるヒラメリンホシスチス病抵抗性系統の作出・第3章DNAマーカーの汎用化を目指したアクアDNAブックの開発・・・・…
1
3
5
15 33 65 71 79 要約・・・・・・・・・・・・・・・・・・・・・・・・・・・・・・・・・・… 101 謝辞・・・・・・・・・・・・・・・・・・・・・・・・・・・・・・・… ?・・103〔課程博士〕
博士論文内容の要旨
(2,000字程度)報告番号
課博第 号
氏 名
藤 加菜子
(要 旨)論文題目 「DNAマーカーを用いたヒラメの分子育種学的研究」
我が国の漁業生産に占める養殖生産は、生産量で約20%、生産額で約30%に達している。世界的に見て も、養殖生産量は漁業生産量の約35%を占め、中国では68%に達しており、食糧資源としての養殖生産に 掛かる期待の大きさが伺われる。しかし、現在の養殖生産で使われている種苗は野生種とほぼ同じであり、 家畜・家禽のように野生種を人為的に選抜育種し、改良して生産性を高めたものはほとんどない。言いか えれば、養殖種苗には家畜・家禽と同じように生産性を改良できる可能性があると言える。選抜育種はそ の有効な手段ではあるが、育種目標を達成するのに長い年月を有するのが一般的であり、また、表現型を 頼りにする育種であるために、外観からその表現型が分からない病気に対する抵抗性を育種目標とする場合には、特に育種戦略が立てにくい。近年開発された分子生物学的手法を取り入れた連鎖解析に基づく
DNAマーカー選抜は、表現型と連鎖するDNAマーカーを原因遺伝子と見なして行う遺伝子型選抜であり、
選抜効率を飛躍的に高めるものである。 本研究では、食用魚として価値が高く、栽培漁業・養殖対象種として目本をはじめとするアジア諸国における水産業の中で重要な魚種とされているヒラメを対象として、DNAマーカーを用いた分子育種学的研
究を行い、有用経済形質を付加した新たな系統の確立を試みた。また、DNAマーカーの利用を汎用化する
ものとして、DNAマーカーを紙にプリントし、常温保存が可能な一冊の本として流通させるアクアDNA
ブックを開発した。DNAマーカーを用いた連鎖解析による有用経済形質関連遺伝子座の推定
分子生物学的手法を用いた先端的育種は、生産者の所得向上と消費者に良質で安い農畜産物を供給することを目的とし、栽培植物や家畜・家禽で近年盛んに行われている。その方法は、DNAマーカーを用いた
連鎖解析によって有用経済形質を支配する遺伝子座(原因遺伝子座)を推定し、原因遺伝子座と連鎖するDNAマーカーを遺伝指標として、親魚選抜や交雑による育種を行うものである。ここでは、分子育種学的
手法の水産業への応用を目指し、養殖現場で問題視されている、体色異常の一種である白化とウイルス性 のリンホシスチス病(LD)抵抗性、という二つの遺伝形質を支配する遺伝子座にっいて、DNAマーカーの一 種であるマイクロサテライト(MS)マーカーを用いた連鎖解析により座位の推定を試みた。白化に関しては、 戻し交配家系((白化♀×正常♂)×正常♂)を用いて解析を行い、複数の遺伝子座が関与していることを 明らかにした。LDに関しては、戻し交配家系((抵抗性系統♀×感受性系統♂)×感受性系統♂)を用い て解析を行い、1つり遺伝子座がLD抵抗性に強く関与していることを明らかにした。1
マーカーアシスト浸透交雑によるLD抵抗性系統の作出
病気に対する抵抗性は、体型などと異なり、その表現型を外観から判断することが難しい。そのために 育種目標としては、最も優先度が高いものの一つとされているにもかかわらず、家畜・家禽においても育 種が成功した例はほとんどない。本章では、連鎖解析で得られたLD抵抗性遺伝子座(LD−R)と連鎖するMSマーカーを用いたマーカーアシスト浸透交雑(MAI)によるLD抵抗性系統の作出を試みた。はじめに、
LD・Rと連鎖するMSマーカーを用い、LD・Rを有すると推定した♀親魚を選抜した。次に、この♀親魚と
商品として高い評価を得ている民間種苗生産会社の種苗生産用♂親魚を交配し、LD・Rを有する新たな系統 の作出を行った。この系統のヒラメと同種苗生産会社の市販用ヒラメとを民間養殖場にて比較試験した。その結果、MAIによって得たヒラメは、成長・色彩ともに市販ヒラメと遜色なく、:LD抵抗性に優れてい
た。本結果はMAIの有効性を示すものである。本手法を用いれば、複数の有用形質を併せ持ち、それ以外
の形質においては遺伝的多様性に富んだ系統を作出していくことが可能であり、新しい水産育種を後押し するものであると考える。DNAマーカーの汎用ヒを目指したアクアDNAブックの開発
本研究でDNAマーカー(MSマーカー)の分子育種における有用性が確かめられたが、MSマーカーの使
用にあたっての問題点もある。MSマーカーの使用では、データーべ一ス上に公開されたMSマーカー情報
を基に、研究者が自分の研究目的にあったマーカーを選び出し、合成を委託する、という手順を取るのが 一般的である。しかし、これらの情報は公開・非公開に関わらず、整備されていないのが実情であり、そ れを正確に読み取り使いこなすには多大な労力と時間を要する。そこで、MSマーカーの情報について記載 するだけではなく、MSマーカーそのものも紙にプリントし、一冊の本として常温保存出来るシステムとしてのアクアDNAブックの開発を試みた。DNAブックの基本概念は理化学研究所によって開発されたもの
で、アクアDNAブックはこの概念を用いてオリゴプライマーを紙にプリントしたところに特徴がある。本
ブックはMSマーカーの情報を一覧できるという理由で、実験設計を容易化するばかりでなく、プリント
されたMSマーカーは提供履歴を同じくするので、得られたデーターの共有化にもつながり、汎用性の高
いものである。本ブックを構成しているMSマーカーは、個体識別、親子判別、集団解析、系群判別など
あらゆる遺伝学的調査研究に有用であり、様々な研究者にとって利用価値の高いものである。本ブックには試みとして魚病診断用プライマーも掲載されているが、将来的には、多くの魚種で開発されたDNAマー
カーを掲載したDNAブックや、国内未侵入の魚病診断用プライマーを網羅したDNAブックなどへの応用
が可能である。本研究で得られたヒラメの分子育種学的知見やDNAマーカーの汎用化を目指したアクアDNAブックの
開発は、分子遺伝育種をはじめとする様々な研究の推進と産業の活性化に役立っものであると考える。緒論
人類は野生植物の栽培植物化と野生動物の家畜化に成功して以来、ある形質が親から子孫へ 伝えられるという、生物の遺伝的特性を利用して、人為的選抜育種による作物の選抜や家畜の 改良を積極的に行ってきた。このような歴史的背景の中で遺伝学(genetics)が生まれた。また、遺伝の仕組みを解明し、育種に生かそうとする考えの下、遺伝学の中から統計遺伝学
(statistical genetics)や分子遺伝学(molecular genetics)力弐派生した。更に、DNAマーカー が開発され、これらの考え方や技術が選抜育種に応用されるようになった。従来の選抜育種は、 表現型を頼りにする育種であるために、外観からその表現型が分からない形質を育種目標にす る場合には育種戦略が立てにくい。しかし、DNAマーカーを用いた選抜育種(分子育種)は、目で見えない形質を、目で見ることができるDNAマーカーの情報に置き換えて、選抜し、形
質を固定することが出来るという特長がある。従来の選抜方法にこの分子育種法を加えること で、農畜産分野の品種改良はさらに進展した。しかし、従来、野生種を対象として増養殖生産 を進めてきた水産分野では、農畜産物に比べ、従来からの方法による選抜育種自体が立ち遅れ ており、分子育種法を取り入れて育種効率の向上を果たした例は、著者の知る限りない。 我が国の漁業生産に占める養殖生産は、生産量で約20%、生産額で約30%に達している。 世界的に見ても、養殖生産量は漁業生産量の約35%を占め、中国では68%に達しており(平 成15年 漁業・養殖業生産統計年報勺、食糧資源としての養殖生産に掛かる期待の大きさ が伺われる。そこで、分子育種を取り入れた選抜育種によって、水産育種の育種効率を高3
めるために、本研究に取り組んだ。 本研究では、食用魚として価値が高く、栽培漁業・養殖対象種として日本をはじめとす るアジア諸国における水産業の中で重要な魚種とされているヒラメを対象種とし、ヒラメ DNAマーカーを用いた、有用経済形質に関与する遺偉子座の推定及び、その結果を基に、 有用経済形質を付加した新たな系統の確立を試みた。また、分子育種をはじめとする様々
な遺伝学的調査・研究に有用なDNAマーカーの利用を汎用化することを考え、DNAマー
カーを紙にプリントし、常温保存が可能な一冊の本として流通させるアクアDNAブック
を開発した。 歯:平成15年 漁業・養殖業生産統計年報,2005.農林水産省統計部p34−37,p243.第1章
DNAマーカーを用いた連鎖解析による
メンデルの法則の再発見以後、動植物の遺伝育種による品種改良、特に経済形質(肉質、 一腹子数、産卵時期、抗病性など) と呼ばれる産業上重要な表現形質を制御することは、 この研究分野において最終目標となっている。しかし、経済形質の多くは多数の遺伝子座
が関与すると同時に環境の影響を受けるため、変異が連続的な量的形質(quantitative
trait;QT)を示すのが一般的である。これらのQTを支配する遺伝子座(quantitativetrait locusl QT:L)の推定及び発現機構の解明には多くの肉難が伴うため、古くからその重要性が認識されてきたが進展はほとんどなかった。しかし1980年代後半のDNAマーカーの登場
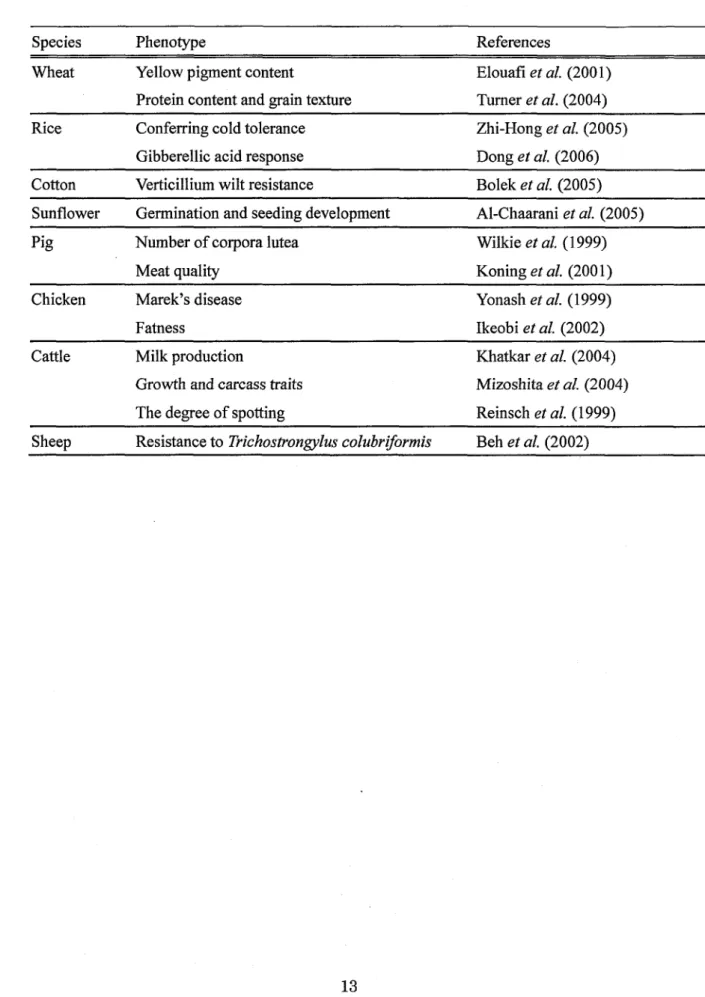
は、この研究事情を一変させた。現在広く使われているマイクロサテライトと呼ばれるDNA マーカーは、ゲノム上に広く散在する塩基の繰り返し配列の配列数の違いに基づくDNA多 型を検出できるもので、1組の交配親に由来する家系において親子問の遺伝情報が得られる マーカー座は数百以上に及ぶ。このことを利用して、全染色体領域をカバーできる詳細な 連鎖地図が作製されるようになった。これが基盤となり、連鎖地図に基づいてQTLの位置 と遺伝効果を推定する解析(QTL解析)が行われるようになり、着実に成果をあげつつあ る。現在、QTL解析はモデル生物から家畜まで幅広く行われており、様々な形質に関与す る遺伝子座を推定した報告がある (Table1,Table2)。 有用経済形質関連遺伝子座の推定は、品種改良や育種効率の向上へとつながる。すなわち、ひとたびQTLが推定されると、QTL近傍にあるDNAマーカーがQTLと連鎖して親
子間を遺伝する性質を利用して、QTLを有する親をDNAマーカーを指標に選抜すること
が出来、有用なQTが固定された子孫を得ることが出来る。更に、このQTを他の有用形質
をもつ系へ導入することで新たに、複数の有用形質を合わせ持っ系統を作出することも可 能である。従来の選抜育種は、表現型のみに着目して行っていたために、保持させたい有 用形質を、確実に保持させることができなかったり、長年同じ親を使い続けてきたために、 遺伝的偏りが生じたりしていた。しかし、DNAマーカーを用いた育種を行えば、持たせた い有用形質を確実に保持させ、なおかつその他の形質においては多様性をもった集団を作出することができる。 そこで、本章では、DNAマーカーの一種であるマイクロサテライト(MS)マーカーを用 いて、ヒラメ養殖において問題視されている、白化 (体色異常)と、ウイルス病の一種 であるリンホシスチス病(LD)について、それらの形質に関与する遺伝子座の推定を、連 鎖解析によって行った。
7
文献
Al−Chaarani,G R,Gentzbittel,L.,W¢dzony,M,,Sarrafi,A.,2005.Identification of QTLs fbr germination and seedling development in su㎡10wer(地11αn孟加sαnn鰍3L.). Plant Science169,221−227. Beh,K.,J.,Hulme,D.,J.,Callaghan,M.,J.,Leish,Z.,Lenane,1.,Windon,R.,G., Maddox,J.,F.,2002.Agenome scanfbrquantitativetraitloci affbctingresistanceto 聾∫ohos翻ongylμs co1μ67がう7ηπs in sheep.!㎞mal Genetics33,97−106. Bolek,Y,E1−Zik,K.,M.,Pepper,A.,E.,BeI1,A.,A.,Magil1,C.,W.,Thaxton,P,,E., Redd》も0.,U.,K.,2005。Mappingofvertic皿umwiltresistance genes incotton.Plant Scince168,1581−1590. cnaani,A.,Hallerman,E.M.,Ron,M.,weller,J.1.,Indelman,M.,Kashi,Y.,Gal1, G.A。E.,Hulata,G。,2003。Detection ofa chromosomal region with two quantitative trait loci,affbcting cold tolerance and fish size,in an F2tilapia hybrid.Aquaculture 223,117−128.. Danzmam,R.G.,Jackson,T.R。,Ferguson,M。M.,1999.Epistasis in allelic expression atupPertemperature tolerance QTL inrainbowtrout。Aquaculture173,45−58. Dong,Y,Kamiuten,H.,Yang,Z.,Lin,D.,Ogawa,T,,Luo,L.,Matsuo,H.,2006. Mapping ofquantitative trait Ioci fbr gibberellic acid response at hce(Oryza sativ& L。)seedling stage.Plant Science170,12−17。 Elouafi,1.,Nachit,M.M.,Ma並in,L.M.,2001.Identi五cation of a microsatellite on c㎞℃mosome7B showing a strong linkage with yellow pigment in du㎜wheat (丁責ticum turgidum L va監durum)。 F両i.K,,Kobayashi.K.,Hasegawa,O.,S&kamoto,T.,Okamoto,N。,2006。Identificationof a single m司or genetic locus controlling the resistance to lymphocystis disease in Japanese flounder(Pα7α1’oh〃ηs o1’vα6θ〃5),Aquaculture in press. Hara,T.,Nagase,T.,Kuwada,T.,To㎞hara,T.,ozaki,A.,Sakamto,T.,Okamoto,N., 2004.A genetic linkage map ofamago salmon(Onoo7勿nohμs7nαso〃’sh∫伽αθ)and mapPing of two QTL associated with smoltification。29th Intemational confbrence onAnimal GeneticsbyISAG。AssociationbetweenMarkers andTraits:Tokyo Japan。 Sept14。 Ikeobi,C.,0.,N.,W6011iams,J.,A.,Monice,D.,R.,Law,A.,Windsor,D。,Burt,D.,W, Hocking,P,M.,2002.Quantitativetrait loci af飴cting fatness inthe chicken・Animal Genetics33,428−435. Jackson,T.R.,Danzmam,R.G.,Ferguson,M.M.,Fishback,A.G.,Ihssen,P.E。, o’come1.M。,crease,TJ.,1998.IdentiHcation of two QTL innuencing upPer temperature tolerance in t㎞lee rainbowtrout(Onoo7勿noh祝s n卿窺ss)half』sib families.
Heredity80,143−15L
Khatkar,M.,S.,Thomson,P.,C.,Tammen,1.,Radsma,H.,W.,2004.Quantitativetrait loci mapping in dairy cattle:reviewandmeta−analysis.genet。Sel.EvoL36,163−190. Khoo,S.K.,Ozaki,A,,Nakamura,F,,Arakawa,T.,Ichimoto,S.,Nickolov,R., Sakamoto.T.,A㎞tsu,T.,Mochizu】d,M.,Denda,1.,Okamoto,N。,2004。 Identification of a novel chromosomal region associated with in艶ctious hematopoietic necrosis(IHN)resistance in rainbow trout Onoo吻ynohμsη2ッ窺ss.Fish I》athology39,95−101. Koning,D.,J。,d.,Harlizius,B.,Rattink,A。,P.,Groenen,M.,A.,Brascamp,E.,W.,van Arendonk,J.,A.,v.,2001.Detection and characterization ofquantitative trait loci fbr meat qualitytraits inpigs。」。Anim.Sci.79,2812−2819.9
Mizoshita,K.,Watanabe,T,Hayashi,H.,Kubota,C・,Yiamakuchi,H.,Todoroki,J., sugimoto,Y,2004。Quantitative trait loci analysis fbr growth an(l carcass tmits in a half』sib㎞ily of purebred Japanese Black(Wagyu)cattle.J。Animal Sci.82, 3415−3420. Moen,T.,Agresti,J。J。,Cnaani,A.,Moses,H.,Famula,T.R、.,Hulata,G.,Ga11,G.A.E., May,B・,2004・A genome scanofafbur−waytilapiacross supports the existence ofa quantitative trait locus fbr co1(I tolerance on linkage group23.Aquaculttre Research 35,893−904. Nakamura,K.,Ozaki,A.,A㎞tsu,T.,Iwai,K.,Sakamoto,T.,Yoshizaki,G.,Okamoto, N.,200L Genetic mapping of the dominant albino locus in rainbow trout (Onoo吻nohπs砂ん’ss).MolecularGeneticsandGenomics265,687−693. Nichols,K.M,,Bartholomew,J。,Thorgaard,G.H。,2003,Mapping multiple genetic loci associated with C6雌‘o鵬α8hαs如resistance in Onoo7,妙noh麗s吻y窺ss.Diseases of Aquatic Organisms56,145−154。 Ozaki,A.,Sakamoto,T.,Khoo,S.,Nakamura,K.,Coimbra,M.R.M.,Akutsu,T., okamoto, N., 2001. Quantitative trait Ioci (QTLs) associated with resistance/susceptibility to infbctious pancreatic necrosis virus(IPN’V)in rainbow trout(On607勿noh欝麗擁∫ss)。翠01ecularGenetics and Genomics265,23−31。 Ozaki,A.,De,Leon,F.G.,Glebe,B.,Ferguson,M.M。,T.Woo,P.T。K。,Danzmann, R.G.,2003.Identification of QTL fbr resistance to(cαρroδ’αsα11nos漉oα)infヒction in ATLANTIC SALMON(Sα1解o sα1α7):A model fbr pathogen resistance QTL。the VIIIth Intemational Symposium Genetics in Aquaculture by ISGA,Genes and genome mappingξmdmanipulations:Puerto Varas,Chile。Nov.11。 Perry,G・M・,Da皿乙malm,R・G・,Ferguson,M・M・,Gibson,J・E・,2001・Quantitative tr&it
Ioci fbr upper thermal tolerance in outbred strains of rainbow trout(On607勿noh%s 脚窺ss).Here(iity,86,333−341. Reinsch,N.,Thomsen,H。,Xu,N.,Bhnk,M.,LooR,C.,Kalm,E.,Broc㎞am,GA., Grupe,S.,Ku㎞,C。,Schwerin,M.,Leyhe,B.,Hiendleder,s.,Erhardt,G, Me両ugorac,1.,Russ,1。,Forster,M.,Reents,R.,Averdunk,G,1999.A QTL fbr the degree of spotting in cattle shows synteny with the KIT locus on chromosome6.J. Here(1.90,629−634. Ro面guez,M.F.,LaPa往a,S。,Williams,S.,Famula,T.,May,B.,2004。Genetic markers associate(1with resistance to infもctious hematopoietic necrosis in rainbow and steelhead trout(Onoo7々ynoh鰐溺ッ初ss)backcrosses.Aquaculture241,93−115. Robison,B.D.,Wheeler,P.A.,Sundin,K.,Sikk&,P.,Thorgaard,G.H.,2001.Composite interval mapping reveals a m句or locus influencing embryonic development rate in rainbowtrout(Onoo吻・noh鉱s級卿s5).The Joumal ofHeredity92,16−22. Sakamoto,T.,Danzmann,R.G.,Okamoto,N.,Ferguson,M.M.,Ihssen,P.B.,1999. Linkage analysis of quantitative trait Ioci associated with sp&wning time in rainbow trout(On60吻ynoh㍑s lnlyた’ss).Aquaculture173,33−43. Somo加i,1.M.L.,Danzmam,R..G.,Ferguson,M.M,2003.Disthbution oftemperature tolerance quanti重ative trait loci h1!Vctic charr (Sblvθ11n鋸s α加inzイs) and infbrred homologies inrainbowtrout(Onoo吻ノn6hμs lnッ耐s5)。Genetics165,1443−56。 Tumer,A.,S.,Bradbume,R.,P。,Fish,L.,Snape,J.,W.,2004.New quantitative trait Ioci influencing grain texture and protein content in bread wheat。Joumal of Cereal Science40,51−60. Wilkie,P.,J.,Paszek,A.,A.,Bea従量e,C.,W.,Alexander,L.,J.,Wheeler,M.,B., Schook,L.,B.,1999.A genomic scan ofporcine reproductive traits reveals possible 11
quantitative廿ait Ioci(QTLs)fbmumber ofco印ora lutea。Mammalian Genome10, 1432−1777. Ybnash,N.,Bacon,LD.,Witter,R..L.,Cheng,H.H.,1999.High resolution mapping an(l identification of new quantitative trait loci(QTL)af琵cting susceptibility to Marek蜜s disease.Anim.Genet.30,126−135. zhi−Hong,Z.,Li,S。,W¢i,L,W6i,C。,Ying−Guo,z。,2005.A m勾or QTL conf6n!ing cold tolerance at the early seedling stage using recombinant inbred lines of rice (0πソzαsα1ゴvαL.).Plant Science168,527−534. Z㎞me㎜an,A.M。,Wheeler,P A.,Ristow,S.S。,Thorgaard,G H。,2005.Composite interval mapPing reveals three QTLassociate(1wi重h pyloric caeca number in rainbow trout,Onoo7勿nohμs那yん’ss.Aquaculture247,85.95.
Table l Mapping of eeonomically important traits in domestic animals and crops
S pecies Phenotype References
Wheat
Yellow pignent contentProtein content and grain texture
Elouafi et al. Turner et al.
(200 1) (2004) Rice Conferring cold tolerance
Gibberellic acid response
Zhi-Hong et al. (2005) Dong et al. (2006)
Cotton Verticillium wilt resistance Bolek et al. (2005)
Sunflower Germination and seeding development Al-Chaarani et al. (2005)
Pig Number of corpora lutea Meat quality
Wilkie et al.
Koning et al.
( 1 999) (2001)
Chicken Marek's disease
Fatness
Yonash et al. (1999)
lkeobi et al. (2002) Cattle Milk production
Growih and carcass traits The degree of spotting
Khatkar et al. (2004) Mizoshita et al. (2004) Reinsch et al. (1999)
Sheep Resistance to Trichostron ylus colubriformis Beh et al. (2002)
Table2 Mapping of economically important traits in aquaculture fishes
Fish Phenotype References Rainbow trout
(Oncorhynchus mykiss)
Infection pancreatic neerosis (IPN) resistance Infection hematopoietic necrosis (lllN) resistance
Myxospoea (Ceratomyxa shasta) resistance
Upper temparature tolerance
Spawning time
Early deveropment of embrios Dominant albino
Number of pyloric caeca
Ozaki et al. (2001) Khoo et al. (2004) Rodriguez et al. (2004) Nichols et al. (2003) Jackson et al. (1998) Danzmann et al. (1999) Peny et al. (2001) Somorjai et al. (2003) Sakamoto et al. (1999) Robison et al. (200 1) Nakamura et al. (200 1 ) Zimmerman et al. (2005) Arnago salmon
(Oncorh lchus masou ishikawae)
Osmotic ireguretion Hara et al. (2004)
Atlantic salmon
(Salm o salar)
Cryptobiosis resistance Ozaki et al. (2003)
Arctic char
(Salvelinus alpinus)
Upper temperature tolerance Somorjai et al. (2003)
Thilapia
(Oreochromis niloticus)
Lower temperature tolerance Cnaani et al. (2003) Moen et al. (2004) Japanese flounder
(Paralichtllys olivaceus)
第1節
1.はじめに ヒラメの体色異常は、他の異体類同様、天然個体、飼育個体を問わず、しばしば見られ る(Seikai,19971Bolker and H:il1,2000)。その中でも、本来黒褐色であるはずの有眼側の 体色が一部白色になる白化(pseudo albinism)は商品価値の低下をまねくため、養殖産業 上、解決すべき大きな問題の一つである。日本では、1980年代頃から体色異常を引き起こ す原因の解明と有効な防除策についての研究が進められ、主に、種苗生産時の餌料や栄養、 飼育環境に着目した研究が多く報告され(Seikai,1997)、改善が進められた。しかし、白化 には複数の遺伝子の関与が示唆されており(Tabata,1991)、また、白化になりやすい系統、 なりにくい系統の存在も知られている。そこで、本章では、選抜育種による白化個体出現
率の抑制を目指し、DNAマーカーを用いたQTL解析によって、白化に関連する遺伝子座
の推定を行った。2.材料及び方法
2・1解析家系 解析家系として戻し交配家系を作出した。そめ作出には、白化個体出現率の高い系統、 KP・Cと、白化個体出現率の低い系統、KP・Aを用いた。これらの系統は、表現型に基づい た選抜によって、神奈川県水産技術センターにて継代飼育されてきた。KP・Cの平均白化個 体出現率は77.8%であり、KP・Aの平均白化個体出現率は19.1%であった(Table1)。KP−C 雌個体 (白化)とKP・A雄個体 (正常)を交配し、F1(KP・CA)集団を作出した。KP・CA 集団中の雌個体(白化)と親であるKPrA雄個体を戻し交配し、戻し交配集団(K:P・CAA) を作出した(Fig.1)。 戻し交配集団(KP・CAA)の受精卵を100L水槽に収容し、70Lの海水で平均水温15.5℃ で止水飼育した。受精3目後、500L水槽に移し、流水飼育した。水温は15.5℃から22,5℃の範囲で飼育した。艀化後25目目までは、餌料としてワムシ伽訪加囎p加a畝θを与え、
15目目から60目目までは、アルテミア1蛎θ盟姦53左∬8を与え、30目以降は市販の配合
飼料を与えた。 2−2白化面積占有率 (表現型) の判定 戻し交配集団(KP・CAA)238個体の表現型値の判定を、艀化後3ヶ月目に行った。始め に、有眼側体表面の撮影を実体顕微鏡に取り付けたデジタルカメラ(Canon,IXYDIGITAL200a)によって撮影した。次に、これらをコンピューターに取り込み、画像解析ソフト
(Adobe Photoshop6.0,Adobe Systems,San Jose,CA)で個体ごとに有眼側体表面積と白 化部位の面積を測定し、白化面積占有率を算出した (白化面積占有率(%)二白化部位の面 積/有眼側体表面積x100)。なお、背鰭、尻鰭、尾鰭は、肉眼では白化の有無の判別が困難 なため測定対象に含めなかった。 172・3マーカー分離型の判定
表現型の判定を行った戻し交配魚の尾鰭を1cm角の大きさで採取し、100mMNaC1、20
mMTris・H:C1(pH8.0)、100mMEDTA、1.0%SDS、100pglm1Proteinase Kを含む消化
溶液を600F1加え、37て)で一晩静置した。フェノール/クロロホルム(1:1)抽出を1回行った後、エタノール沈殿にて染色体DNAを析出させた。回収したDNAは70%エタノールで洗
浄、乾燥後、TE溶液(0.01MTris・HCIpH7.4,2.5mM EDTApH8.0)50F1に溶解した。本解析にはヒラメマイクロサテライト(MS)マーカーを用い、2。5pmoHbrwardprimer
と[Y33P】ATP、T4polynucleotide kinaseによって標識した0.17pmoheverse phmer、 0.175mM eachdNTP、 20mMTris・HC1(pH8.4)、 50mM:KC1、 1.5mMMlgCl2、 1%BSA、025U%gDNApolymerase(TakaraBio)、50ngのテンプレートDNAを含む11F1
の溶液で、GeneAmp PCR System9600thermalcycler(Perkin−Elmer)にて、PCRを行
った。PCR反応は、95℃,2分→(95℃,30秒→各プライマーのTm(℃),1分→72℃,1分)x35サイクル)→72℃,3分とした。反応後、等量のLoadingdye(95%fbrmamide,10mMEDTA,
0.05%bromophenolblueandxylenecyanoDとよく撹搾し、PCR産物を熱変性によって1
本鎖にし、6%アクリルアミドゲルにて電気泳動を行った。その後、1時問乾燥させたゲルを、Imaging Plate(IP)に3∼12時間感光させ、放射線の感光像が記憶されたIPを
Bio・imageAnalyzer(BAS1000,FujiPhotoFilms,Japan)で読み取り、コンピューターで 映像化し、マーカーによって増幅されたアリルの分離パターン (マーカー分離型)を判 定した。 2・4連鎖解析 ヒラメ遺伝子連鎖地図(unpubli曲ed)に基づき、全ての連鎖群(LG)において効率よく関連遺伝子座を探索できるように76個のMSマーカーを選び出した。それらのマーカーを
用いて、戻し交配魚44個体とその両親および祖母のマーカー分離型の情報を収集し、各マーカー間の連鎖検定と組換え価の推定をMap藍anager QT2968k(M&Hly and olson,
1999)を用いて行った。
2’5QTL解析
解析は3段階に分けて行った。第1段階では、表現型の判定において極端に白化面積占
有率が異なっていた戻し交配個体 (白化面積占有率の高かった個体と低かった個体) の マーカー分離型の情報を収集して、κ2検定により表現型とマーカー分離型との対応関係を調ぺた。第2段階では、解析個体数を238個体に増やし、第1段階の検定で有意であった
マーカー(ρく0.05)に加えて、同じ連鎖群上に位置するMSマーカーを用いてマーカー分離型の情報を収集し、表現型とマーカー分離型との対応関係を調べた。第3段階では、第2
段階の結果、有意だったマーカーが属する連鎖群においてInterval mapping法を、Map
M&n&geQT2968k(Manlyanα01son,1999)のIntervalm&ppingalgorithmsを用いて試
みた。この方法は、マーカー座位だけではなく、隣接するマーカーの情報を基に、連鎖群上の全ての座位でQTLの検出を試みるQTL解析のための統計的手法である。また、結果
の有意性を同ソフトウェアの、解析によって得られた結果がどの程度高いかを評価する検 定法である、Permutationtest(Church皿andDoerge,1994)によって閾値(LRS値)を求 めた。その際、有意水準0.63の閾値をSuggestive、0.05の閾値をSigni丘cant、0.001の閾 値をHighly signi丘cantと評価した(LanderandKruglyak,1995)。 193.結果 3−1白化面積占有率の判定 戻し交配家系KP−CAAの、体表の白化面積占有率の分布を度数分布表にて示した(Fig.2)。 実際のソフトを用いた解析には、白化面積占有率を標準化し((各データ値一各解析家系 の総データの平均値)÷標準偏差)、その値を表現型値としたものを用いた。解析家系中の表 現型値がマイナスを示した個体 (正常個体) は59.7%であり、表現型値がプラスを示し た個体 (白化個体) は40.3%であった。 3・2連鎖解析
連鎖解析に使用した76個のMSマーカーのうち、48個のMSマーカーが戻し交配家
系宜P・CAAにマップされた。残りのMSマーカーは本解析家系において多型が確認されな
かった。また、LG19に関しては、ヒラメ遺伝子連鎖地図(unpublished)LG19上のMSマ
ーカー全てに多型が見られなかったため、解析を進めることができなかった。 3・3QTL解析第1段階において、κ2検定により戻し交配家系鯉・CAA集団(n=44)における表現型
と48個のMSマーカーによるマーカー分離型との対応関係を調べた結果、6マーカー座に
おいて有意な結果(ρ<0.051自由度1,κ2ニ3.84)が得られた(Table2)。そこで、第2段階で解析個体数を238個体に増やし、第1段階で有意であったMSマー
カーと同じ連鎖群上に位置するMSマーカーを用いてマーカー分離型の情報を収集し、表
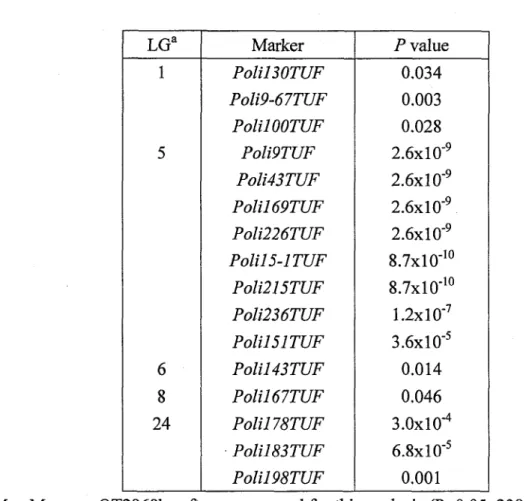
現型とマーカー分離型との対応関係を調べた(T&ble2)。その結果、5連鎖群に属する16個のマーカー(:LGllん直13071珊踊9首7Z朋鋤”OT乙珂:LG51ん塑r乙珊ん五43丁乙珂
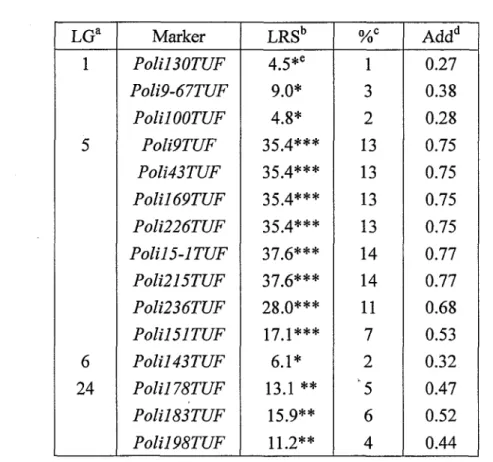
Pb五169丁乙辺Pb万226丁昭ノ〕b五15−1丁乙凋」%万215丁乙昭ノb五236丁乙珂%直151丁乙辺LG6; ん五143丁研LG8;ん五167丁乙辺LG241ん五178丁乙研ん五183丁砥踊798丁乙伍)を白化関 連遺伝子座との連鎖候補マーカーとして見出しだ(Table3)。これらのマーカーが連鎖するQTLは白化形質の1∼14%を説明するものであった。
第3段階において、第2段階で候補となったマーカーが属する連鎖群毎にInterval
mapping法によってQT:Lの位置を推定し、Permut段tiontestによって有意性を評価した。その結果、2連鎖群に属する11個のマーカー(LG51伽19丁顔鋤43丁岬ん直1691丁研
ん五226丁研」Pb万15−1丁研」Pb彪215丁珊ん五236㎜ん万151丁乙ワリLG24;、PbZ1178丁醐 ∫b五183丁珊ん直198丁伽がHighlysigni五cantleve1、Sign迅cantlevelを示した(Table 4,Fig.3)。LG5に推定された白化関連遺伝子座をpseudo・albinism・1(PA・1)とし、LG24 に推定された遺伝子座をPA・2とした(Fig.3,Fig.4)。LG5に属し、PA・1と最も強い連鎖関係にあったマーカーはん五215Trとん五15・1丁即で、これは白化形質の14%を説明す
るものであった。また、LG24に属し、PA・2と最も強い連鎖関係にあったマーカーは
Po五183Trで、これは白化形質の6%を説明するものであった(Table3)。 214.考察
本研究において、2つの主要白化関連遺伝子座、PA・1とPA・2が推定された。PA・1は
LG5上に推定され、PA・2はLG24上に推定された。PA・1と最も強い連鎖関係にあったマ
ーカーは1%五215丁研とん万15−1(1辱8.7×10’10)であった。また、PA−2と最も強い連鎖関 係にあったマーカーは」%互183Tr(」卑6.8×10’5)であった。本研究で利用した遺伝子連鎖地図(unpublished)は、217個のMSマーカーがマップさ
れているが、本解析家系では、LG19上に多型が認められるマーカーがなく、:L(}19に関し ては解析を進めることがさきなかったことより、解析に十分なマーカー数であった、とは 言いがたい。現在、このような現象を解消し、より詳細な解析を進めるために、1000個程度のMSマーカーよりなる遺伝子連鎖地図の詳細化を進めている。詳細化された連鎖地図
を用いれば、LG19上に、またその他のLG上にも、新たな白化関連QTLが検出される可
能性がある。また、すでに見つかっているPA』1、PA−2についても原因遺伝子とより強く連 鎖するマーカー (原因遺伝子により近いマーカー)が得られるものと期待できる。近年、 有眼側体表の白化のメカニズム解明が、正常個体と体色異常個体の体色発現機構の比較に より、進められている。その結果、外部及び内部形態の左右相称化 (正常な異体類は左右 不相称を示す)によるものである、という見解が示されている (Seikai,1997)。別の研 究で、左右不相称化を支配する遺伝子の存在が示唆されている(H飴himoto肱21,2002)。 本研究で推定された白化関連遺伝子座と左右不相称化に関与する遺伝子との関連は非常に 興味深い。今後、両者の関係を調べ、更なる詳細な解析を進めることは、白化に関する原 因遺伝子を特定する一つの手段であろう。しかし、本研究でQTL解析を行った目的は、DNAマーカーを用いた選抜育種によって
白化個体出現率を抑制することにある。そのために必要なのは、いくつもの小さいQTLを 検出することではなく・目的形質を支配する主要なQTLを検出し・その情報を育種に応用していくことである。本研究では、2つの主要白化関連遺伝子座が推定された。それぞれ の遺伝子座と強く連鎖しているDNAマーカーは、マーカー選抜育種に有効なマーカーであ
ると考える。
文献
Bolker,」。,A.,Hill,C.,:R。,2000.Reviewpaperl Pigmentation development in hatc}1e1y−reare(I flat昼shes.J.Fish BioL56,1029−1052. Churchi11,GA.,Doerge,R,W,1994。Empihcalt丘reasholdvaluesfbrquantitativetrait mapping。Genetics138,963−971. Hashimoto,H.,Mizuta,A.,Okada,N。,Suzuld,T.,肱gawa,M.,Tabata,K.,Ybkoyama, Y,Sakaguchi,M.,Tanaka,M.,Toyohara,H.,2002.Isolationandcharacterizationof aJapanese flounder clonal line,reversed,which exhibits reversal ofmetamo甲hic 1ピ資一rightasymmetry.Mech,Develop,111,17−24. Lander,耳.and Kmglyak,L。,1995.Genetic dissection ofcomplextraits:reporting linkage results.Nature Genetics11,241−247. Manly,.K.E,01son,J。M.,1999。OverviewofQTLmapPingsoftware and introductiontoMapManagerQT。Mamm.Genome lo,327−334。
Seikai,T,,1997.Mechanismofabnomalpigmentation.Biologyand Stock Enhancement ofJapanese floundeL Koseisha.一Koseika㎞,Tokyo,63−82pp,(in Japanese). 肱bata,K.,1991.Genetic factory ontheAlbinism ofHiramePα7α110h∫勿s ol∫vαoθ鰐. Suisan Zoshoku39,29−35.Table 1 Ratio of pseudo albinism observed at Kanagawa Prefectural Fisheries
Technology Center
Number of pseudo-albinism
*Percent ratio (o/o) = x 100 Total number of each strain fish
Table 2. Microsatellite markers typed in KP-CAA backcross families
a; Linkage group names were according to the Japanese flounder genetic linkage map
generation2 (unpublished).
b; Number of markers typed at stage I ; 22 pseudo-albinism and 22 normal individuals from the KP-CAA were typed at 48 marker loci.
Table 3 . QTL affecting pseudo albinism in the experimental family
Map Manager QT2968k software was used for this analysis (P<0.05, 238 informative
progeny, Additive regression model with no control for other QTL) .
a; Linkage groups were designated according to the Japanese flounder genetic linkage map generation 2 (unpublished).
Table 4. Results of interval mapping in the experimental family
a; Linkage groups were designated according to the Japanese flounder genetic linkage
map generation 2 (unpublished).
b; LRS, Likelihood ratio statistic for the association ofthe trait with this locus.
c; Phenotypic trait variation explained by QTL.
d; Additive regression coefficient for the association.
e; The threshold values of the pennutation test, which are labeled Suggestive (shown as single(*)asterisk at this table), significant (shown as double(**)asterisks) and highly significant (shown as triple(***) asterisks), are taken from the guidelines of
KP-C strain
pseudo albmism
KP-A strain
c71 normal pseudo albinism F I hybrid (KP-CA)e Backcross fainilv (KP-CA )
Fig. I . Schematic representation of the experimental population I used in this study.
LG5
45 40 35 30 25 20 15 lO 5 O PA- 1 Cl)O< Highly significant level rgn' cant eve Suggestive level Polil5-1 TL;F Poh215TVF ¥ POh9TDF Poli43TZ)F Pohl 69TL ' poh226TL T 18 16 14 12 u) lO 0
l8
6 4 2 OLG24
Polil 78TUF Posrtlon(cM) Poli223TCEI poh 72M :S
Fig. 3. Evidence for QTL affecting pseudo albinism. Test statistics curves following interval mapping analysis of the Japanese flounder linkage group 5 and 24 in KP-CAA.
Significant QTL are identified by name, and their most likely positions.
0.8
- i
15.8 i 3.7 Poll9TZlF Poll43TllF Polll697uF Poll22677lF Polil5-1 77AF P01215TZAF Poll23677lF - Polil5177lFPA- 2
0.8 2.1 35.4 2.1 Polil78TZlFPokl83TuF
Polll98TZl!F Poll223TZlF Poll72MHFSLG5
LG24
Fig. 4. Location of significant QTL affecting pseudo albinism in KP-CAA. Markers are
shown on the right of each linkage group, Numerical values on the left are the genetic
distances estimated in this QTL mapping study. QTL affecting pseudo albinism is
named PA- I on LG5 and PA-2 on LG24. A bold ellipse indicates the approximate
2
:
I: / O) :/;
/7 ;
f ; ,
; i: L q)# j
Fuji, K., Kobayashi, K., Hasegawa, O., Coimbra, M.R.M., Sakamoto, T., Okamoto' T.,
ldentification of a single maj or genetic locus controlling the resistance to lymphocystis disease in Japanese flounder (Paralichthys olivaceus). Aquaeulture 2006
1αent韮∬cation of a single major genetic locus controlling the resistance to lymphocys翻s disease in Japanese l皿ounder(Pα7α〃6彪‘勿s oJ’vαoεμ3)
K燃繭ia,K認㎜。buK。bayas短a,OsamuHasegawab,M曲RaquelM。ura
Coimbrac,Takashi Sakamotoa,Nobuaki Okamoto灸* α勘吻ヴ物7inσSo’θnoε,乃加伽ve7sめノヴ漁7’nεSo’θno8αn4乃ohnolo9拷 魚)nαn4,ノ協腕α∫o,7b1砂0108−847Z Jゆαn bκαnα9卿αP瞬伽α1伽hθ71εsRθsεαア・h血s伽θ,漁7α,働nα9僻α238−023Z抑αn
oD卿枷膨n∫04θPεSωε幻μ’0〃1競¢伽Vθ7S漁4εEθ4θ7α1ぬ7α1飽Pε7nα励μ00, Do∫s〃〃2δos,52171−900飽o旋一pEB7αzi1 *Con℃sponding autho二Tel:+81−3−5463−0547;蝕x:+81−3−5463−0552e−mai1:一(N Okamoto)
Abstract
Japanese flounder (Paralichthys olivaceus) is an economically important fish as a
food, and has been widely cultured in Asian countries such as Japan, Korea and China.
We chose to study lymphocystis disease (LD) because it has become widely spread in
these countries and seriously damaged fish farnrs. LD is an lridovirus-induced infeetion.
Japanese flounder affected with LD develop characteristically hypertrophied cells,
called lymphocystis cells, on skin, fins and/or mouth. Fish with lymphocystis cells lose
commereial value because they are ugly. Lymphocystis cells on the mouth prevent
proper feeding and in the worst case can lead to starvation. The disease is thus costly to
farmers. There are presently no treatment for LD nor commercially available vaccines.
In this study, we tried to identify the LD-resistance locus (LD-R) by linkage analysis
because it may facilitate the effort for the establishment of LD-resistance strains.
We used 50 microsatellite markers to search for a locus associated with resistance to
LD in Japanese flounder. Linkage tests were conducted in a backcross progeny (n= 1 3 6)
produced by the crossing a susceptible male with a (susceptible x resistant) hybrid
fernale.
One maj or locus for LD-R was detected on linkage group (LG) 1 5 of the Japanese
flounder genetic linkage map. On LG15, a microsatellite marker (Poli.9-8TUF)
explained 50e/o ofthe total phenotypic variation in the 1 3 6 individuals screened.
Therefore, it can be considered as a candidate locus for marker-assisted breeding in
order to enhance selective efficiency for LD resistance.
Keywords: Iinkage analysis, microsatellite marker, disease resistance, Japanese flounder,
1. Introduction
Recently developed techniques in molecular biology have made it possible to dissect
some traits genetically. Genetic linkage maps based on DNA markers are an important
tool in these techniques. The use of DNA markers facilitates the eventual positional
cloning of the functional genes contributing to the quantitative trait (Collins, 1 992).
Marker-assisted selection (MAS) and/or marker-assisted gene introgression (MAI)
using DNA markers can improve breeding programs for doniestic animals and food
crops. A nunrber of studies have contributed to breeding programs by identifying loci
influencing quantitative traits in domesticated animals (e.g., pig and cattle) and food
crops (e.g., wheat and rice) (Andersson et al., 1994; Georges et al., 1995; Elouafi et al.,
2001 ; Kwon et al., 2001),
To identify individual loci controlling traits of economic significance to fisheries, it is
presently necessary to construct a genetic linkage map based on molecular markers at a
large number of sites in the genome. The first microsatellite linkage map of rainbow
trout was constructed by Sakamoto et al. (2000) and a more detailed map was produced
by Nichols et al. (2003). It is the most comprehensive map for aquaculture species,
consists of a total I ,359 markers, mainly of AFLP and microsatellites markers with
some variable number of tandem repeats (VNTR) and structure genes. Atlantic
salmon map has been made recently available (Moen et al., 2004; Gilbey et al., 2004).
High quality microsatellite linkage maps of channel catfish, tilapia and Japanese
flounder are also constructed (Kocher et al., 1998; McConnell et al., 2000; Waldbieser
et al., 2001; Liu et al., 2003; Coimbra et al., 2003; Lee et al., 2005). The linkage maps
of shrimps are characteristically created with AFLP markers as high frequency and
extended length of simple sequence repeats make the isolation of microsatellite markers
difficult in this species (Moore et al., 1999; Wilson et al 2002 L1 et al 2003) The
map of common carp has been constructed wrth nucrosatellites and random
amplification of polymorphic DNA (RAPD) markers by Sun and Liang (2004). One
publication shows two types of genetic linkage maps, one male and one female, for two
species of yellowiail constructed using F1 population of an intercross between Seriola
quinqueradiata and S. Ialandi (Ohara et al., 2005). This approach shows interesting
results with a wide variation of DNA polymorphisms.
These linkage maps have facilitated the analysis of quantitative trait loeus (QTL) that
control cornplex traits such as disease resistance, growih, fecundity etc. In rainbow trout,
quantitative trait regions associated with resistance to two viral diseases, infectious
pancreatic necrosis (IPN) and infectious hematopoietic necrosis (IHN), and one
Khoo et al., 2004). In addition, regions related to upper temperature tolerance,
spawning time, early development of embryos as well as dominant albino were reported
(Jackson et al., 1998; Danzmann et al., 1999; Sakamoto et al., 1999; Fishback et al.,
2000; Peny et al., 2001; Robison et al., 2001; Nakamura et al., 2001; Sommjai et al.,
2003). QTL for upper temperature toleranee in Arctic char, Iower temperature
tolerance in tilapia and cold tolerance in common carp were also mapped (Sommj ai et
al., 2003; Cnaani et al., 2003; Moen et al., 2004; Sun and Liang, 2004).
Japanese flounder is an economically important fish as a food and recently culture of
Japanese flounder has become popular in Asian countries such as Japan, Korea and
China. However, in these countries, the Japanese flounder aquaculture industry has
many problems sueh as disease (Muroga et al., 1996) and color abnormalities
(Venizelos and Benetti, 1 999). In this study, we investigated lymphocystis disease (LD)
because this disease is widely distributed over many countries and causes serious
damage to fish farms. LD is a vrral Infection due to lymphocystrs drsease vlrus (LDV)
belonging to the lridovirus family! It has spread worldwide, and has been rdentified m at
least 96 species ofteleosts belonging to 32 families and 6 orders (Nigrelli et al., 1965;
Lawler et al., 1 977). Japanese flounder affected with LD develop characteristically
hypertrophied cells called lymphocystis cells, on skin, fins and/or mouth. Affected fish
lose commercial value due to tumor-1ike nodules that have accumulated lymphocystis
cells. Lymphocystis cells on the mouth interfere with feeding, and sometimes lead to
starvation. The disease is thus costly to farmers. There are presently no medicines for
LD or eommercially available vaccines. The purpose of this study was to identify
LD-resistant locus that could aid in marker-assisted breeding of LD-resistant Japanese
2. Matenals and methods
2. 1. Japanese flounder family
An LD-resistant line (KP-B) and an LD-susceptible line (KP-A) have been reared at
Kanagawa Prefectural Fisheries Research Institute in Japan. Both lines were
phenotypically selected for four generations during the past ten years. A fish affected
with LD is shown in Fig. I . In 1998, a KP-B (LD-resistant) female was crossed with a
KP-A (LD-susceptible) male to produce an Fl hybrid family (KP-BA). A female of a
family KP-BA that was not infected with LDV was backcrossed to the susceptible sire
(KP-A) to generate a backcross family termed KP-BAA in 2000.
2. 2. LD-resistance test (Phenotypic measurements)
An LD-resistance test was performed using 1 3 6 progeny of the KP-BAA backcross
family Frsh were reared wrth UV treated water (4x I OOOO uW/cm2, uvl25, Hanovia)
until the infectivity trials because ordinary rearing water is contaminated with LDV.
This treatment completely protected the fish against LD. The LD-resistance test was
carried out fiom February to May in 2001, during which time the progeny of KP-BAA
were exposed to LDV-contaminated water. Fish were kept in a five-ton tank with
ruuning water. Water temperature was 14eC- 20'C during this experiment. We also
tested47progenyoftheFl hybridf㎞ily(KP−BA)ffomDecember1998to May1999
usingthe same method used fbrthe backcross fami1ユ The phenotypes were scored as either LD(+)(fishthat(1eveloped lymphocystis cells on skin,fins and/ormouth)or LD(一)(fishwithout ly卑phocystis cells on skin,fins ormouth)。TheKP−BAAbackcross飴milywas scoredinMay2001,andtheKP.BAF1
角milywas scoredinMay1999.
ユヱ盈ヒ70Sα∫ell舵αnαか5∫5 DNAwas extracted ftom bloo(1tissues ofthe backcross progeny Tissues weredigestedin100mMNaC1,20mMThs−HC1(pH8.0),100mMEDTA,withaHnal
concentration ofO5%SDS and100國ml ofprotease K,Afterprotein digestion,the aqueous phase was extracted twice withpheno1,twice withphenol/chlorofbrm/isoamyl alcoho1,and once with chlorofbrm.DNAwas precipitatedusing ethanoll pellets werewashedin70%ethanol,driedandresuspendedinTE(0.01MT冠s−HClpH7.4,25mM
EDTApH8.0)。 Fif取microsatellite markers were testedin a25μ1reactionvolume containing5pmol ofmlabele(1primer and O.17pmol ofend−labeled with[γ一33P】ArP using T4polynucleotidekinase,plus O.175mMofeachdNTP,20mMTris−HC1(pH8。4),50mM
KC1, I .5 mM MgC12, Io/ BSA, 0.25 U of Taq DNA polymerase and 50 ng template
DNA. A specific annealing temperature was used for each microsatellite marker. The
PCR program consisted of an initial denaturation at 95'C for 2 min, followed by 3 5
cycles consisting of I min at the annealing temperature, Imin at 72'C, 30s at 95'C, and
final extension of 3min at 72'C.
The amplification products were mixed with 20 pl of loading buffer (95"/o formamide,
1 O mM EDTA, 0.050/0 bromophenol blue and xylene cyanol), denatured for I O min at
95"C and quickly cooled on ice. Two microliters of each sanrple were loaded onto a 6010
polyacrylanride gel (1 9 : I ratio acrylamide: bisacrylamide). After electrophoresis, gels
were dried on a standard gel drier for 80 min and exposed to photo-imaging plates
overnight. The imaging plates were scanned with a Bio-image Analyzer (BAS I OOO, Fuj i
Photo Films, Japan).
2. 4. Genetic linkage analysis
First, we analyzed 42 individuals from the KP-BAA progeny (2 1 fish of LD (+)/ 2 1
fish of LD (-)) using 50 microsatellite markers. Those markers were selected from each
linkage group of the genetic linkage map of Japanese flounder (Coimbra et al., 2003).
The linkage map distances between the genotypes of KP-BAA progeny at each marker
10cus and phenotypic values for LD (+) and LD (-) were calculated using Map Manager
QT (Manly and Olson, 1 999). In the second step, the suggestive markers (P<0.001)
detected in the first step were typed in the KP-BAA population (n=1 3 6; 75 fish of LD
3. Results
3. 1. Phenotypic variation ofLD-resistance in Japanese flounder
In May 1999 and in May 2001, we confirmed that LD was present not only in the
tanks holding the F1 and Backcross progeny but also other tanks (data not shown). In
the KP-BA Fl hybrid family; 24 fish (51 .10/0) were LD (+) and 23 fish (48.90/0) were LD
(-). In the KP-BAA backcross family, 75 frsh (55.2o/o) were LD (+) and 61 fish (44.90/0)
were LD (-). The phenotypic variance in both F I and Backcross was approximately I : I .
3.2. Genetic linhage locusfor LD-resistance
Initially, 42 individuals ofthe KP-BAA family were analyzed at 44 Ioci spaced
throughout the Japanese flounder genomes. The results are shown in Table I . Among 5 O
microsatellite markers used, six markers were non-polymorphic regarding the maternal
(KP-B) specific bands. As a result, one highly significant locus associated with LD
resistance was detected (Fig. 2). The locus peak, designated as the lymphocystis disease
resistant locus (LD-R), was located close to the markers Poli.9-8TUF, Poli.9-35TUF,
and Poli. 121TUF on LG 1 5. This QTL explained 3 1'/* of the total phenotypic variation
in the 42 individuals screened (Table I ).
The linkage-group location of these loci was confirmed by screening 1 3 6
individuals fiom the KP-BAA fanrily. The locus peak, designated LD-R, was identified
by significant LOD scores for three markers: Poli.9-8TUF, Poli.9-35TUF and
Poli. 121 TUF (Table 2). The distance between Poli.9-8TUF and the LD-R Iocus was
14.7 CM as estimated from the KP-BAA backcross family's linkage map (Fig. 3). This
10cus explained 500/0 of the total phenotypic variation in the 1 36 individuals screened
(Table 2).
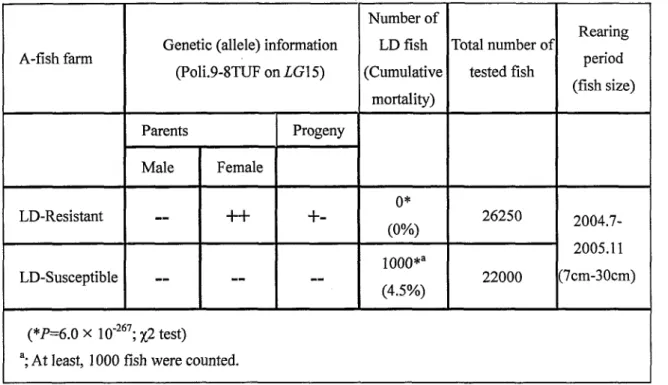
It is worth mentioning that when 42 fish were tested, the KP-B allele (showing a
147bp band for Poli9-8TUF) was inherited at the LD-R Iocus by 86.40/0 (1 9/22) ofthe
healthy (LD-) progeny, and by 300/0 (6/20) ofthe progeny affected with LD (LD+). Also,
when 1 36 fish were tested, the KP-B allele was inherited by 88.50/0 (54/61) of the
healthy (LD-) progeny and by 17.30/0 (13/75) of the progeny affected with LD (LD+)
(Table 3). The dam from KP-B that was used to produce the F I fanrily and the dam
from KP-BA that was used to make a backcross were heterozygous at the LD-R Iocus
4. Discussion
Our results imply that the LD-resistance is inherited as a dominant trait that follows
Mendelian inheritance. In the Fl experiment, the number of LD (+) and LD (-) fish were
5 1 . 1 /, and 48.90/0, respectively, and in the Backcross experirnent, the numbers were
55.20/, and 44.90/0, respectively. The phenotypic variance in both F I and Backcross was
about I : I . The value of I : I is reasonable because both of the dams used in these
experiments were heterozygous at the LD-resistant locus. The inherited allele from the
LD-resistant KP-B fantily exhibited a dominant effect in the KP-BAA backcross
progeny on LD-resistance as a heterozygote (Fig.2).
We identified one significant locus that was associated with LD-resistance in
Japanese flounder. The meehanism underlying resistance can fiequently be explained by
the presence or absence of certain molecules in the host which are critical for infection,
recognition or elimination of the pathogen. A typical example is the association between
the maj or h-istocompatibility eomplex (MHC) and disease resistance. Thus, in the case
of chickens, MHC haplotypes B21 and B 1 9 affect susceptibility to Marek's disease
virus (Hepkema et al., 1 993). In Japanese flounder, a microsatellite marker designed by
MHC class I eluster gene sequences was found to be unlinked to LG 1 5 (data not shown).
However, other MHC class genes are not mapped on this linkage map, and the next step
will be to determine the loeations of other MHC class genes as clarifying differences in
MHC haplotypes may explain LD-resistance. Within fish, NK (natural killer)-1ike cells
are referred to as nonspecific cyiotoxic cells (NCC) and are presumed to protect against
viruses and tumor growih (Jaso-Friedmann et al., 2001). However, the locus associated
with NK-1ike activity is unlinked to MHC class I and 11 in rainbow trout (Zimmerman et
al., 2004). In Japanese flounder, some other immune response-related genes were
isolated by expressed sequenced tags (EST) (Nam et al., 2003). Further study to
investigate possible relationships between these immune related genes and LD-R are
needed. Identification offunctional genes by positional cloning is a final goal of our
study because the isolated genes can be used for marker-assisted breeding, i.e., for
gene-assisted selection. However, the genetic distance between the LD-R Iocus and the
nearest DNA marker is not close enough yet for positional cloning.
Mierosa_tellite markers offer many advantages; they show high levels of allelic
variance and co-dominanee which facilitates genome mapping of domesticated species.
In previous studies, we have mapped 236 microsatellite loci for Japanese flounder.
Completion of a high-density linkage map of Japanese flounder will be required before
Acknowledgement
This study was supported by grants-in-Aid for Scientific Research from the Ministry of
Education, Science, Sports and Culture of Japan (N0.15380134), and from the Japanese
Fisheries Agency.
Refヒ}rences Andersson,L.,Haley,C.S.,Ellegren,H.,Knott,S.A.,Johansson,M.,Andersson,K., Andersson−Eklund,L.,Edfbrs−LiUa,1.,Fredho㎞,M,Hansson,1。,Hakansson,J., Lundstrom,K,1994.Genetic mappingofquantitative traitloci fbr growth and 飴tness in pigs.Science263,1771−1774. Cnaani,A.,Halleman,E.M.,R.on,M.,W611er,J.1.,Indelman,M.,Kashi,Y,Gal1, GA.E.,Hulata,G,2003,Detectionofachromosomal regionwithtwo quantitative trait loci,a』f驚cting coldtolerance an(1fish size,in an F2tilapiahybrid.Aquaculture 223,117−128. Coimbra,MR.M.,Kobayash1,K,Koretsugu,S.,Hasegawα,0.,Ohara,E.,Ozaki,A.,
Sakamoto,T,Naruse,K,Okamoto,N。,2003.AgeneticlinkagemapoftheJapanese
flound?ちPσ7σliσh‘勿s ol’vσoεμs,Aquaculture220,203−218. CoIlins,ES。,1992.Positional cloningl Let’s not ca11itreverse anymore.Nat。Genet。1, 3.6』 Danzmann,R.G,J貧ckson,TRラFerguson,M.M.,1999,Epistasis inallelic expressionat upPertemper3ture tolerance QTL in rainbowtrout。Aguaculture173,45−58. Elouafi,1.,Nachit,M.M.,Martin,L.M.,2001.IdentiHcationofamicrosatelliteon clu℃mosome7B showing a strong linkage withye110wpigment in du㎜wheat(Z卜’がoz‘〃z∫μ㎎i4z卿z L。vaL durum),Hereditas135,255−261。 Fishback,A.G.,Danzmam,R.G.,Ferguson.M.M.,2000.Microsatellite allelic heterogeneity among hatcheryrainbowtroutmaturing in diffbrent seasons.J.Fish Biol.57,1367−1380. Georges,M.,Nielsen,D.,Mackimon,M.,Mishr嬬A。,Okimoto,R.,Pasquino,A.T, Sargean重,L.S.,Sorensen,A。,S重eele,M。R.,Zhao,X.,Wbmack,」.E。,Hoeschele,1., 1995.Mappingquantitativetraitlocicontrollingmilkproductionindairy cattleby exploiting Progeny testing。Genetics139,907−920. Gilbey,」、,Vbrspoor,E。,McLay,A.,Houlihan,D.,2004.Amicrosatellitelihkagemap fbrAtlantic salmon(Sα11no sα1α7).Anim.Genet.35,98−105. Hepkema,B,G,,Blankert,JJ,,Albers,GA.,Tilanus,M。G,Egberts,E vanderZ轄pp AJ, Heやsen・E」・・1993・MapPing・fsusceptibili取t・M飢ek’sdiseasewithinthem勾・r histgcompatibiIity(B)complex byrefinedtyping ofWhite Leghom chickens。Anim。 Genet.24,283_287. Jackson,T.R。,Ferguson,M.M。,Danzmann,R.G.,Fishback,A.G。,Ihssen,PE., O’comell,M.,Crease,TJ,,1998.Identificationoflwo QTLinfluencingupPer temperature tolerance inthreerainbowtrout(Onoo7勿n6hπs剛窺ss)half」sib㎞ilies.
Heredity80,143−15L
51Jaso−Friedmann,L.,Lea琳J.H.3「d.,Evans,D.L。,2001.The non−specific cytotoxic celI receptor(NCCRP−1):molecular orga1丘zation and.signaling Properties.Dev。Comp、 1㎜uno1.25,701−711. Khoo,S.K.,Ozaki,A.,Nakamura,F.,Arakawa,℃,Ishimoto,S.,Nickolov,R., Sakamoto,T。,Akutsu,T。,Mochizuki,M.,Denda,1.,Okamoto,N.,2004. Identi負cation ofa novel chromosomal region associated v頭th in免ctious hematopoietic necrosis(IHN)resistance inrainbowtrout Onoo7勿noh祝s n穿短ss.Fish Patho1.39,95−101. Kocher,TD。,Lee,WJ,,Sobolewska,H.,Pe皿1an,D。,McAndrew,B.,1998。Agenetic linkage map ofa cichlid fish,thetilapia(07θoch701η’s n’lo∫∫oμ5).Genetics148, 1225−1232. KwonうYS.,Eun,M.Y,So㎞,J.K.,2001.Marke卜assisted selectionfbridentificationof plantヤegenerationabilityofseed−derivedcalli indce(01フzα5α∫1vαL.).Mol.Cells12, 103−106. Lawler,A.R.,Ogle,」.℃,Donnes,C.,1977。Z)αsのノllμs spp.:new hosts fbr lymphocystis, and a list ofrecent hosts.J.WildL Dis.13,307−312. Lee,B.Y,Lee,WJ.,Streelman,」.T。,Carleton,K。L。,Howe,A.E.,Hulata,G,Sle廿an,A., Stem,J.E.,Terai,Y,Kocher,T。D.,2005.Asecon(1−generation genetic linkage map of
tilapia(0紹ooh701n∫s spp。)。Genetics170,237−244. Li,Y,Byme,K.,Miggi&no,E.,Whan,V,Moore,S.,Keys,S.,Crocos,P、,Preton,N., Le㎞ert,S。,2003.Genetic mapping ofthe KurumaprawnPθnαθ㍑s∫ゆoni6鉱s using
AFLPmarkers.Aquaculture219,143−156.
Liu,Z.,Karsi,A。,Li,R,Cao,D。,Dunham,R.,2003.AnAFLP−base(1genetic linkage map of c}1annel catfish(ノと孟oh’7z’sρπn6孟o’z’s)cons伽cted by using an interspeciflc hybrid resource㎞ily。Genetics165,687−694. Man1ヱK.E,01son,」.M.,1999,0verviewofQTLmapPingsoftwareandintroductiontoMapManagerQTMa㎜.Genomelo,327−334.
McComell,S.K.」.,Beynon,C。,Leamon,J.,Skibinski,D.O.E,2000.Microsate11ite inarkerbased genetic linkage maps ofO紹ooh70枷sα脚επs and O n∫lo孟’oμs (Cichlidae):extensive linkage group segmenthomologies reveale(1.Anim.Genet,31, 214−218. Moen,T.,Agresti,」.J.,Cnaani,A.,Moses,H.,Famula,T.R.,Hulata,G,Ga11,GA.E., May,B。,2004.Agenome scanofafbur−waytilapiacross supportstheexistenceofa quantitative tra』it locus fbr cold tolerance on linkage group23.Aquaculture Res.35, 893−904. Moen,T,,Hoyheim,G,Munck,H。,Gomes−Raya,L,2004.AIink我gemapofAtlantic 53salmon(Sα1襯o sα1α7)reveals anuncommonly large diffbrence inrecombinationrate between the sexes.ADim.Genet.35,81−92. Moore,S.S.,Whan,V,Davis,GP,,Byme,K.,Hetzel,DJ.S.,Preston,N.,1999.The development and applic&tionofgeneticmarkers fbrthe KummaprawnPθnαθ㍑s ブ卿on∫oπs.Aquacu1傭e173,19−32. Muroga,K.,Egusa,S.,1996.Introductionto FishDiseases.Koseish&一Koseikaku,Tokyo,