中濃病院内科入院中の肺癌患者,
68
歳,男性,体重78.2 kg,
血清クレアチニン値(Scr)
0.6 mg ! dL
は,肺癌(右)の手術施 行 後,痰 よ りmethicillin-resistant Staphylococcus aureus
(MRSA)が検出され,発熱,C-reactive protein(CRP)上昇に より
MRSA
肺炎(左)と診断された。vancomycin(VCM)は,前田らによるノモグラム1)より
1
回1 g,12
時間ごとの投与 が開始となった。投与開始後4
日目に血清中VCM
濃度を測定 したところ,トラフ値4.4 µ g ! mL,ピーク値 12.8 µ g ! mL
と目 標濃度2〜5)より低値を示した。目標濃度(トラフ値5〜15 µ g !
mL,ピーク値 20〜40 µ g ! mL)となるように投与設計を行い
1
回1 g, 8
時間ごとの投与方法に変更した。そして,4
日後に 血清中VCM
濃度を測定したところ,トラフ値8.5 µ g ! mL,
ピーク値
20.2 µ g ! mL
と目標濃度域に入れることができた。このように本症例は,腎機能が正常にもかかわらず,初回に通 常投与量の
VCM
を投与したところ,目標濃度域より実測血清 中VCM
濃度がかなり低かった症例であった。本症例の原疾患 に肺癌があることから,癌または悪性腫瘍疾患のある患者群 で,VCMの薬物動態パラメータが変動するとの仮説を立てて,臨床症例を
retrospective
に解析した。I. 対
象対象患者は,
1998
年5
月〜2001年8
月まで,中濃病院 に 入 院 中 のMRSA
感 染 症 患 者 の う ちScr
が0.6 mg ! dL
以下の患者は52
例であった。そのうち,合併症に悪性腫 瘍疾患がある担癌患者群は25
例,一方,合併症に腫瘍疾 患がない非担癌患者群は27
例であった。II. 方
法1.投与法および採血法
VCM
は生食100 mL
に溶解し,1時間かけて点滴静注した。血清中
VCM
濃度測定のための採血は,定常状態に 到達したと考えられる4
日目以降のトラフと点滴終了2
時間後(ピーク)に行った。なお,測定は当院検査科にて,採血後ただちに遠心分 離された蛍光偏光免疫測定法(FPIA法)により測定した。
2.Bayesian
法6)による投与設計1) 薬物動態パラメータの推定
実測された血清中濃度トラフ値とピーク値の
2
点から【原著・臨床】
悪性腫瘍患者におけるバンコマイシンの薬物動態パラメータの変動
―ベイジアン法による解析―
寺町ひとみ1)・松下 良2)・辻 彰2)
1)
JA
岐阜厚生連西美濃厚生病院薬剤科*(前JA
岐阜厚生連中濃病院薬剤科)2)金沢大学大学院自然科学研究科薬学系
(平成
16
年10
月15
日受付・平成17
年4
月14
日受理)Vancomycin(VCM)を methicillin-resistant Staphylococcus aureus(MRSA)感染症患者(腎機能は
正常)に,通常投与量を点滴静注投与したところ,治療濃度域より実測血清中VCM
濃度がかなり低い症 例を経験した。本症例の原疾患に肺癌があることから,癌または悪性腫瘍疾患のある患者群で,VCM の薬物動態パラメータの変動を,臨床症例52
例(血清クレアチニン値が0.6 mg ! dL
以下)について解析 した。非担癌患者群は
27
例,担癌患者群は25
例で比較検討した。解析は2-compartment model
を用い,Bay-
esian
法で薬物動態パラメータを推定した。Bayesian法による投与設計後の非担癌患者群の実測トラフ値とピーク値の平均血清中
VCM
濃度は,10.53±3.01µ g ! mL,24.18±0.11 µ g ! mL,担癌患者群 10.96±
4.07 µ g ! mL,25.51±1.92 µ g ! mL
ともに両群に有意差はなかった。しかし,VCM投与量は,非担癌患者 群が26.40±11.22 mg ! kg ! day,担癌患者群が,34.86±13.09 mg ! kg ! day
と,担癌患者群のほうが多かっ た。推定した薬物動態パラメータは,VCMの全身クリアランス(CL)および,分布容積(Vdss)は,非 担癌患者群0.056±0.018
(L! hr ! kg)
,1.05±0.34(L! kg)
,担癌患者群0.077±0.029
(L! hr ! kg)
,1.29±0.41(L
! kg)とともに担癌患者群のほうが大きい値を示していた。予測性も良好な値を示した。
Bayesian
法による解析の結果,担癌患者群においてVCM
のCL, Vdss
が有意に非担癌患者群より大きい値を示した。同じ血清中濃度を担癌患者群が実現するためには,投与量の増量が示唆された。
Key words: vancomycin,malignancy,pharmacokinetic parameter,Bayesian method
*岐阜県養老郡養老町押越
986
Table 1. Comparison of demographic data and measured trough and peak serum vancomycin concentrations in the non-malignancy and malignancy groups
t-test Malignancy group
Non-malignancy group
N.S.
25 27
No. of patients
N.S.
13 : 12 14 : 13
Male : Female
N.S.
63.4 ± 9.7 69.3 ± 14.5
*Age(years)
N.S.
49.6 ± 16.7 50.3 ± 10.7
Weight(kg)
N.S.
0.4 ± 0.1 0.5 ± 0.1
Scr(mg/dL)
N.S.
2.5 ± 0.4 2.5 ± 0.6
Alb(g/dL)
N.S.
10.96 ± 4.07 10.53 ± 3.01
Trough concentration(μ g/mL)
N.S.
25.51 ± 1.92 24.18 ± 0.11
Peak concentration(μ g/mL)
*
Mean ± S.D., N.S.: not significant, Scr: serum creatinine, Alb: serum albumin.
血清中濃度変化を表すモデル式は
2-compartment model
を用い,おのおのの患者の薬物動態パラメータを推定し,非担癌患者群,担癌患者群で比較検討した。プログラム は「VCM-TDM Ver. 2」7)を使用した。なお,母集団パラメー タは
Yasuhara
らの報告値8)を用いた。なお,クレアチニ ンクリアランス(CLcr)はScr
をもとにCockcroft-Gault
の推定式9)を用いて算出した。2) 投与設計法の手順
初回,医師の経験によって決められ,VCM 500〜1,500
mg
を1
時間かけて点滴静注し,12〜48時間ごとの投与 で開始した。原則として,4
日目以降の投与直前値および 投与終了2
時間後に血清中VCM
濃度を測定し,2
点の測 定値を用いたBayesian
法により推定した薬物動態パラ メータに基づき,トラフ値が5〜15 µ g ! mL,最高血中濃
度が60 µ g ! mL(ピーク値は 20〜40 µ g ! mL)
2〜5)となるよ うに投与設計を行った。3) 予測性の検討
投与設計後,再度
4
日目以降の血清中VCM
濃度を測 定し,非担癌患者群,担癌患者群について実測値とBay-
esian
法により推定した予測値と比較し予測性の検討をした。血清中濃度の予測性の評価は,予測の偏りの指標 として,トラフ値とピーク値における予測値と実測値の 差の平均値を比較する,mean prediction error(ME:偏 り)を,予測精度の指標として,
mean absolute prediction error
(MAE:正確さ),root mean squared error
(RMSE:精度)を算出して行った。これらの算出方法10)を次に示 す。
ME=1 ! n Σ
ni=1(予測値−実測値)
MAE=1 ! n Σ
ni=1(|予測値−実測値|)2
RMSE=
〔1! n Σ
ni=1(予測値−実測値)2〕1!2
なお,統計処理は,
Student s t-test
を用い危険率5% 以
下を有意差ありとした。III. 結
果1.非担癌患者群,
担癌患者群における基礎データの比較非担癌患者群,担癌患者群における基礎データの比較 を
Table 1
に示した。非担癌患者群は27
例,性別(男性:女 性
14:13)
,年 齢69.3±14.5(mean±S.D.)歳,体 重 50.3±10.7 kg,Scr 0.5±0.1 mg ! dL,血 清 ア ル ブ ミ ン 値
(Alb)
2.5±0.6 g ! dL,担癌患者群は 25
例(脳腫瘍10
例,悪性リンパ腫
5
例,肺癌4
例,乳癌3
例,膀胱癌2
例,肝 癌1
例), 性別(男性:女性13:12)
, 年齢63.4±9.7
歳,体重
49.6±16.7 kg,Scr 0.4±0.1 mg ! dL,Alb 2.5±0.4 g ! dL
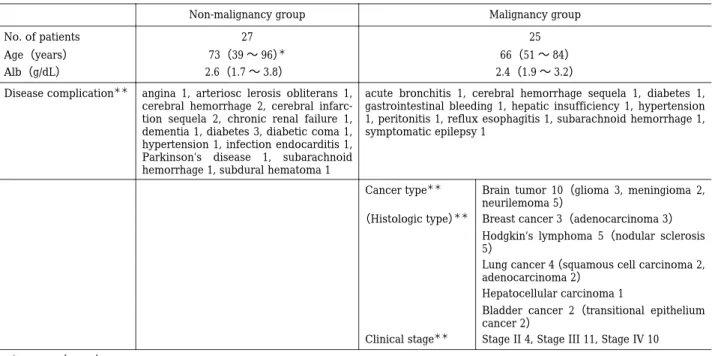
である。両群において性差,年齢,体重,Scr,Alb において有意差はなかった。また,Table 2
に癌種,組織 型,病期分類,合併症などの背景因子について示した。各群における症例数が少なく,癌種などと投与量の関係 を検討することは難しいと思われる。
2.投与設計後の実測血清 VCM
中濃度と投与量の比較
投与設計後の
2
群における実測トラフ値の平均血清中VCM
濃度は,非担癌患者群が10.53±3.01 µ g ! mL,担癌
患者群が10.96±4.07 µ g ! mL,同様に実測ピーク値は,
非 担 癌 患 者 群 が
24.18±0.11 µ g ! mL,担 癌 患 者 群 が 25.51±1.92 µ g ! mL
と,ともに両群に有意差はなかった(Table 1)。
しかし,VCM投与量は,非担癌患者群が
26.40±11.22 mg ! kg ! day,担癌患者群が, 34.86±13.09 mg ! kg ! day
と,担癌患者群のほうが有意に投与量が多かった(p<0.05)
(Fig. 1)。
3.薬物動態パラメータの比較
非担癌患者群,担癌患者群における推定した薬物動態 パラメータを
Table 3
に示した。VCMのクリアランス(CL)が非担癌患者群
0.056±0.018
(L! hr ! kg)
,担癌患者 群0.077±0.029
(L! hr ! kg)と,担癌患者群のほうが約 1.4
倍大きい値を示していた(p<0.01)。また,分布容 積(Vdss)は,非担癌患者群が
1.05±0.34
(L! kg)
,担癌患者 群が1.29±0.41
(L! kg)と,有意に担癌患者群のほうが大
きかった(p<0.05)。 半減期は両群で有意差がなかった。また,非担癌患者群と担癌患者群における
VCM
のCL
とCLcr
の相関について検討した。回帰式および相関係 数は,非担癌患者群が,y=0.4218x+8.4625(r2=0.5183)Table 2. Comparison of background factor in the non-malignancy and malignancy groups Malignancy group Non-malignancy group
25 27
No. of patients
66(51 〜 84)
73(39 〜 96)
*Age(years)
2.4(1.9 〜 3.2)
2.6(1.7 〜 3.8)
Alb(g/dL)
acute bronchitis 1, cerebral hemorrhage sequela 1, diabetes 1, gastrointestinal bleeding 1, hepatic insufficiency 1, hypertension 1, peritonitis 1, reflux esophagitis 1, subarachnoid hemorrhage 1, symptomatic epilepsy 1
angina 1, arteriosc lerosis obliterans 1, cerebral hemorrhage 2, cerebral infarc- tion sequela 2, chronic renal failure 1, dementia 1, diabetes 3, diabetic coma 1, hypertension 1, infection endocarditis 1, Parkinson’s disease 1, subarachnoid hemorrhage 1, subdural hematoma 1 Disease complication
**Brain tumor 10(glioma 3, meningioma 2, neurilemoma 5)
Cancer type
**Breast cancer 3(adenocarcinoma 3)
(Histologic type)
**Hodgkin’s lymphoma 5(nodular sclerosis 5)
Lung cancer 4 (squamous cell carcinoma 2, adenocarcinoma 2)
Hepatocellular carcinoma 1
Bladder cancer 2(transitional epithelium cancer 2)
Stage II 4, Stage III 11, Stage IV 10 Clinical stage
***
Median(range)
**
Each number next to disease name means the number of patients relevant to the disease.
0 10 20 30 40 50 60
VCM daily dosage regimens ( mg/kg/day )
Non-malignancy group Malignancy group 26.40±11.22
mg/kg/day
34.86±13.09 mg/kg/day
*
で担癌患者群が,y=0.456x+8.4865(r2=0.5221)と,よ く相関していた。
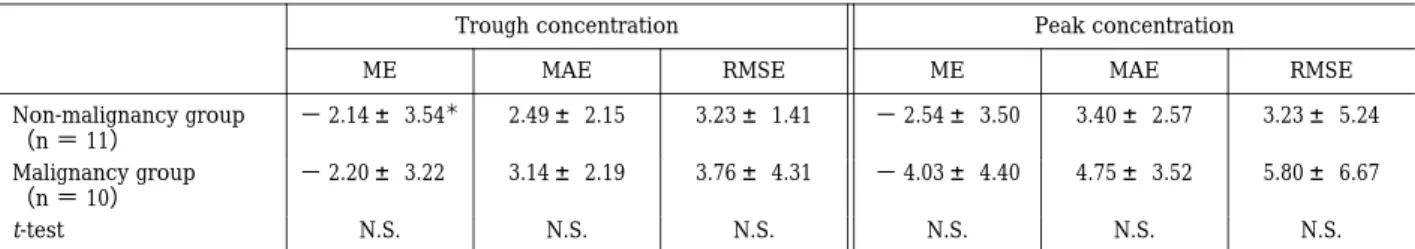
4.Bayesian
法による血清中濃度の予測性トラフ値およびピーク値において両群の
ME
(偏り),MAE(正確さ)
,RMSE(精度)をTable 4
に示した。そ れぞれについて両群間で有意差はなかった。5.癌種別による投与量,CL,Vdss
についての比較検討
担癌患者群の内訳は,脳腫瘍
10
例,悪性リンパ腫5
例,肺癌4
例,乳癌3
例,膀胱癌2
例,肝癌1
例であった。癌種別による投与量,
CL,Vdss
についてのおのおのの比較検討を
Figs. 2〜4
に示した。症例数は少ないが,乳癌,悪性リンパ腫では,投与量,
CL, Vdss
ともに,有意に高 い値を示していた。IV. 考
察Bayesian
法による解析の結果,非担癌患者群におけるVCM
のCL
は,0.056±0.018 L ! hr ! kg,担癌患者群におけ
るそれは0.077±0.029 L ! hr ! kg
と有意に担癌患者群のほ うが大きい値を示した。さらに,Vdss
もそれぞれ1.05±
0.34 L ! kg, 1.29±0.41 L ! kg
と有意に担癌患者群のほうが 大きい値を示した。その結果,投与量が非担癌患者群で26.40±11.22 mg ! kg ! day,担 癌 患 者 群 で 34.86±13.09 mg ! kg ! day
と担癌患者群のほうが増大したと考えられ る。これより非担癌患者群と同じ血清中濃度を担癌患者 群が実現するためには,投与量が担癌患者群のほうが約1.3
倍必要であることがわかった。この事実に関しては,すでに
Fernandez
11),Chang12,13)らが報告している。Fer-nandez
11)は,成人の造血器腫瘍患者が目標血清VCM
濃度 を達成するためには,VCM
の1
日投与量は非担癌患者よ り1.8
倍必要であると報告している。同様に,Chang
12,13)ら も,臨床例をBayesian
法で解析した結果,乳幼児の悪性 腫瘍患児では,通常用量40 mg ! kg ! day
のところ,75±22 mg ! kg ! day
と投与量を増やさなければならず,投与量を 調節しないとVCM
が悪性腫瘍患児では効きにくいとの 臨床例を報告している。さらに,Fernandez
11),Chang12,13)らともに,担癌患者と非担癌患者における
VCM
の薬物 動態パラメータを比較すると,Vdss,半減期には有意な 差はみられないが,CL
は,造血器腫瘍患者のほうが,有Data are expressed as mean±S.D. (bars) .
*
P <0.05 significantly different compared with non malig- nancy group(Student s t-test) .
Fig . 1. Comparison of vancomycin daily dosage require-
ments to attain desired serum vancomycin concentra-
tions between the non-malignancy and the malignancy
groups.
Table 3. Comparison of vancomycin pharmacokinetic parameters in the non-malignancy and malignancy groups
t-test Malignancy group
(n = 25)
Non-malignancy group
(n = 27)
Pharmacokinetic parameters
p < 0.01 0.077 ± 0.029
0.056 ± 0.018
*CL(L/hr/kg)
p < 0.05 1.29 ± 0.41
1.05 ± 0.34 Vdss(L/kg)
N.S.
14.86 ± 3.96 16.73 ± 6.97
t1/2(hr)
*
Mean ± S.D., N.S.: not significant, CL: clearance, Vdss: volume of distribution at the steady state.
Table 4. Predictive performance of the Bayesian program in predicting the final sets of trough and peak vancomycin concentrations Peak concentration
Trough concentration
RMSE MAE
ME RMSE
MAE ME
3.23 ± 5.24 3.40 ± 2.57
− 2.54 ± 3.50 3.23 ± 1.41
2.49 ± 2.15
− 2.14 ± 3.54
*Non-malignancy group
(n = 11)
5.80 ± 6.67 4.75 ± 3.52
− 4.03 ± 4.40 3.76 ± 4.31
3.14 ± 2.19
− 2.20 ± 3.22 Malignancy group
(n = 10)
N.S.
N.S.
N.S.
N.S.
N.S.
N.S.
t-test
*
Mean ± S.D., ME: mean prediction error (a measure of bias) , MAE: mean absolute prediction error (a measure of accuracy) , RMSE:
root mean squared prediction error(a measure of precision) , N.S.: not significant. Measured and predicted vancomycin concentrations were compared with a paired Student’s t-test to determine whether ME was significantly different from zero.
0 10 20 30 40 50 60 70
dosage ( mg/kg/day )
Non-malignancy group
Malignancy group
Brain tumor
Hodgkin’s lymphoma
Lung cancer
Hepatocellular carcinoma
Bladder cancer 34.86±13.09
mg/kg/day 26.40±11.22
mg/kg/day
Breast cancer
**
*
*
意に大きな値を示したことから,担癌患者で
VCM
のCL
が亢進することを示唆している。このような例は諸外国 ではいくつか報告されており14,15),性別や年齢に関係な く担癌患者では非担癌患者に比べてVCM
のCL
の上昇 と半減期が短くなるという傾向が報告されている。同様な事例が臨床で発生した場合,
VCM
が奏効せずに,比較 的低用量で漫然と投与される危険性が考えられるため,本現象が日本人でもみられるか今回遡及的に検討した。
その結果,同様の現象が日本人でも認められることが新 たに確認された。
Fig. 2. Relationship between dosage and different kinds of malignancy.
Mean±S.D.
*
P <0.05 and
**P <0.01 significantly different compared with non-malignancy group(Student s t-test) .
0 0.02 0.04 0.06 0.08 0.1 0.12 0.14
Clearance ( L/hr/kg )
Malignancy group
Brain tumor
Breast cancer
Hodgkin’s lymphoma
Lung cancer
Hepatocellular carcinoma
Bladder cancer Non-malignancy
group 0.056±0.018
L/hr/kg
0.077±0.029 L/hr/kg
**
**
*
0 0.5 1 1.5 2 2.5
Volume of distribution at the steady state ( L/kg )
Non-malignancy group
Malignancy group
Brain tumor
Breast cancer
Hodgkin’s lymphoma
Lung cancer
Hepatocellular carcinoma
Bladder cancer 1.050±0.340
L/kg
1.294±0.411 L/kg
*
**
**
Fig. 3. Relationship between vancomycin clearance and different kinds of malignancy.
Fig. 4. Relationship between vancomycin volume of distribution at the steady state and different kinds of malignancy.
Mean±S.D.
*
P <0.05 and
**P <0.01 significantly different compared with non-malignancy group(Student s t-test) .
Mean±S.D.
*
P<0.05 and
**P <0.01 significantly different compared with non-malignancy group(Student s t-test) .
悪性腫瘍のように低蛋白血症を来す可能性のある疾患 では,低蛋白血症が薬物の体内動態に影響を与える可能 性があると考えられる。また,多くの薬物は血液中で
Alb
をはじめとする血漿蛋白と結合するので,その動態はAlb
などその薬剤のキャリアーの量によって影響を受け ることが考えられる。今回対象とした患者群においても,血清
Alb
値(中央値)は,Table 2からそれぞれ,非担癌 患者群は2.6 g ! dL,担癌患者群は 2.4 g ! dL
と低アルブミ ン血症の傾向がみられた。しかし,非担癌患者群と担癌 患者群で,血清Alb
値に有意差はみられなかった。さら に,Sunらは16),VCMの主たる血清中での結合蛋白はAlb
であり,その血清蛋白結合率は30% 程度と低いと報
告している。したがって,今回みられた,担癌患者群で のVCM
の血清中薬物濃度の低下とクリアランスの上昇 の原因として,低蛋白血症に由来するVCM
の蛋白結合 率の変化の影響は少ないと考えられる。また,非担癌患 者 群 で も 血 清Alb
濃 度 が 低 い 傾 向 が み ら れ た。渡 辺 は17),何らかの原因で血清Alb
値が3.0 g ! dL
以下となる とMRSA
が起炎性(顕在化)をもつ場合があると報告し ていることから,MRSA肺炎患者の血清Alb
濃度が低い 傾向を示した可能性も考えられる。Table 4
の結果より,Bayesian法による投与設計は良 好に行われており,かつ,非担癌患者群と担癌患者群と で差はみられていない。したがってVCM
の体内動態パ ラメータのこれら群間での差が,予測法の誤差であると は考えにくい。また,過去の報告においては癌の種類ごとの検討は まったく行われていなかったことから,今回癌の種類と の関係を比較検討した。その結果,癌の種類などとの関 係は,乳癌,悪性リンパ腫では,投与量,
CL,Vdss
とも に,有意に高い値を示したが,例数が少なくはっきりし なかった。一方,そのメカニズムも過去の論文では特に記述がな く,まったくわかっていない。排泄臓器以外の部位が癌 であることで,腎排泄型の薬物である
VCM
の全身クリ アランスが上昇していることから,腎外クリアランスの 上昇も考えられるが,癌患者での腎外クリアランスの変 動をみた報告18)では,VCMの腎外クリアランスの寄与が 低いことが報告されていることから考えると,機序の一 つとは取り上げにくいと思われる。薬物の
CL
が上昇するという現象は,肝代謝される薬 物代謝酵素の誘導や薬物間相互作用について報告がなさ れているが,腎臓が関与する場合は,糖尿病の初期に糸 球体ろ過速度が亢進することが知られている程度であ る。VCM
が病態によっては,効きにくくなるという現象 を解明することで,VCM
については,特定の疾病で,ど の程度血清中濃度が低下するということが予測できるこ とになり,VCM
の不適切な使用を制限することができ,漫然とした
VCM
の投与により発生する,VCM耐性菌の発生を回避することが期待できる。さらに,
VCM
は,主 に尿中へ未変化体として排泄され,血漿蛋白結合率も低 いことが知られていることから,影響を受けていないよ うに思われている腎臓の薬物排泄機構に間接的に影響を 与えているかもしれない。今後,症例の蓄積および動物 モデルの開発などにより機序の解明が期待される。文 献
1) 前田頼伸,小西敏夫,西園寺真二,他:バンコマイシ
ンの 初 期 投 与 方 法 の 検 討。病 院 薬 学25: 517〜524, 1999
2) 五十嵐正博,中谷龍王,林
昌洋,他:Therapeuticdrug monitoring
(TDM)によるvancomycin
の適正投 与法。日化療会誌48: 545〜552, 2000
3) Winter M E: Vancomycin. In Basic Clinical Pharma- cokinetics, p. 474〜499, Applied Therapeutics , Van- couver, WA, 1994
4) Cantu T G, Yamanaka-Yuen N A, Lietman P S: Serum vancomycin concentrations: Reappraisal of their clini- cal value. Clinical Infections Diseases 18: 533〜543, 1994
5) 森田邦彦,谷川原祐介:MRSA
感染症治療に用いられる抗生物質の
TDM―そのピーク値とトラフ値の意
義―。化学療法の領域17: 241〜247, 2001
6) Kelman A W, Whiting B, Bryson S M: OPT: A package of computer programs for parameter optimisation in clinical pharmacokinetics . Br J Clin Pharmacl 14 : 247〜256, 1982
7) 矢野義孝,尾熊隆嘉:Visual Basic
によるベイジアン法に基づく
TDM
支援のための体内動態解析ソフト ウェアの開発。TDM研究14: 179〜188, 1997 8) Yasuhara M, Iga T, Zenda H, et al: Population pharma-
cokinetics of vancomycin in japanese adult patients.
Ther Drug Monit 20: 139〜148, 1998
9) Cockcroft D W, Gault M H: Prediction of creatinine clearance from serum creatinine. Nephron 16: 31〜41, 1976
10) Sheiner L B, Beal S L: Some suggestions for measur- ing predictive performance. J Pharmacokinet Bio- pharm 9: 503〜512, 1981
11) Fernandez G M M, Fruns I, Hernandez J M, et al: Van- comycin pharmacokinetics and dosage requirements in hematologic malignancies . Clin Pharm 12 : 515〜
520, 1993
12) Chang D , Liem L , Malogolowkin M : A prospective study of vancomycin pharmacokinetics and dosage requirements in pediatric cancer patients. Prediatr In- fect Dis J 13: 969〜974, 1994
13) Chang D: Influence of malignancy on the pharmacoki- netics of vancomycin in infants and children. Prediatr Infect Dis J 14: 667〜673, 1995
14) Krivoy N, Peleg S, Postovsky S, et al: Pharmacokinetic analysis of vancomycin in stedy state in pediatric can- cer patients. Pediatr Hemat and Oncol 15: 333〜338, 1998
15) Normand Y L, Milpied N, Kergueris M F, et al: Phar- macokinetic parameters of vancomycin for therapeu- tic regimens in neutropenic adult patients . Int J of Bio-Medical Comput 36: 121〜125, 1994
16) Sun H, Maderazo E U, Krusell A R : Serum protein-
binding characteristics of vancomycin . Antimicrob Agents Chemother 37: 1132〜1136, 1993
17) 渡辺
彰:化学療法の面から見たMRSA
感染症対策と 成 果―喀 痰 分 離
MRSA
の 起 炎 性 判 断 と 治 癒 適応―。化学療法の領域
9: 1465〜1472, 1993
18) Aldaz A, Ortega A, Idoati A, et al: Effect of hepatic function on vancomycin pharmacokinetics in patients with cancer. Ther Drug Monit 22: 250〜257, 2000
Influence of malignancy on the pharmacokinetics of vancomycin hydrochloride in Japanese MRSA patients after dosage adjustment with the Bayesian method
Hitomi Teramachi
1), Ryo Matsushita
2)and Akira Tsuji
2)1)
Department of Pharmacy, Nishimino Kouse Hospital, 986 Oshikoshi, Yoro-cho, Yoro-gun, Gifu, Japan
2)