APPLICATION OF HIGH PERFORMANCE ALLOY WITH SELF DIAGNOSIS TO ARCHITECTURE
__________________________________________________________________________________________________________
YOSHIO KANEKO*1, KAZUKI KIRIKOSHI*2, KOJI ONISHI*3, TAKAO SUZUKI*4, NORIYUKI MIYAMOTO*5 AND SUNARYO SUMITRO*6
ABSTRACT:
The objective of this paper is to examine experimentally an applicability of the health monitoring system employing TRIP (TRansformation Induced Plasticity) steels. The application of TRIP steels in order to assess structural performance degradation was evaluated by material tests. The magnetic characteristics of TRIP steels under tensile and compressive uniaxial loading were examined with the measurement of induced voltage.
The stress-strain hysteresis and the associated magnetic alternation of TRIP steels were identified. Further more, plate-bending tests and beam-bending tests were carried out in order to study the damage-detection characteristics. The dual function of TRIP steels, serving as both a high ductility load-carrying member and a sensor to monitor damage accumulation, was confirmed.
_____________
*1 Department of Architecture and Building Science, Graduate School of Engineering, Tohoku University, Aoba 6-6-11-1216, Sendai 980-8579, JAPAN
*2 Department of Architecture and Building Science, Graduate School of Engineering, Tohoku University, Aoba 6-6-06, Sendai 980-8579, JAPAN
*3 Design Department, OBAYASHI CORPORATION, 2-15-2 Konan, Minato-ku, Tokyo 108-8502, JAPAN
*4 Construction Engineering Services Dept., JFE STEEL CORPORATION, 2-2-3 Uchisaiwaicho, Chiyoda-ku, Tokyo 100-0011, JAPAN
*5 Planning and Development Division, KEISOKU RESEARCH CONSULTANT CO., 1-665-1 Fukuda, Higashi-ku, Hiroshima 732-0029, JAPAN
*6 Planning and Development Division, KEISOKU RESEARCH CONSULTANT CO., 3-22-7 Minamiooi, Sinagawa-ku, Tokyo 140-0013, JAPAN
1. INTRODUCTION
Recently, a lot of researches on base isolation and vibration control mainly for an earthquake and a wind force have been carried out. Especially, the vibration control systems are installed in the most of new high-rise buildings with the height of more than 60 m. The feature of these damage-control structures is that the earthquake energy, i.e., unusual disturbance, is absorbed with damper systems without damage of the mainframe. However, these systems are generally passive-type ones with energy-absorbed devices, and there is no architecture in which monitoring apparatus is installed in order to clarify the structural performance, yet.
On the other hand, there are some researches and developments on high-performance materials with a self-diagnosis function and a self-instauration function. It was indicated that the damage level after disaster can be diagnosed and can be applied to civil engineering structures that is easily restored [1], [2]. Therefore, the construction of structural systems with more clarified performance may be possible by applying these advanced technologies to damage-controlled architectural structures.
In this paper, TRIP (TRansformation Induced Plasticity) steel of Fe-Crstainless alloy that was studied as reinforcing bars for reinforced concrete structures [2], and stainless steel (SUS304) are experimentally studied for the damage-detection characteristics.
2. MATERIAL CHARACTERISTICS OF TRIP STEEL AND APPLICATION The steel plates used at specified portions of automobiles and some austenitic stainless steels have special material characteristics. The steels displayed a solid-state, strain-dependent phase transformation from a metastable, austenitic (face-centered-cubic crystal structure) parent phase to thermodynamically stable, martensitic (body-centered-cubic crystal structure) product phase as shown in Fig.1, resulting in high strength and improved ductility. The steel with this transformation phenomenon became known as TRIP steels [3]. TRIP steels were originally developed by Zackay et al. [4]. The activity at the time was directed at identifying ultra-high strength structural steels with improved toughness, i.e., fracture resistance, as compared with the high-strength, low-alloy steels that were being used for aircraft landing gear applications and the like. On the other hand, the research on the application of TRIP steels as sensor in order to examine simply the structural safety was carried out by Thompson et al. [5]. In
addition, several application fields of TRIP
steels to architectures were studied and new architectural systems were proposed [6].
In general, metals under loading beyond the elastic region transit into plastic region. In this
process, annealed austenitic stainless alloy
transforms to hard and strong martensitic product phase under normal
Stress
Strain Austenitic Phase Face-Centered-Cubic Crystal Structure Paramagnetism
Martensitic Phase
Body-Centered-Cubic Crystal Structure Ferromagnetism
Figure 1: Phase Transformation of TRIP Steel
temperature and the amount of martensitic product phase is linear to the amount of plastic region. The once transformed martensitic product phase never goes back to austenitic stainless alloy with unloading (irreversible reaction). The strain-induced phase transformation was responsible for the incredible values of ductility and strain hardening observed in these steels.
Basically, as the material begins to yield or enter into the plastic deformation regime, the phase transformation is triggered. The
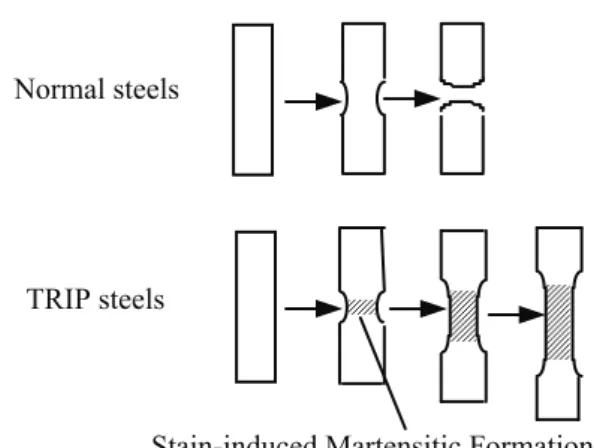
extent of transformation increases with applied strain so that more and more strain-induced martensite forms as strain increases. The transformation occurs inhomogeneously along the gauge length of a tensile specimen such that the regions where martensite has formed become stronger than the rest of the gauge length and so necking, i.e., mechanical instability that concentrates subsequent plasticity in the neck, is delayed (see Fig. 2). Once the transformation occurs to a significant extent along the entire gauge length, the deformation of specimen then occurs homogeneously throughout the gauge length until failure, typically with very little or no necking down associated with final fracture [7], [8]. Specimen elongations of more than 50 % were observed.
TRIP steels are thus high-strength, high-ductility materials originally developed as replacement materials for use in applications requiring high-strength, low-alloy steels.
The combination of strength and ductility displayed by TRIP steels was a direct consequence of the metastable austenitic microstructure developed through special treatment manufacture processing. TRIP steels gradually transform on application of strain from austenitic phase to martensitic phase. The parent austenite is paramagnetic and displays no significant ferromagnetic response. The product martensite is ferromagnetic. The transition occurs gradually and irreversibly as a function of applied strain thereby producing a ferromagnetic indicator in the amount of martensite formed that can be correlated with the degree of straining. Such self-sensing, self-diagnosis and self-actuating intelligent abilities of TRIP steels are considered for the application as health monitoring system in architectural structures.
For the special material characteristics of TRIP steels such as high ductility, high strength and the maximum strain memory associated with magnetics amount, the following application fields were proposed [6].
(1) Application to reinforcement at the end of RC members in order to increase the flexural resistance and the plastic strain area
(2) Application to anchor bolts of column base in steel structures in order to increase the strength and the ductility and reduce the amount of bolts
(3) Application to the damper plate with uniformed section and increase the plastic strain area
Normal steels
TRIP steels
Stain-induced Martensitic Formation
Figure 2: Plasticity of TRIP Steel
(4) Application to the splice plate at bolting joint in steel structures in order to increase the strength and the ductility and reduce the size of plates
(5) Application to thin-plate steel structures by press fabrication, deformed steel plates and cold-work steel pipes
(6) Application to IC-tag that records the results of magnetic measurement and damage level
(7) Application to reused steel members with the damage hysteresis
There is not enough data of TRIP steels on the magnetic characteristics under uniaxial compressive stress. This is because TRIP-bar sensors are mainly utilized under uniaxial tensile stress. In addition, it was indicated that the influence of loading direction on the amount of martensite should be identified for practical use as a sensor because of the anisotropic amount of martensite for the loading direction [2].
Therefore, it is quite important research subject to identify the magnetic characteristics under uniaxial and alternative cyclic loading and also compare with stainless steels (SUS304) that are usually used as architectural materials. In this paper, tensile and compressive loading tests with bar specimens are carried out in order to quantify the correlation between stress-strain curves and magnetic measurement. In addition, the applicability to damage-recorded IC-Tag are studied with plate specimens.
3. TENSION AND COMPRESSION TESTS WITH BAR SPECIMENS 3.1 Overview of Experiment
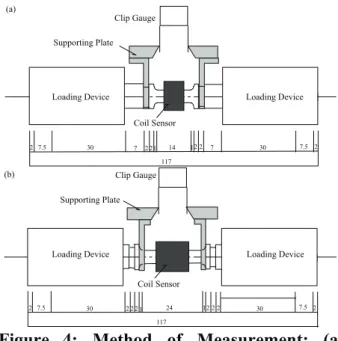
Two sizes of specimens were adopted as shown in Fig.3 in order to restrain buckling of specimens under alternative cyclic loading. The specimen A has the parallel gauge length of 14 mm and the specimen B has the parallel gauge length of 24 mm for the longer magnetic-measurement coil (Coil Sensor). Every specimen is treated as paramagnetic condition after fabrication. Fig.4 and Table 1 show the measurement method and overview of specimens, respectively. Strain measurement is carried out with two strain gauges installed at the confronted center of specimen, as well as with clip gauge in which the
strain is calculated with measured displacement divided by the gauge length of 17.44 mm for Specimen A and 26 mm for Specimen B, as shown in Fig.4. The magnetic response is measured as induced voltage by the magnetic-measurement coil installed at the parallel gauge of specimens. The coil length of Specimen A is 8 mm and that of Specimen B is 14 mm in order to measure the larger amount magnetic response.
Regarding the loading
2 7.5 30 7 2 21 14 12 2 7 30 7.5 2
φ6 φ10 φ20
φ3
117 (a) M10
24 φ6
117
2 7.5 30 2 2 21 12 2 2 30 7.5 2
φ10 φ20
φ3 (b) M10
Figure 3: Overview of Specimens: (a) Specimen A, (b) Specimen B
configuration for TRIP steels, uniaxial tensile and compressive cyclic loading and alternative cyclic loading are applied to Specimen A and B. Regarding the stainless steels, only alternative cyclic loading is applied.
The following strain hysteresis is set at each loading step for each specimen. Loading is controlled by the displacement measured by the clip gauge and the strain rate is 0.01mm/min up to ±0.2% of strain and 0.1mm/min after the strain level for Specimen A, and 0.0025mm/min up to ±0.2% of strain and 0.025mm/min after the strain level for Specimen B.
・Tensile Cyclic Loading: 0_+0.2%_+0.4%_+0.8%_+1.0%_+2.0%_+3.0%
・Compressive Cyclic Loading: 0_−0.2%_−0.4%_−0.8%_−1.0%_−2.0%_+3.0%
・Alternative Cyclic Loading: 0_±0.2%_±0.4%_±0.8%_±1.0%_±2.0%_±3.0%
Table 1: Overview of Specimens
Specimen Loading Configuration Specimen Type Material
TRIP1A Tension A TRIP steel
TRIP1B Tension B TRIP steel
TRIP2A Compression A TRIP steel
TRIP2B Compression B TRIP steel
TRIP3A1, TRIP3A2 Alternative Loading A TRIP steel TRIP3B1, TRIP3B2 Alternative Loading B TRIP steel
SUSA1, SUSA2 Alternative Loading A SUS304
SUSB1, SUSB2 Alternative Loading B SUS304
3.2 Test Results and Consideration
Every experimental result is shown from Fig.5 to Fig.10. From the figures, it is obvious that there is little difference of the stress-strain hysteresis between Specimen A and Specimen B for both TRIP steels and stainless steels (SUS304). However, the output voltage strongly depends on the length of specimens between Specimen A and Specimen B for both TRIP steels and stainless steels. Regarding the stress-strain hysteresis, there is obvious difference between TRIP steels and stainless steels, and TRIP steels show higher strain-hardening behavior. In addition, the output voltage of stainless steels is extremely smaller than TRIP steels, and the output voltage is reduced after unloading. On the other hand, TRIP steels overall keep the output voltage after unloading. In addition, TRIP steels show the independency of loading direction and
2 7.5 30 7 2 21 14 12 2 7 30 7.5 2
117 Loading Device
Clip Gauge Supporting Plate
Coil Sensor (a)
Loading Device
24 117
2 7.5 30 2 2 2 1 12 2 2 30 7.5 2
(b)
Loading Device Clip Gauge Supporting Plate
Coil Sensor
Loading Device
Figure 4: Method of Measurement: (a) Specimen A, (b) Specimen B
0 100 200 300 400 500 600
0 0.5 1 1.5 2
TRIP1A TRIP1B
Stress (MPa)
Strain with Strain Gauge (%)
0 100 200 300 400 500 600
0 0.5 1 1.5 2 2.5 3 3.5
TRIP1A TRIP1B
Stress (MPa)
Strain with Clip Gauge (%)
0 5 10 15 20
0 0.5 1 1.5 2 2.5 3 3.5
TRIP1A TRIP1B
Output Voltage (mV)
Strain with Clip Gauge (%)
0 5 10 15 20
0 20 40 60 80 100 120 140
TRIP1A TRIP1B
Elapsed Time (min)
Output Voltage (mV)
Figure 5: Hysteresis Curve of TRIP Steel under Tensile Loading
-600 -400 -200 0 200 400 600
-3 -2 -1 0 1 2 3
TRIP2A TRIP2B
Stress (MPa)
Strain with Strain Gauge (%)
-600 -400 -200 0 200 400 600
-3 -2 -1 0 1 2 3
TRIP2A TRIP2B
Stress (MPa)
Strain with Clip Gauge (%)
0 10 20 30 40 50
-3 -2 -1 0 1 2 3
TRIP2A TRIP2B
Output Voltage (mV)
Strain with Clip Gauge (%)
0 10 20 30 40 50
0 30 60 90 120 150
TRIP2A TRIP2B
Elapsed Time (min)
Output Voltage (mV)
Figure 6: Hysteresis Curve of TRIP Steel under Compressive Loading
-800 -600 -400 -200 0 200 400 600 800
-4 -3 -2 -1 0 1 2 3 4
TRIP3A1 TRIP3A2 TRIP3B1 TRIP3B2
Stress (MPa)
Strain with Strain Gauge (%)
-800 -600 -400 -200 0 200 400 600 800
-4 -3 -2 -1 0 1 2 3 4
TRIP3A1 TRIP3A2 TRIP3B1 TRIP3B2
Stress (MPa)
Strain with Clip Gauge (%)
0 10 20 30 40 50
-4 -3 -2 -1 0 1 2 3 4
TRIP3A1 TRIP3A2 TRIP3B1 TRIP3B2
Output Voltage (mV)
Strain with Clip Gauge (%)
0 10 20 30 40 50
0 70 140 210 280 350
TRIP3A1 TRIP3A2 TRIP3B1 TRIP3B2
Elapsed Time (min)
Output Voltage (mV)
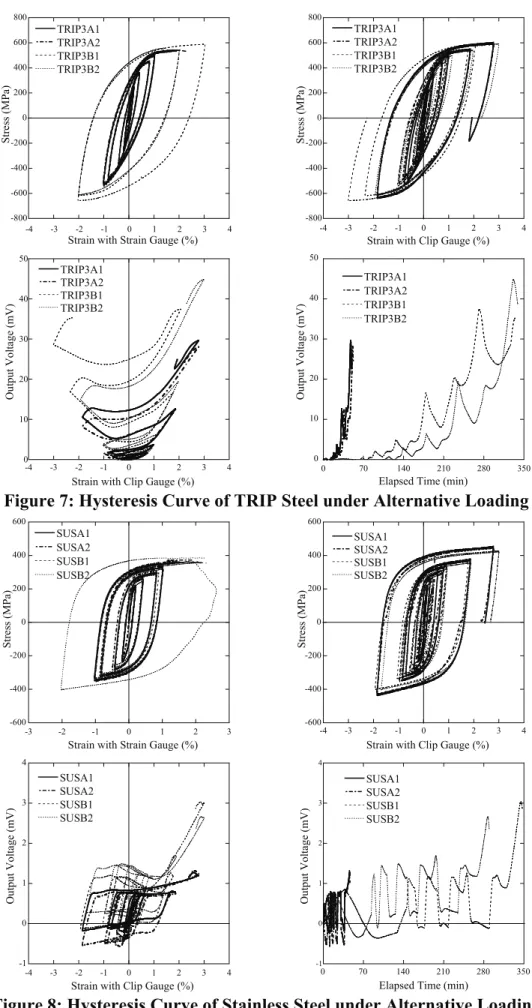
Figure 7: Hysteresis Curve of TRIP Steel under Alternative Loading
-600 -400 -200 0 200 400 600
-3 -2 -1 0 1 2 3
SUSA1 SUSA2 SUSB1 SUSB2
Stress (MPa)
Strain with Strain Gauge (%)
-600 -400 -200 0 200 400 600
-4 -3 -2 -1 0 1 2 3 4
SUSA1 SUSA2 SUSB1 SUSB2
Stress (MPa)
Strain with Clip Gauge (%)
-1 0 1 2 3 4
-4 -3 -2 -1 0 1 2 3 4
SUSA1 SUSA2 SUSB1 SUSB2
Output Voltage (mV)
Strain with Clip Gauge (%)
-1 0 1 2 3 4
0 70 140 210 280 350
SUSA1 SUSA2 SUSB1 SUSB2
Elapsed Time (min)
Output Voltage (mV)
Figure 8: Hysteresis Curve of Stainless Steel under Alternative Loading
-800 -600 -400 -200 0 200 400 600 800
-2 -1 0 1 2
TRIP3A1 TRIP3A2 SUSA1 SUSA2
Stress (MPa)
Strain with Strain Gauge (%)
-800 -600 -400 -200 0 200 400 600 800
-3 -2 -1 0 1 2 3
TRIP3A1 TRIP3A2 SUSA1 SUSA2
Stress (MPa)
Strain with Clip Gauge (%)
0 5 10 15 20 25 30
-3 -2 -1 0 1 2 3
TRIP3A1 TRIP3A2 SUSA1 SUSA2
Output Voltage (mV)
Strain with Clip Gauge (%)
0 5 10 15 20 25 30
0 10 20 30 40 50 60
TRIP3A1 TRIP3A2 SUSA1 SUSA2
Elapsed Time (min)
Output Voltage (mV)
Figure 9: Hysteresis Curve under Alternative Loading (Specimen A)
-800 -600 -400 -200 0 200 400 600 800
-4 -3 -2 -1 0 1 2 3 4
TRIP3B1 TRIP3B2 SUSB1 SUSB2
Stress (MPa)
Strain with Strain Gauge (%)
-800 -600 -400 -200 0 200 400 600 800
-4 -3 -2 -1 0 1 2 3 4
TRIP3B1 TRIP3B2 SUSB1 SUSB2
Stress (MPa)
Strain with Clip Gauge (%)
0 10 20 30 40 50
-4 -3 -2 -1 0 1 2 3 4
TRIP3B1 TRIP3B2 SUSB1 SUSB2
Output Voltage (mV)
Strain with Clip Gauge (%)
0 10 20 30 40 50
0 50 100 150 200 250 300 350
TRIP3B1 TRIP3B2 SUSB1 SUSB2
Elapsed Time (min)
Output Voltage (mV)
Figure 10: Hysteresis Curve under Alternative Loading (Specimen B)
similar output voltage-strain hysteresis, and the increase of output voltage becomes prominent beyond the strain level of±0.5% that coincides with the experiments under tensile loading [2]. Thus, the characteristics of TRIP steel as high-strength, high-ductility and self-diagnosis materials are identified, and the difference between TRIP steels and stainless steels are clarified.
4. BENDING TEST WITH PLATE SPECIMENS 4.1 Plate-Bending Test
In addition to the experiments on the maximum strain memory with bar specimens, the simple bending test with plate specimens is carried out in order to identify the applicability of TRIP steels to structural members. In this test, TRIP steels (Plate-50×100×1.0mm) and stainless steels (SUS304: Plate-50×100×0.8mm) are bended by hand, and the magnetic response due to flexural deformation at the centerline of plate specimens is measured by FERITSCOPE. The FERITSCOPE is a measure according to the magnetic-induction method. A magnetic field generated by a coil enters into interaction with the magnetic components of the specimen. The changes in the magnetic field induce a voltage proportional to the ferrite content in a second coil.
(Ⅳ)第1回曲げ戻し
0.41 0.46 0.47 0.64 1.70 1.40 0.58 0.44 0.43 0.38 0.44 0.38 0.36 0.51 1.70 1.60 0.49 0.42 0.39 0.38 0.46 0.37 0.41 0.54 1.70 1.90 0.49 0.41 0.41 0.38 0.52 0.44 0.44 0.56 1.80 2.00 0.54 0.43 0.41 0.36 0.57 0.51 0.50 0.62 1.50 1.80 0.58 0.44 0.40 0.32 (Ⅴ)第3回曲げ
2.20 2.00 2.20 2.80 2.00 3.10 2.00 3.00 2.10 2.60 (Ⅵ)第2回曲げ戻し
2.10 1.60 2.70 2.10 2.40 2.30 2.30 2.70 1.90 1.90
3,0 3,6
3,2
3,3 2,9 (Ⅰ)初期値
0.41 0.46 0.44 0.40 0.46 0.42 0.41 0.43 0.42 0.38 0.44 0.41 0.38 0.39 0.42 0.36 0.36 0.41 0.43 0.41 0.47 0.42 0.43 0.37 0.45 0.38 0.37 0.38 0.41 0.41 0.51 0.47 0.43 0.43 0.49 0.39 0.39 0.40 0.42 0.40 0.58 0.53 0.50 0.46 0.52 0.43 0.44 0.41 0.40 0.38 (Ⅱ)第1回曲げ
0.44 0.46 0.47 0.67 1.80 1.40 0.54 0.45 0.44 0.39 0.46 0.41 0.37 0.55 1.90 1.80 0.48 0.44 0.46 0.41 0.45 0.42 0.37 0.58 2.00 1.80 0.50 0.41 0.43 0.41 0.51 0.48 0.44 0.59 1.90 1.70 0.51 0.43 0.43 0.39 0.58 0.52 0.51 0.67 1.70 1.60 0.60 0.44 0.43 0.40 (Ⅲ)第2回曲げ
2.20 2.00 2.20 2.80 2.00 3.10 2.00 3.00 2.10 2.60
2,9
2,9 3,1 2,8 2,6
Figure 11: Test Results of TRIP Steel
(1) Initial Stage
(2)First Bending
(3)Second Bending (Larger than First Bending)
(4)First Retortion
(5)Third Bending (Same Level as First Bending)
(6)Second Retortion (Same Level as Initial Stage)
(Ⅳ)第1回曲げ戻し
0.20 0.22 0.21 0.21 0.27 0.23 0.21 0.21 0.21 0.21 0.20 0.20 0.22 0.21 0.28 0.24 0.21 0.20 0.20 0.21 0.21 0.21 0.21 0.21 0.28 0.23 0.21 0.21 0.21 0.21 0.22 0.21 0.21 0.21 0.28 0.23 0.21 0.21 0.21 0.21 0.21 0.22 0.22 0.21 0.28 0.23 0.19 0.20 0.22 0.22 (Ⅴ)第3回曲げ
0.21 0.21 0.21 0.21 0.29 0.25 0.22 0.21 0.21 0.21 0.21 0.22 0.22 0.22 0.32 0.26 0.21 0.21 0.21 0.21 0.20 0.21 0.23 0.22 0.32 0.26 0.22 0.21 0.22 0.22 0.21 0.21 0.21 0.22 0.31 0.26 0.22 0.21 0.21 0.21 0.20 0.21 0.21 0.22 0.29 0.25 0.22 0.22 0.22 0.22 (Ⅵ)第2回曲げ戻し
0.21 0.21 0.20 0.21 0.29 0.25 0.22 0.21 0.21 0.21 0.21 0.21 0.21 0.21 0.32 0.27 0.21 0.21 0.21 0.21 0.20 0.21 0.21 0.22 0.31 0.27 0.22 0.22 0.22 0.22 0.21 0.21 0.21 0.21 0.31 0.27 0.21 0.21 0.21 0.21 0.20 0.21 0.21 0.21 0.29 0.25 0.21 0.22 0.21 0.21 (Ⅰ)初期値
0.21 0.21 0.21 0.20 0.21 0.20 0.21 0.21 0.21 0.20 0.21 0.20 0.21 0.21 0.20 0.20 0.20 0.20 0.21 0.20 0.18 0.21 0.21 0.21 0.21 0.22 0.22 0.21 0.21 0.21 0.21 0.22 0.21 0.21 0.21 0.21 0.21 0.21 0.22 0.22 0.22 0.21 0.21 0.21 0.21 0.21 0.21 0.23 0.21 0.21 (Ⅱ)第1回曲げ
0.21 0.21 0.21 0.21 0.24 0.22 0.21 0.21 0.21 0.23 0.21 0.20 0.21 0.21 0.24 0.21 0.21 0.21 0.21 0.21 0.21 0.21 0.21 0.21 0.24 0.21 0.22 0.21 0.21 0.21 0.20 0.21 0.21 0.21 0.25 0.22 0.21 0.21 0.22 0.22 0.21 0.21 0.21 0.21 0.25 0.22 0.21 0.21 0.21 0.20 (Ⅲ)第2回曲げ
0.21 0.21 0.21 0.22 0.26 0.23 0.21 0.21 0.21 0.21 0.21 0.21 0.21 0.21 0.26 0.24 0.21 0.21 0.21 0.21 0.20 0.20 0.21 0.21 0.26 0.23 0.22 0.22 0.21 0.21 0.21 0.21 0.22 0.21 0.26 0.24 0.22 0.21 0.21 0.21 0.21 0.21 0.21 0.22 0.27 0.23 0.21 0.22 0.21 0.21
Figure 12: Test Results of Stainless Steel
(1) Initial Stage
(2)First Bending
(3)Second Bending (Larger than First Bending)
(4)First Retortion
(5)Third Bending (Same Level as First Bending)
(6)Second Retortion (Same Level as Initial Stage)
This voltage is then evaluated. A ten-mm mesh is drawn on the surface of plate specimens, and the ferrite content is measured at the center portion of each mesh.
Every specimen is treated as paramagnetic condition after fabrication.
In the test, after flexural deformation is applied, retortion and rebending are repeatedly applied with the measurement of ferrite content. Figs.11and 12 show the test results of TRIP steels and stainless steels (SUS 304), respectively. In the figures, the number indicates the included ferrite volume percentage (%). In the case of TRIP steels, large ferrite content is observed according to the increased flexural deformation at the centerline of the plate, and few reduction of ferrite content after retortion. On the other hand, little ferrite content is observed according to the increased flexural deformation at the centerline of the plate in the case of stainless steels.
4.2 Beam-Bending Test
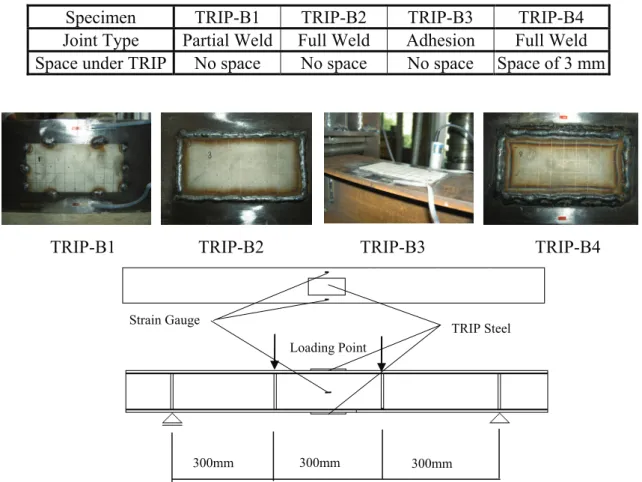
The specimen is a steel beam (H-100×100×6×8mm: σy=387N/mm2: SN490B) and TRIP steel plate (Plate-50×100×1.0mm) is attached on both upper and lower flange plate at the center of the beam as shown in Fig.13. The displacement-controlled loading system is a uniaxial cyclic load according to the displacement of 0.3 δp, 0.4 δp, 0.5 δp, 1.0 δp, 2.0 δp and 4.0 δp (δp: displacement at the center of the beam associated with the occurrence of the full plastic hinge at both loading points). The joint method between the TRIP plate and the steel beam is shown in Table 2 and Fig. 13.
Table 2: Overview of Specimens
Specimen TRIP-B1 TRIP-B2 TRIP-B3 TRIP-B4
Joint Type Partial Weld Full Weld Adhesion Full Weld Space under TRIP No space No space No space Space of 3 mm
TRIP-B1 TRIP-B2 TRIP-B3 TRIP-B4
Figure 13: Overview of Specimens
Strain Gauge
300mm
Loading Point
TRIP Steel
300mm 300mm
The welding is a partial or full fillet weld (Solid Wire SE-50T), and the adhesion is Gauge adhesion CC-33. In addition, only for the specimen TRIP-B4, the space of 3 mm between the steel beam and the TRIP plate is installed with the wood plate in order to reduce the magnetic influence of the steel beam.
A ten-mm mesh is drawn on the surface of plate specimens, and the ferrite content is measured at the center portion of each mesh for Region 1, 2, and 3 as shown in Fig.14.
The averaged ferrite content at each Region is estimated. As shown in Fig.15, there is little influence of both adhesion and full welding on ferrite content and it is possible to apply the present joint method. Fig.16 shows the load-strain and load-displacement relations at the center of the beam for each specimen. The strain level at the center of beam is around from 2000 μ to 3000 μ that is yield strain level, though full plastic hinges occur at loading points. Fig. 17 shows the ferrite content-strain relation at Region 1, 2 and 3, respectively. There is few increase of ferrite content except the specimen TRIP-B2 in which sharp increase of ferrite volume percentage in tension is observed.
Figure 15: Test Results: (a) Adhesion, (b) Full Welding
(Ⅰ)接着剤取りつけ前
2.40 2.60 2.70 2.70 2.70 2.70 2.70 2.60 2.70 2.70 2.30 2.20 2.40 2.40 2.40 2.30 2.20 2.10 2.20 2.50 2.20 2.20 2.20 2.20 2.20 2.20 2.20 2.10 2.00 2.40 2.40 2.20 2.20 2.10 2.20 2.20 2.10 2.10 2.40 2.40 2.90 2.80 2.50 2.50 2.50 2.70 2.70 2.70 2.80 2.70 (Ⅱ)接着剤取りつけ後
3.00 3.10 3.20 3.10 3.20 3.20 3.20 3.20 3.10 3.00 3.00 3.10 3.10 2.90 3.00 3.10 3.00 3.00 3.00 2.90 3.10 3.00 3.00 2.50 2.90 3.00 2.90 3.00 2.90 2.30 2.40 2.50 3.10 2.70 3.00 3.00 3.10 3.00 3.00 2.90 3.00 3.30 3.20 3.10 2.70 2.40 2.90 3.10 3.20 3.10 (Ⅲ)全周溶接取りつけ前
2.50 2.70 2.80 2.60 2.80 2.60 2.70 2.80 2.80 2.70 2.40 2.40 2.60 2.50 2.50 2.40 2.50 2.60 2.60 2.60 2.30 2.30 2.20 2.40 2.30 2.30 2.30 2.40 2.40 2.60 2.50 2.20 2.20 2.40 2.36 2.30 2.40 2.60 2.60 2.50 2.50 2.60 2.50 2.50 2.50 2.50 2.50 2.60 2.50 2.70 (Ⅳ)全周溶接取りつけ後
3.10 3.20 3.00 3.30 3.10 3.00 2.90 2.80 2.60 2.60 2.80 2.80 2.80 2.80 3.00 2.80 2.80 2.90 2.80 2.40 2.80 2.80 2.80 2.80 3.00 2.80 2.80 2.90 2.80 2.80 3.00 3.00 3.00 2.90 3.10 3.10 3.00 2.90 2.90 2.80 3.00 3.00 3.00 3.20 3.00 2.90 2.80 3.10 2.90 2.90 (a1) Before adhesion
(a2) After adhesion
(b1) Before full welding
(b2) After full welding
Figure 14: Measurement Point for 3 Regions
1 1 1
2 2 2
3 3 3 1
1 1
2 2 2
3 3 3
0 50 100 150 200 250
-0.004 -0.002 0 0.002 0.004
Tension Comp.1 Comp.2 Web plate
Load (KN)
Strain
TRIP-B1
0 50 100 150 200 250
Tension Comp.1 Comp.2 Web plate
-0.004 -0.002 0 0.002 0.004
Load (KN)
Strain
TRIP-B2
0 50 100 150 200 250
-0.006 -0.004 -0.002 0 0.002 0.004 0.006
Tension Comp.1 Comp.2 Web plate
Load (KN)
Strain
TRIP-B3
0 50 100 150 200 250
-0.004 -0.002 0 0.002 0.004
Tension Comp.1 Comp.2 Web plate
Load (KN)
Strain
TRIP-B4
0 50 100 150 200 250
0 0.5 1 1.5 2 2.5
TRIP-B1
Load (KN)
Displacement (cm)
0 50 100 150 200 250
0 0.5 1 1.5 2 2.5
TRIP-B2
Load (KN)
Displacement (cm)
0 50 100 150 200 250
0 0.5 1 1.5 2 2.5
TRIP-B3
Load (KN)
Displacement (cm)
0 50 100 150 200 250
0 0.5 1 1.5 2 2.5
TRIP-B4
Load (KN)
Displacement (cm)
Figure 16: Load vs. Strain and Load vs. Displacement
1.5 2 2.5 3 3.5 4 4.5 5
-0.0035 -0.003 -0.0025 -0.002 -0.0015 -0.001 -0.0005 0
Region 1 Region 2 Region 3
Ferrite Content (%)
Strain
TRIP-B1
1.5 2 2.5 3 3.5 4 4.5 5
0 0.0005 0.001 0.0015 0.002 0.0025
Region 1 Region 2 Region 3
Ferrite Content (%)
Strain
TRIP-B1
1.5 2 2.5 3 3.5 4 4.5 5
-0.0035 -0.003 -0.0025 -0.002 -0.0015 -0.001 -0.0005 0
Region 1 Region 2 Region 3
Ferrite Content (%)
Strain
TRIP-B2
1.5 2 2.5 3 3.5 4 4.5 5
0 0.0005 0.001 0.0015 0.002 0.0025
Region 1 Region 2 Region 3
Ferrite Content (%)
Strain TRIP-B2
1.5 2 2.5 3 3.5 4 4.5 5
-0.0035 -0.003 -0.0025 -0.002 -0.0015 -0.001 -0.0005 0
Region 1 Region 2 Region 3
Ferrite Content (%)
Strain
TRIP-B3
1.5 2 2.5 3 3.5 4 4.5 5
0 0.0005 0.001 0.0015 0.002 0.0025
Region 1 Region 2 Region 3
Ferrite Content (%)
Strain
TRIP-B3
0.5 0.6 0.7 0.8 0.9 1
-0.0035 -0.003 -0.0025 -0.002 -0.0015 -0.001 -0.0005 0
Region 1 Region 2 Region 3
Ferrite Content (%)
Strain
TRIP-B4
0.5 0.6 0.7 0.8 0.9 1
0 0.0005 0.001 0.0015 0.002 0.0025
Region 1 Region 2 Region 3
Ferrite Content (%)
Strain
TRIP-B4
Figure 17: Ferrite Content vs. Strain
5. CONCLUSIONS
In this paper, the damage-detection characteristics of Fe-Cr stainless alloy, TRIP steels, and stainless steels (SUS 304) are studied experimentally. On the important research issues for the practical uses of the high performance alloy, the magnetic characteristics under tensile and compressive uniaxial cyclic loading and alternative cyclic loading, and the comparison with stainless steel are experimentally identified. Furthermore, bending tests with plate specimens are carried out by measuring ferrite content. The present research has yielded the following findings.
(1) Tension and Compression Test
1-1) There is obvious difference on the stress-strain hysteresis between TRIP steels and stainless steels, and TRIP steels show higher strain-hardening behavior.
1-2) The output voltage of stainless steels is extremely smaller than TRIP steels.
TRIP steels overall keep the output voltage after unloading, and show the independency of loading direction and similar output voltage-strain hysteresis.
1-3) The characteristics of TRIP steel are identified, and the difference between TRIP steels and stainless steels are clarified.
(2) Bending Test
2-1) In the case of TRIP steels, large ferrite content is observed according to the increased flexural deformation, and few reduction of ferrite content after retortion.
Little ferrite content is observed in the case of stainless steels.
2-2) There is few influence of both adhesion and full welding on ferrite content.
2-3) There is little increase of ferrite content except the specimen TRIP-B2 in which sharp increase of ferrite volume percentage in tension is observed.
ACKNOWLEDGEMENTS
This research work was partially supported by the Japan Iron and Steel Federation, grant-in-aid for Research on Architectural Steel Structure. Authors would like to express their thanks to the financial aid. In addition, authors thank the collaborators in 21-century Forum for Steel Structure, Mr. Otsubo at JFE Techno-Research Corporation for his production of TRIP-steel specimens and Mr. Ryugo at Koden Electronics Co., Ltd. for his production of Coil Sensor.
REFERENCES
1) Adachi, Y. and Unjoh, S.: Development of shape memory alloy damper for intelligent bridge systems, Proc. of 6th smart structures and materials, SPIE Vol. 3671, pp.31-42. (1999)
2) Adachi, Y. and Unjoh, S.: Seismic damage sensing technology of intelligent structures using self-diagnosis material, Proc. Of JSCE annual conf., Vol.1, B 253, pp.506-507. (2000) (in Japanese) 3) Fujita, T.: Design and Theory of Steel Materials, pp.177-179, Maruzen Co. Ltd. (1981) (in Japanese) 4) Zackay, V., Parker, E., Fahr, D. and Busch, R.: The Enhancement of Ductility in High-strength Steels,
Trans. Of ASM, 60, pp.252-259. (1967)
5) Thompson, L. and Westermo, B.: A new strain measurement technology for material damage assessment, Proc. smart sensing, processing, and instrumentation control, Ed. by J.S. Sirkis, SPIE Vol.
2191, pp.380-391. (1993)
6) Working Group 1 in 21-century Forum for Steel Structure: Applicability of high-performance elements to building materials, Steel Structure Symposia 2004, Special session 1, pp.5-9. (2004) (in Japanese)
7) Group A in 21-century Forum for Steel Structure: Approach for Humanlike Architectures (Abridgment), The Kenchiku Gijyutsu, No. 636, pp.190-191. (2003) (in Japanese)
8) Takahashi, M.: Development of High Strength Steels for Automobiles, Nippon Steel Corporation Technical Reports, No.378, pp.2-6. (2003) (in Japanese)