平成27年度博士学位論文
Studies on Molecular Mechanisms of Geranylgeranoic Acid-induced Cell Death in Human Hepatoma Cells
ヒト肝癌細胞におけるゲラニルゲラノイン酸による 細胞死誘導の分子メカニズムに関する研究
D3212002 岩尾千絵子
2016 年 3 月
長崎県立大学大学院
人間健康科学研究科 栄養科学専攻
専攻分野 細胞生化学
指導教員 四童子好廣 印
Contents
Chapter I: General Introduction ... 1
Geranylgeranoic acid ... 2
Tumor protein p53 and energy metabolism ... 2
Warburg effect ... 4
GGA-induced incomplete autophagic response ... 4
Lipid-induced unfolded protein responses ... 6
Protein chemistry approach with Blue native-gradient PAGE and cross-linking SDS-PAGE .... 7
The aim of this thesis ... 8
Figures ... 10
Chapter II: Upregulation of energy metabolism-related, p53-target TIGAR and SCO2 in HuH-7 cells by GGA treatment ... 13
Abstract ... 14
Introduction ... 15
Materials and Methods ... 17
Results ... 24
SCO2 protein was upregulated by GGA treatment ... 24
Specificity for GGA in SCO2 protein upregulation ... 24
Specificity for SCO2 protein in GGA-induced upregulation ... 25
Upregulation of cellular F6-P level after GGA treatment ... 25
Metabolomics changes in GGA-treated cells ... 25
Discussion ... 27
Figures ... 30
Chapter III: Induction of nuclear translocation of mutant cytoplasmic p53 by GGA in HuH-7 cells ... 38
Abstract ... 39
Introduction ... 40
Materials and Methods ... 43
Results ... 50
GGA treatment upregulates PUMA gene expression in HuH-7 cells ... 50
Mutant p53 is involved in GGA-induced cell death of HuH-7 cells ... 50
Mutant p53 relocates from the cytoplasm to the nucleus by GGA treatment ... 51
GGA-induced changes in native forms of p53 in the cytoplasmic space ... 52
p53 is released from putative huge complexes with GGA treatment ... 53
Nuclear translocation of mutant p53 upregulates PUMA mRNA levels in HuH-7 cells ... 54
Discussion ... 55
Figures ... 59
Chapter IV: GGA induces unfolded protein response in HuH-7 cells ... 68
Abstract ... 69
Introduction ... 70
Materials and Methods ... 72
Results ... 77
Rapid induction of XBP1 mRNA splicing by GGA treatment in HuH-7 cells ... 77
Structure specificity of diterpenoid-induced splicing of XBP1 mRNA in HuH-7 cells ... 78
Nuclear accumulation of XBP1s after GGA treatment ... 79
Specificity of diterpenoid-induced cell death in HuH-7 cells ... 79
GGA-induced XBP1 splicing shared a similarity with lipid-induced UPR ... 80
Rescue from GGA-induced cell death by oleate co-treatment ... 81
Inhibition of GGA-induced UPR attenuates GGA-induced accumulation of LC3-II ... 81
Discussion ... 83
Figures ... 87
Chapter V: General Discussion ... 101
How GGA affects p53 in HuH-7 cells? ... 102
GGA-induced UPR is an upstream signal of GGA-induced autophagy ... 104
Conclusions ... 105
Figure ... 106
Acknowledgements ... 107
References ... 108
List of abbreviations
ACSL3; acyl-CoA synthetase long-chain family member 3 ATF6; activating transcription factor 6
ATRA; all-trans retinoic acid Atg8; autophagy-related gene-8 BBC3; BCL2-binding component 3 BECN1; beclin 1
BH-3; bcl-2 homology domain 3 BiP; binding immunoglobulin protein BMH; bis(maleimido) hexane
BN-PAGE; blue native-gradient PAGE BSA; bovine serum albumin
cDNA; complementary DNA
COX; cytochrome c oxidase complex DIC; differential interference contrast DDIT3; DNA-damage-inducible transcript 3
m ; mitochondrial inner membrane potential D-MEM; Dulbecco’s modified Eagle’s medium DRAM; damage-regulated autophagy modulator eIF2; eukaryotic initiation factor 2 alpha ER; endoplasmic reticulum
FA; farnesoic acid FBS; fetal bovine serum
F1,6-DP ; D-fructose 1,6-bisphosphate F2,6-DP; D-fructose 2,6-bisphosphatase
F6-P; D-fructose 6-phosphate GFP; green fluorescent protein GGA; geranylgeranoic acid GGOH; geranylgeraniol
GRP78; glucose-regulated protein 78 G6-P; glucose 6-phosphate
HGNC; HUGO Nomenclature Committee HRP; horseradish peroxidase
HSPs; heat-shock proteins IRE1; inositol requiring 1
KEGG: Kyoto Encyclopedia of Genes and Genomes LC3; microtubule-associated protein 1 light chain 3 MCP; multi-channel plate
MD; mega dalton
MPCs; multiple protein complexes m/z; mass-to-charge ratio
DH; -nicotinamide adenine dinucleotide, reduced NetCDF; network common data file
ODC; ornithine decarboxylase
OPLS-DA; orthogonal partial least squares-discriminant analysis PAGE; polyacrylamide gel electrophoresis
PARC; p53-associated, parkin-like cytoplasmic protein PBS(-); phosphate buffered saline, Ca-free
PBS-T; PBS(-) containing 0.1% polyoxyethylene sorbitan monolaurate PCA; principal component analysis
PDIA4; protein disulfide isomerase family A, member 4
PEP; phosphoenolpyruvic acid
PERK; protein kinase RNA (PKR)-like ER kinase PKR; protein kinase RNA
PUMA; p53 upregulated modulator of apoptosis PVDF; Polyvinylidene difluoride
Q-Tof/MS; quadrupole time-of-flight type mass spectrometry RIPA; radioimmuno precipitation assay
RNase; endoribonuclease ROS; reactive oxygen species
RT-qPCR; reverse-transcription real-time polymerase chain reaction SAGE; serial analysis of gene expression
SCD1; stearoyl-CoA desaturase 1
SCO2; Synthesis of cytochrome c oxidase 2 SDS; sodium dodecylsulfate
SSAT; spermidine/spermine-N1-acetyltransferase TE; 10 mM Tris-HCl, pH 7.4 and 1 mM EDTA buffer TIGAR; TP53-induced glycolysis and apoptosis regulator TP53; Tumor protein 53
UPLC; ultra-performance liquid chromatography UPR; unfolded protein response
VIP; variable importance in the projection XBP1: X-box binding protein 1
WT; wild type
9CRA; 9-cis retinoic acid
1
Chapter I
General Introduction
Chieko Iwao
Molecular and Cellular Biology, Graduate School of Human Health Science, University of Nagasaki, Nagasaki, Japan
2
I-1. Geranylgeranoic acid
Geranylgeranoic acid (GGA, Fig. I-1) is a natural diterpenoid found in several medicinal herbs including turmeric [1]. GGA and its derivatives have been repeatedly reported to induce cell death in human hepatoma cells [2, 3]. In placebo-controlled randomized clinical trials, 4,5-didehydroGGA both safely and effectively prevented tumor recurrence in postoperative hepatoma-free patients [4-6]. While 4,5-didehydroGGA has been utilized for clinical trials, it has so far not been identified in natural resources.
GGA and 4,5-didehydroGGA were initially screened as acyclic retinoids to bind to cellular retinoic acid-binding protein [7]. Furthermore, both compounds were later shown to possess ligand activities for retinoid receptors (retinoic acid receptor and retinoid X-activated receptor) [2].
In human hepatoma-derived HuH-7 cells, GGA-induced cell death has been demonstrated by the chromatin condensation, large-scale DNA fragmentations, nucleosomal-scale ladder formation and dissipation of mitochondrial inner membrane potential (m) [8, 9]. It has been also reported that some caspase inhibitors delayed GGA-induced cell death and, furthermore, -tocopherol prevented HuH-7 cells from dissipation of m as well as programmed cell death in the presence of GGA.
Importantly, GGA induces a dramatic loss of m in 1 h and in a dose dependent manner in HuH-7 cells, but not in the primary hepatocytes [9].
In this thesis study, I have tried to investigate the mechanisms by which GGA induces cell death in hepatoma cells with a focus on the tumor suppressor gene TP53, endoplasmic reticulum (ER) stress response and autophagy.
I-2. Tumor protein p53 and energy metabolism
First I examined p53 because it has been well established that HuH-7 cells harbor the mutant TP53 gene [10]. TP53 is the first tumor suppressor gene linked to apoptosis [11], inhibits tumor
growth through activation of both cell cycle arrest and apoptosis, and is thought to be central to tumor-suppressor activity [12-14]. It seems likely that activation of p53-dependent cell death can
3
contribute to inhibition of cancer development at several stages during tumorigenesis [11]. The p53 pathway is crucial for effective tumor suppression in humans [15]. However, the frequencies of reported TP53 mutations vary considerably between cancer types, ranging from ~15% (for example, in bone cancers) to 50% (for example, in colorectal and head and neck cancers) (Fig. I-2).
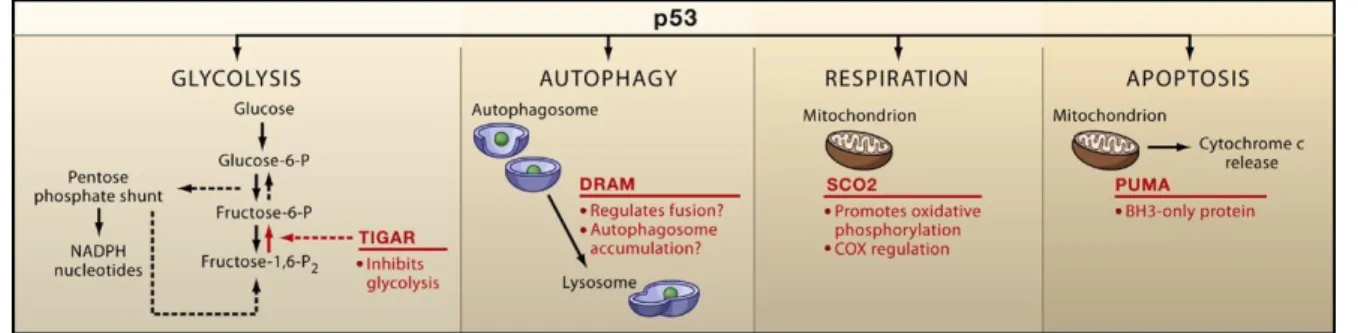
The transcription factor p53 responds to diverse stresses (including DNA damage, overexpressed oncogenes and various metabolic limitations) to regulate many target genes (Fig. I-3) that induce cell-cycle arrest (e.g. p21), apoptosis (e.g. PUMA) or respiration (e.g. SCO2) [16, 17].
The PUMA (p53 upregulated modulator of apoptosis or official name is BBC3, BCL2-binding component 3) gene is identified as a downstream target of the tumor suppressor p53 and a potent inducer of apoptosis in diverse tissues and cell types [18]. PUMA is one of BH-3 (bcl-2 homology domain 3) only proteins, which can induce mitochondrial outer membrane permeability transition and consequent mitochondria-dependent cell death through complex formation with anti-apoptotic Bcl-2 (or Bcl-xl) protein. Therefore, expression of PUMA will cause hyper-production of reactive oxygen species (ROS) from mitochondria and then induce mitophagy in order to recycle the damaged mitochondria.
Among p53 target genes, another cell-death-related gene, the TIGAR (TP53-induced glycolysis and apoptosis regulator) gene is regulated as a part of the p53 tumor suppressor pathway and encodes a protein with sequence similarity to the bisphosphatase domain of the glycolytic enzyme, fructose 2,6-bisphosphatase (F2,6-DP) that degrades F2,6-DP to fructose 6-phosphate (F6-P) (Fig.
I-4). The protein functions by blocking glycolysis and instead the resultant accumulated glucose 6-phosphate (G 6-P) directs the pathway into the pentose phosphate shunt, which provides antioxidant electron donor NADPH. Therefore, expression of the TIGAR protein also protects cells from DNA-damaging ROS and thereby from DNA damage-induced apoptosis [19].
As another p53-targeted gene, SCO2 (Synthesis of cytochrome c oxidase 2) is identified [19, 20].
Upon discovering that p53+/+ mice consumed significantly more oxygen and produced more ATP by
4
aerobic respiration than their p53-/- counterparts, the authors conducted a SAGE (serial analysis of gene expression) database search for potential p53-target gene products that could potentially modulate the process of aerobic respiration. And the protein is required for the proper assembly of the cytochrome c oxidase complex (COX) that is directly responsible for the reduction of oxygen during aerobic respiration.
I-3. Warburg effect
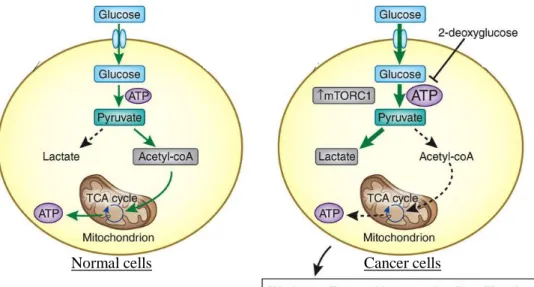
In general, cells that lack functional p53 represent a metabolic shift from respiration to glycolysis for the production of energy and lower oxygen consumption by mitochondrial respiration – thereby contributing to the Warburg effect [21].
The metabolic change known as the Warburg effect is a major feature of virtually all of clinical cancers [21]. In other words, unlike most normal cells, cancer cells acquire a mode of dependency on glycolysis for energy production (Fig. I-5). Although for many years considered to be a by-product or just accompanying phenomenon of the oncogenic process, this shift to high rate of glycolysis is suggested to be required for malignant progression [22]. Several different tumor-associated changes – in addition to loss of p53 function – participate in the shift to aerobic glycolysis in cancer cells [16, 23].
I-4. GGA-induced incomplete autophagic response
Second Okamoto et al recently identified that HuH-7 cells undergo an incomplete autophagic response following GGA treatment [24], which may also contribute to GGA-induced cell death.
While GGA causes the initial phase of autophagy, the late stage of autophagy such as maturation of autolysosomes or late stage of autophagy fail to proceed, leading to cell death in HuH-7 cells [24].
Most intracellular short-lived proteins are selectively degraded by ubiquitin-proteasome pathway [25], while most long-lived proteins are degraded in lysosomes [26]. The mechanism to deliver cytoplasmic components to the lysosomes is called autophagy in general. Three types of autophagy have been proposed: macroautophagy, microautophagy and chaperone-mediated
5
autophagy [27]. Among them, macroautophagy is believed to be responsible for the majority of the intracellular protein degradation, particularly of the starvation-induced proteolysis [26]. In macroautophagy (simply referred to as autophagy hereafter), cytoplasmic constituents including organelles such as mitochondrion and peroxisome, are first enwrapped by a membrane sac called
“isolation membrane”. Closure of isolation membrane results in formation of double membrane structure called “autophagosomes”. Autophagosomes, then, either through fusion with endosomes to become amphisomes or not, eventually, become autolysosomes, which are generated by the fusion of the outer membrane of the autophagosomes (or amphisomes) and lysosomes. Lysosomal hydrolases degrade the cytoplasm-derived contents of the autophagosome, together with its inner membrane [28].
LC3 (microtubule-associated protein 1 light chain 3) is specific to autophagy marker. LC3 was originally discovered as one of three light chains complexed with microtubule-associated proteins 1A and 1B. Unlike LC1 and LC2, LC3 are transcribed and translated as single proteins and conserved in fungi, plants and animals. In humans, three genes encode highly homologous LC3 proteins such as LC3, , and . Although LC3 is an ortholog of the yeast autophagosome protein Atg8 and all 3 proteins have been demonstrated to be involved in autophagosome biogenesis, LC3
has been used exclusively as a hallmark of autophagosome formation in mammalian cells. Hence, in this manuscript, I use a word of LC3 in place of LC3. LC3 is homolog of autophagy-related gene-8 (Atg8) essential for autophagy in yeast, and is associated to the autophagosome membranes after processing. Two forms of LC3, called LC3-I and -II, were produced post-translationally in various cells. LC3-I (apparent molecular size of approximately 18 kDa) is cytosolic and nonlipidated, whereas LC3-II (approximately 16 kDa) is membrane bound and lipidated with phosphatidyl ethanolamine [29].
In recent years, it has become clear that autophagy plays an important role in a variety of physiological responses as follows: starvation, development, differentiation, tumorigenesis, immunity and neurodegeneration [30]. Autophagy, particularly that responsive to starvation, is
6
generally considered a nonselective degradation of cellular constituents [30]. This large-scale degradation enables cells to survive during starvation by recycling of the degradation products for resources of energy production and macromolecule synthesis. In addition to the starvation-induced adaptive autophagy, growing lines of evidence point to the importance of basal autophagy that operates constitutively at low rates even under a nutrient-rich environment and plays a vital role in the maintenance of cellular homeostasis [27-34]. Indeed, studies using mouse genetics have indicated that autophagy-deficient mice exhibit remarkable accumulation of ubiquitinated protein aggregates followed by hepatocytic and neuronal cell death irrespective of nutrient stresses [31, 32, 34].
I-5. Lipid-induced unfolded protein responses
Third, I investigated what kind of cellular events GGA initially induces occurred during incomplete autophagic response. One of the possible mechanisms by which GGA could induce autophagy is the ER stress-mediated unfolded protein response (UPR) as an upstream signal of lipotoxicity with fatty acids [35].
In general, the conventional UPR is an adaptive stress response that responds to the accumulation of misfolded proteins in ER lumen (ER stress) and adjusts the protein-folding capacity to the needs of the cell [36, 37]. The UPR is sensed by the binding immunoglobulin protein (BiP)/glucose-regulated protein 78 (GRP78). The accumulation of unfolded proteins sequesters BiP/GRP78, so it dissociates from three ER-transmembrane transducers leading to their activation.
These transducers are inositol requiring 1 (IRE1), protein kinase RNA (PKR)-like ER kinase (PERK), and activating transcription factor 6 (ATF6) (Fig. I-6).
PERK phosphorylates eukaryotic initiation factor 2 alpha (eIF2) resulting in global mRNA translation attenuation, and concurrently selectively increases the translation of several mRNAs, including the transcription factor ATF4, and its downstream target CHOP. IRE1 has kinase and endoribonuclease (RNase) activities. IRE1 autophosphorylation activates the RNase activity to
7
splice X-box binding protein 1 (XBP1) mRNA and then to produce the active transcription factor XBP1s. Activation of IRE1 kinase also recruits and activates the stress kinase JNK. ATF6
transits to the Golgi compartment where it is cleaved by intramembrane proteolysis to generate a soluble active transcription factor, which is then conveyed into the nucleus. These UPR pathways act in concert to increase ER content, expand the ER protein folding capacity, degrade misfolded proteins, and reduce the load of new proteins entering the ER. Faced with persistent ER stress, adaptation starts to fail and apoptosis occurs, possibly mediated through calcium perturbations, ROS, and the proapoptotic transcription factor DNA-damage-inducible transcript 3 (DDIT3 or previously named CHOP) [38].
UPR is also activated by an aberrant lipid accumulation or a perturbation of cellular lipid accumulation, especially it is called “lipid-induced UPR”. In cultured cells, the UPR is activated by the accumulation of free cholesterol in the ER [39], exogenously supplied saturated fatty acids [40, 41] and perturbation of cellular fatty acid composition [42]. Activation of the UPR has been observed in the liver of dietary and genetically obese mice [43, 44] and in the tissue of obese human [45].
And recently one novel study discovers that lipid-induced UPR activates IRE1 and PERK, but does not activate ATF6. In brief, activation of the UPR by membrane lipid saturation occurs by a mechanism different from the conventional unfolded protein stress-sensing mechanism. The mechanism of the lipid-induced UPR is unclear, but it has been reported that palmitic acid treatment or knockdown of stearoyl-CoA desaturase 1 (SCD1) promotes an increase of saturated fatty acids in membrane phospholipids and activates the UPR in HeLa cells [42].
I-6. Protein chemistry approach with Blue native-gradient PAGE and cross-linking SDS-PAGE
Finally, in this thesis I applied a couple of protein chemistry methods, “Blue Native-gradient PAGE (BN-PAGE)” and “Cross-linking SDS-PAGE” to examine intracellular molecular assembly
8
of p53.
Multiple protein complexes (MPCs) play a crucial role in cell signaling, since most protein can be found in functional or regulatory complexes with other proteins [48]. Thus, the study of protein-protein interaction networks required the detailed characterization of MPCs to gain an integrative understanding of protein function and regulation. For identification and analysis, MPCs must be separated under native conditions. BN-PAGE is a technique that allows separation of MPCs in a native conformation with higher resolution [49]. Therefore it is useful to determine MPC size, composition, and relative abundance. By this method, proteins are separated according to their hydrodynamic size and shape in a polyacrylamide matrix. Moreover in cross-linking SDS-PAGE, cross-linking reagents provide the means for capturing MPCs by covalently binding them. So it also can be captured in its native conditions, one can get greater and more shape resolution of protein-protein interactions.
I-7. The aim of this thesis
We have been facing with super aging society, so that achievement of the prevention of life-style and aging related diseases such as cancer and obesity should be a way to solve the emerging social problem with health.
With regard to a national strategy against cancer, over the last 2 decades development of targeting drug therapies has become an important field of research. The aim with these emerging therapies is to specifically target one or several tumor suppressor genes including p53, BRCA1, Rb and so on, thus inhibiting tumor growth and inducing cell death. However, many drugs have only a transient effect and recurrence is often inevitable for certain types of cancer such as hepatoma. But as progressed in the understanding of carcinogenesis, new potential targets are enhancing the scope for the development of novel treatment specifically targeted to eliminate cancer cells.
This thesis provides a basic research for prevention of human hepatoma with GGA.
As mentioned above, GGA induces cell death thorough an incomplete autophagic response in
9
HuH-7 cells [24], which harbor the mutant TP53 gene [10]. However it has not yet been revealed how GGA-induces cell death at the molecular mechanism. So in this thesis, I have tried to clarify how GGA induces cell death by focusing on p53.
In chapter II, I investigated in HuH-7 cells whether or not GGA upregulates p53-target genes including SCO2 and TIGAR, both of which are related to energy metabolism. Prior to the scrutinized investigation, I started to globally compare cellular metabolites in between control and GGA-treated cells. From the results of chapter II, GGA may shift an energetic state from glycolysis to respiration dependency by reactivating the mutant p53 to upregulate TIGAR and SCO2 proteins in HuH-7 cells. Hence, in chapter III, I examined in detail how GGA affected the mutant p53 in HuH-7 cells. As a result, it was found that cytoplasmic p53 protein accumulated as huge complexes with PARC and other proteins on the endoplasmic reticulum (ER) in the cytoplasm. Moreover, it was discovered that GGA released the p53 protein from these huge complexes, and induced nuclear translocation of the cytoplasmic p53 protein.
In chapter IV, I finally surveyed how GGA affected the state of ER, where the p53 containing huge complexes were harbored. Then, it was discovered that UPR was immediately induced in ER after addition of GGA, and was also initiating signal linked to autophagic cell death. And it was found GGA induced lipid-induced UPR and more the UPR was linked to GGA-induced autophagy and cell death.
Through my doctoral thesis, I have now sincere hope that intensive basic research on natural cancer preventive compounds, such as GGA will pave a concrete road to protect super-aging society from cancer disease.
10
14.43 15.88
16.38 19.34
21.36 22.81
25.95 26.87
31.19 32.38
34.73 34.67
38.57 41.21
42.51 43.28
0 5 10 15 20 25 30 35 40 45 50
BONES (142/984) ENDOCRINE GLANDS (142/894) MALE GENITAL ORG (265/1618) LYMPH NODES (484/2502) SOFT TISSUES (260/1217) BREAST (3755/16462) NERVOUS SYSTEM (1803/6949) URINARY TRACT (1768/6580) LIVER (1840/5900) STOMACH (1287/3975) SKIN (778/2240) PANCREAS (397/1145) FEMALE GENITAL ORG (3008/7799) ESOPHAGUS (1849/4487) HEAS&NECK (2881/6777) COLORECTUM (5666/13093)
Prevalence of p53 mutations per site (%)
Tumor site
Fig. I-1. Chemical structure of geranylgeranoic acid.
Fig. I-2. Frequency of TP53 mutations in human tumors.
adopted from IARC p53 database, R17 release, November 2013, WHO, IARC
Fig. I-3. Diverse function of p53 through multiple target genes.
adopted from Green DR and Chipuk JE: Cell, 126: 30-32 (2006)
11
Glucose G-6-P
F-6-P
F-2,6-DP F-1,6-DP
F-2,6-DP inhibition
activation
TIGAR
Primary action Secondary actionTIGAR
GA-3-P
Fig. I-4. Regulation of glycolysis pathway by TIGAR.
Fig. I-5. Warburg effect in malignant cells.
modified from Priolo C and Henske EP, Nature Medicine 19: 407–409 (2013)
Cancer cells Normal cells
12
Fig. I-6. Canonical unfolded protein responses.
Liu-Bryan R and Terkeltaub R. Nature Reviews Rheumatology 11: 35–44 (2015)
13
Chapter II
Upregulation of energy metabolism-related, p53-target TIGAR and SCO2 in HuH-7 cells by GGA treatment
Chieko Iwao Yoshihiro Shidoji
Upregulation of energy metabolism-related, p53-target TIGAR and SCO2 in HuH-7 cells with p53 mutation by geranylgeranoic acid treatment
Biomedical Research (2015) 36(6): 371-381
Molecular and Cellular Biology, Graduate School of Human Health Science, University of Nagasaki, Nagasaki, Japan
14
II-1. Abstract
Metabolic alternation in cancer cells is one of the most common characteristics that distinguish malignant cells from normal cells. Many studies have explained the Warburg hypothesis that cancer cells obtain more energy from aerobic glycolysis than mitochondrial respiration. Here, weit is shown that a branched-chain C-20 polyunsaturated fatty acid, geranylgeranoic acid (GGA), induces upregulation of the cellular protein levels of TP53-induced glycolysis and apoptosis regulator (TIGAR) and synthesis of cytochrome c oxidase 2 (SCO2) in human hepatoma-derived HuH-7 cells harboring the mutant TP53 gene, suggesting that GGA may shift an energetic state of the tumor cells from aerobic glycolysis to mitochondrial respiration. In addition, UPLC/TOF/MS-based metabolomics analysis supported the GGA-induced energetic shift, as it revealed that GGA induced a time-dependent increase in the cellular contents of fructose 6-phosphate and decrease of fructose 1,6-diphosphate. Furthermore, metabolomics analysis revealed that GGA rapidly induced spermine accumulation with slight decrease spermidine. Taken together, the present study strongly suggests that GGA may shift HuH-7 cells from aerobic glycolysis to mitochondrial respiration through the immediate upregulation of TIGAR and SCO2 protein levels.
15
II-2. Introduction
In HuH-7 cells, GGA induces cell death has so far been illustrated by at least 3 lines of evidence; 1) the chromatin condensation, 2) large-scale DNA fragmentations and nucleosomal-scale ladder formation, and 3) dissipation of mitochondrial inner membrane potential (m) [2, 3]. And recently, it is reported that GGA induces an incomplete autophagic response in HuH-7 cells, which may be linked to GGA-induced cell death [24].
In most cancer cells, the tumor suppressor TP53 gene is modified through mutations or changes in its expression. It has also been well established that human hepatoma-derived HuH-7 cells possess the mutant TP53 gene with a missense mutation of Y220C (tyrosine at a residue of 220 is converted to cysteine) in the DNA-binding domain of p53 [50]. As mentioned in chapter I, p53 is involved both in TIGAR-mediated suppression of glycolysis and in SCO2-mediated enhancement of aerobic respiration, so that cells that lack functional p53 represent a metabolic shift from aerobic respiration to glycolysis for the production of cellular energy and lower oxygen consumption by mitochondrial respiration – thereby contributing to the Warburg effect [21]. In chapter II, I am going to demonstrate that it is very important for cancer chemoprevention to induce metabolic shift from glycolysis to aerobic respiration in tumor cells.
Furthermore, it has been proposed for several times that activation of p53-dependent cell death can contribute to inhibition of cancer development at several stages during tumorigenesis [51], and the p53 pathway is expected to be absolutely crucial for effective tumor suppression in humans [52].
This may be true also in tumor cells with p53 mutation.
Hence, in chapter II, in order to clarify a molecular mechanism of GGA-induced cell death in the mutant TP53 gene-harboring cells, I focused my attention on p53-target, energy metabolism-related genes, SCO2 and TIGAR in HuH-7 cells after GGA treatment. As a result, it was found a rapid increase in the cellular levels of SCO2 and TIGAR by western blotting without upregulation of their
16
transcript levels. Furthermore, metabolomics analysis revealed GGA-induced upregulation of cellular F6-P and NADH levels and downregulation of F1,6-DP.
17
II-3. Materials and Methods
II-3-1. Materials
GGA and farnesoic acid (FA) were generous gifts from Kuraray (Okayama, Japan).
Geranylgeraniol (GGOH), D-fructose 6-phosphate (F6-P) dipotassium salt, D-fructose 1,6-bisphosphate (F1,6-DP) trisodium salt hydrate, phosphoenolpyruvic acid (PEP) monopotassium salt, and -nicotinamide adenine dinucleotide, reduced (NADH) disodium salt hydrate were all purchased from Sigma Aldrich, St. Louis, MO, USA.
II-3-2. Cell culture
Human hepatoma-derived HuH-7 cells were obtained from RIKEN BioResource Center, Tsukuba, Japan, and cultured in high-glucose Dulbecco’s modified Eagle’s medium (D-MEM; Wako Pure Chemical Industries, Osaka, Japan) supplemented with 5% fetal bovine serum (FBS; Hyclone Laboratories, ThermoFisher Scientific, Waltham, MA, USA).
II-3-3. GGA, GGOH or FA treatment
3.0 × 10⁴ cells were inoculated in 3-cm dishes (ThermoFisher Scientific, Nunc, Roskilde, Denmark) and cultured with D-MEM containing 5% FBS for 2 days, thereafter the medium was replaced with FBS-free D-MEM a day before GGA, ethanol, GGOH or FA addition. The ethanolic solution of GGA, GGOH or FA (2.5 - 50 mM) was added at a final concentration of 2.5 - 50 M. Ethanol was added as a negative control at its final concentration of 0.1% (v/v).
II-3-4. Immunoblotting
Following treatment with GGA, GGOH or FA, HuH-7 cells were lysed with cell lysis buffer (Tris-based buffered saline containing 1% Nonidet P40, 0.5% sodium deoxycholate and 0.1% SDS) containing complete mini protease inhibitor cocktail (Roche Diagnostics, Basel, Switzerland) and proteins were quantified by Bradford assay (Bio-Rad, Hercules, CA, USA). Equal amounts (2.5 or 5 μg) of protein per sample were separated by SDS-PAGE. The semi-dry blotted polyvinylidene
18
fluoride membranes (Bio-Rad) were probed with anti-TIGAR polyclonal antibody (#37910, Abcam, Cambridge, MA, USA), anti-SCO2 polyclonal antibody (#54654, Anaspec, San Jose, CA, USA), anti-COX2 monoclonal antibody (#65239, Santa Cruz, CA, USA), anti-Porin polyclonal antibody (#548, Calbiochem, Merck, Tokyo, Japan) or anti-β-actin polyclonal antibody (#4967, Cell Signaling Technology, Boston, MA, USA). Horseradish peroxidase (HRP)-labeled secondary antibody (GE Healthcare, Tokyo, Japan) was detected with Immobilon Western Chemiluminescent HRP substrate (Merck Millipore Japan, Tokyo, Japan) using an ImageQuant LAS 4000 (GE Healthcare).
II-3-5. Isolation of total cellular RNA
After drug treatment, total RNA was isolated from cells by using QuickGene RNA cultured Cell kit S (Fujifilm, Tokyo, Japan). Cells in 3-cm dishes were washed with 2 mL of phosphate-buffered saline (PBS(-)), scraped off with lysis buffer of the kit S, and transferred into each 1.5-mL tubes.
Then, the cells were homogenized by 1-mL syringe with a 21-G needle. Total cellular RNA was purified with nucleic acid isolation system, QuickGene-800 (Fujifilm). Total RNA was quantified by absorbance at 260 nm with NanoDrop® spectrophotometer ND-1000 (NanoDrop Technologies, Wilmington, DE, USA), and 260:280 nm ratio was used as index of purity. The integrity of RNA preparations was further confirmed by electrophoresis in a denaturing agarose gel containing 1%
formaldehyde and 1 × MOPS [3-(N-morpholinopropanesulfonic) acid] running buffer to detect 2 major rRNAs of 28S and 18S. After confirmation of the integrity, a preparation of total RNA was kept frozen at -20ºC until use for reverse transcription polymerase chain reaction (RT-PCR).
II-3-6. Reverse transcription for cDNA synthesis
The aliquot corresponding to 300 ng of total cellular RNA of each sample, water (PCR-grade) and random hexamer primer included in Transcriptor® first strand cDNA synthesis kit (Roche, Diagnostics, Mannheim, Germany) were incubated at 65ºC for 10 min. To the mixture 5 × Transcriptor® RT reaction buffer, Protector® RNase inhibitor, deoxynucleotide mix and
19
Transcriptor® reverse transcriptase were added and incubated at 25ºC for 10 min, at 55ºC for 30 min, at 85ºC for 5 min and at 4ºC for over 5 min.
II-3-7. Quantitative PCR with cDNA
Nucleotide sequences of the primers including the SCO2, TIGAR and 28S rRNA cDNAs are listed in Table II-1. Real-time PCR was performed with 9 µL reaction mixture containing 1 µL of primer solution (0.5 M, the stock solution was diluted by 1:10), 5 µL of 2 × DyNAmo™ Capillary SYBR® Green qPCR master mix (Finnzymes, Espoo, Finland) and 1 µL of cDNA containing solution in a PCR-capillary (Roche). The mixture was incubated in a LightCycler1.5 (Roche) under condition described in Table II-2.
Table II-1. The nucleotide sequences of each primers used for real time RT-PCR.
F: forward primer, R: reverse primer Genes
SCO2
Sequence (5’ – 3’) Primer
F R
CCAACGGTTCAGTGTATTTGTATG AGAACTAGCAGAGGAGAGAAGTAA TIGAR
R
CCCAAGACTGTTGGGTCTG GCCGTAGTAATCCGTGAAGAG F
28S rRNA
R
TTAGTGACGCGCATGAATGG TGTGGTTTCGCTGGATAGTAGGT F
20 Denature
PCR (40 cycles)
Melting
Cooling
Temperature Slope SCO2
95ºC, 600 s 95ºC, 10 s 56ºC, 20 s 72ºC, 20 s
20ºC / s
20ºC / s
95ºC, 0 s 57ºC, 15 s 98ºC, 0 s
20ºC / s
0.1ºC / s 40ºC, 30 s 20ºC / s
Denature
PCR (45 cycles)
Melting
Cooling
Temperature Slope TIGAR
95ºC, 600 s 95ºC, 10 s 56ºC, 20 s 72ºC, 15 s
20ºC / s
20ºC / s
95ºC, 0 s 57ºC, 15 s 98ºC, 0 s
20ºC / s
0.1ºC / s 40ºC, 10 s 20ºC / s
Denature PCR (40 cycles)
Melting
Cooling
Temperature Slope 28s rRNA
95ºC, 600 s 95ºC, 15 s 60ºC, 30 s
20ºC / s 20ºC / s
95ºC, 0 s 65ºC, 15 s 95ºC, 0 s
20ºC / s
0.1ºC / s 40ºC, 30 s 20ºC / s
Table II-2. The conditions of thermal cycler for real-time RT-PCR of SCO2, TIGAR and 28s rRNA.
II-3-8. Extraction of metabolites
Cells were inoculated in 9-cm dishes at 2.5 × 10⁶ cells/dish. After 0, 2, 4, 8 or 24-h incubation with 10 M GGA, the cells were quenched by replacement of the conditioned medium with 12 mL of ice-cold 0.9% (w/v) NaCl for 5 min, washed twice with 6 mL of PBS(-) and scraped off twice with 0.6 mL of PBS(-) on ice. The scraped cells were transferred into 2-mL tube by pipetting and centrifuged at 200 × g for 6 min at 0ºC. Cell pellets were re-suspended in 1 mL of ice-cold 50%
(v/v) aqueous acetonitrile (LC-MS Chromatosolv®, Fluka, Sigma-Aldrich), and the cell suspensions were agitated for 30 s by vortexing twice. The suspensions were centrifuged at 19300 × g for 8 min
21
(at 0ºC), and precipitates were used for DNA measurement with SYBR Green, and the supernatants were transferred to new 1.5-mL tubes, frozen at -80ºC, and dried on the following day using a vacuum evaporator centrifuge, VEC-100 (Iwaki, Tokyo, Japan) equipped with a vapor trap of dry-ice/ethanol. The dried extracts were re-suspended in water and incubated on ice with frequent periods (30 s × 5) with bath-type sonication. After centrifuging the cell extracts at 19300 × g for 8 min at 0ºC, the supernatants were transferred to new 2-mL tubes and stored frozen at -80ºC until analysis.
Samples were thawed out on ice and their aliquots were transferred to 0.3-mL screw-capped vial with pre-slit septum (Nihon Waters, Tokyo, Japan) filtered through a 0.2-µm pore-size membrane (Millipore Japan, Tokyo, Japan), and analyzed by ultra-performance liquid chromatography (UPLC) and quadrupole time-of-flight type mass spectrometric apparatus (XevoTM Q-Tof/MS, Nihon Waters) described below.
II-3-9. UPLC
Reversed-phase chromatographic separation was performed on a 2.1 × 100 mm ACQUITYTM UPLC® BEH C18, 1.7 µm column connected with the VanGuard pre-column (Waters). The column temperature was kept constant at 40ºC. The mobile phase consisted of water containing 0.1%
formic acid (Wako, HPLC grade) as solvent A and acetonitrile (LC-MS Chromatosolv®, Sigma-Aldrich) containing 0.1% formic acid as solvent B. The gradient duration was 20 min at a flow rate of 0.3 mL/min. From the start to 0.5 min, a volume proportion of acetonitrile in eluent was kept at 1% (A:B = 99:1, v/v) and linearly increased to 95% (A:B = 5:95) in 10 min at a constant flow rate. Then, acetonitrile (%B) was kept at 95% for 4 min. After that acetonitrile (%B) was reduced to 1% in 4 min and kept at that concentration for 5 min. A 10-L aliquot of each sample was injected automatically onto the column. The same sample was injected three times each for either negative or positive ion recordings.
22
II-3-10. Q-Tof/MS
In-line mass spectrometry was performed on a Waters XevoTM Q-Tof mass spectrometry apparatus (Waters MS Technologies, Manchester, UK), which was calibrated with sodium formate and lock-sprayed with Leu-encephalin (Nihon Waters) each time operating in either positive or negative ion modes. The nebulization gas was set to 800 L/h at a temperature of 450ºC, and the cone gas was set to 50 L/h. Source temperature was set to 120ºC. The capillary voltage and cone voltage were set to 3000 V and 30 V, respectively. The voltage of the MCP (multi-channel plate) detector was set to 2150 V. The data acquisition rate was set to 0.2 sec. Data were recorded between m/z 80 to 1000 in centroid mode.
II-3-11. UPLC/Q-Tof Mass spectrometric measurement of F6-P, F1,6-DP, PEP and NADH The authentic m/z and retention times were obtained with 10 µM each standard solution on Waters UPLC/Q-Tof/MS apparatus as shown in Table II-3. As described below, the obtained data from UPLC/Q-Tof/MS for each metabolite were transformed by calculating the validated metabolite contents on a 106 cellular basis.
Table II-3. UPLC/Q-Tof/MS measurement of F6-P, F1.6-DP, PEP and NADH.
II-3-12. Data collection, processing and multivariate statistical analysis
Raw chromatogram data of UPLC/Q-Tof/MS were initially converted to NetCDF (network common data file) formatted by Databridge in software of MarkerLynx® (Waters). The peak width
PEP
m/z [+] retention time
F6-P 283.0164 0.83
F1,6-DP 363.0023 0.83
168.9978 0.91
NADH 664.1193 1.34
23
at 50% height was set to 3 s. Other parameters were all in default settings. Detected and matched peaks with retention time and m/z, and their corresponding intensities were electronically exported to an excel table. Prior to multivariate data analysis, the raw data of each sample was normalized to total mass-signal area to correct for the MS response shift from the first injection to the last injection.
To reproduce the difference in metabolites from between GGA-treated and ethanol-treated control HuH-7 cells, multivariate statistical analysis was performed using MarkerLynx® XS software (Waters). Principal component analysis (PCA) and orthogonal partial least squares-discriminant analysis (OPLS-DA) models were constructed. Cross validation was used to calculate the number of significant components. Potential biomarkers for GGA-treated cells were selected according to variable importance in the projection (VIP) value of more than 1 (1>) in the S-plot.
Statistical analysis was carried out using PASW Statistics 18 (SPSS Japan, Tokyo, Japan).
Differences were considered statistically significant if P value was <0.05.
II-3-13. DNA measurement
The cell precipitates, mentioned above, were suspended by 10 mM Tris-HCl, pH 7.4 and 1 mM EDTA buffer (TE) 1 mL, centrifuged at 19300 × g for 8 min at 0ºC, and then the supernatants (100
L) were diluted with TE (400 L). 100 L each of the mixture was put into each well of a 96-well plate. After adding SYBR® Green solution to each well and applying the 96-well plate containing samples to a plate-shaker, DNA measurements were performed with 2030 ARVOTM X4 Multilabel Reader (PerkinElmer, Waltham, MA, USA) in duplicate in order to calculate each validated metabolite contents on cellular basis.
24
II-4. Results
II-4-1. SCO2 protein was upregulated by GGA treatment.
The SCO2 gene is one of the p53-target genes and its gene product is involved in respiratory function. First of all, I investigated time-dependent changes in the cellular levels of SCO2 protein after GGA treatment (Fig. II-1A). Treatment with 10 µM GGA led to detection of SCO2 protein at as early as 2 h and the protein became most evident at 8 h and decreased at 24 h following the treatment. Next I examined concentration dependence of GGA-induced upregulation of SCO2 protein. The cellular level of SCO2 protein was induced by 6-h incubation with GGA at as low as 2.5 µM and at concentrations of 10 - 50 µM the cellular SCO2 levels increased dramatically, although the cellular level of porin, a mitochondria-resident protein, did not show such a change (Fig. II-1B).
As described above, the SCO2 gene is one of the p53-target genes, which means p53 is able to transactivate the SCO2 gene. Hence, I measured the cellular levels of the SCO2 gene transcript to dissect a mechanism of GGA-induced upregulation of SCO2 protein. However, cellular mRNA level of the SCO2 gene was not essentially induced by addition of GGA (Fig. II-1C).
II-4-2. Specificity for GGA in SCO2 protein upregulation.
To examine chemical structure specificity for GGA to induce upregulation of the cellular SCO2 protein level in HuH-7 cells, I tested a couple of GGA-analogous compounds, GGOH and FA (chemical structures are shown in Fig. II-1D, lower part) at the same concentration of 10 µM for 16 h. As described above, GGA was repeatedly shown to induce upregulation of the cellular SCO2 protein level, whereas FA showed no activity and GGOH showed only slight activity for the upregulation (Fig. II-1D).
25
II-4-3. Specificity for SCO2 protein in GGA-induced upregulation.
SCO2 is a copper-binding protein involved in formation of the CuA center of the mitochondria-genome encoded cytochrome c oxidase II (COX2 or MT-CO2) subunit as a metallochaperone with SCO1 [53]. So, it was also interested to examine GGA-induced changes in the cellular level of COX2. As shown in Fig. II-2A, COX2 protein level was upregulated at as early as 2 h after GGA treatment and the upregulated levels were maintained until 24 h.
Cellular levels of TIGAR, another p53-target energy-metabolism related gene, were further assessed after GGA treatment. Fig. II-2B clearly showed GGA-induced immediate upregulation of TIGAR protein level, but no induction was observed in its transcript level (Fig. II-2C), as in the case of SCO2 induction with GGA.
II-4-4. Upregulation of cellular F6-P level after GGA treatment.
Next, UPLC/Q-Tof/MS analyses were performed to know how GGA-induced simultaneous upregulation of TIGAR, SCO2 and COX2 proteins, which mimic activation of p53, affects the cellular contents of glycolysis-related metabolites. As shown in Fig. II-3, it was indeed found a time-dependent significant increase in the cellular contents of F6-P and a time-dependent decrease in the cellular F1,6-DP contents in GGA-treated cells. The cellular contents of PEP fluctuated after GGA treatment. GGA-treated cells showed a time-dependent increase in the cellular content of NADH (Fig. II-3).
II-4-5. Metabolomics changes in GGA-treated cells.
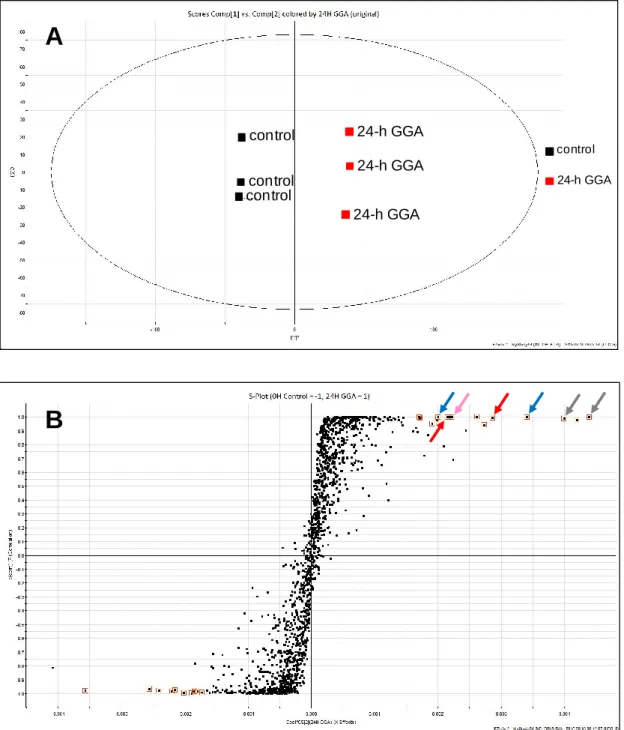
Then, global metabolites were compared in between control and GGA-treated cells. Although total positive ion chromatograms of the cellular metabolites were apparently similar between 24-h GGA-treated cell extracts and 0-h control cell extracts (Fig. II-4), the OPLS-DA score plot clearly distinguished the GGA-treated group from control group in triplicate (Fig. II-5A). The S-plot analysis was performed to find potential biomarkers for GGA effects. As shown in Fig. II-5B, S-plots apparently provide a visual representation of biomarker candidates for both groups.
26
Especially, spots marked with red square mean important variables contributed for two-group discrimination. In the first quadrant (upper right), spots in a red square were selected as potent markers for GGA-treated cells. On the other hand, the third quadrant (lower left) included several spots in a red square as potent markers lost or decreased in GGA-treated cells. These markers selected by red squares show high score of reliability/responsiveness in the S-plot. Although all of these selected spots have been dropped into database survey connected to Internet (KEGG: Kyoto Encyclopedia of Genes and Genomes <http://www.genome.jp/kegg/>, HMDB: Human Metabolome Database <http://www.hmdb.ca/>, and ChemSpider <http://www.chemspider.com/>) in order to identify each metabolite, which is still in the middle of work identification of these biomarkers.
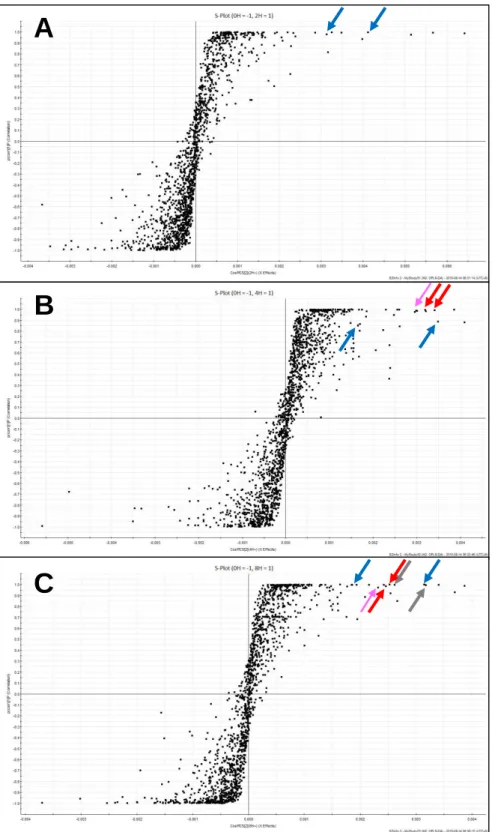
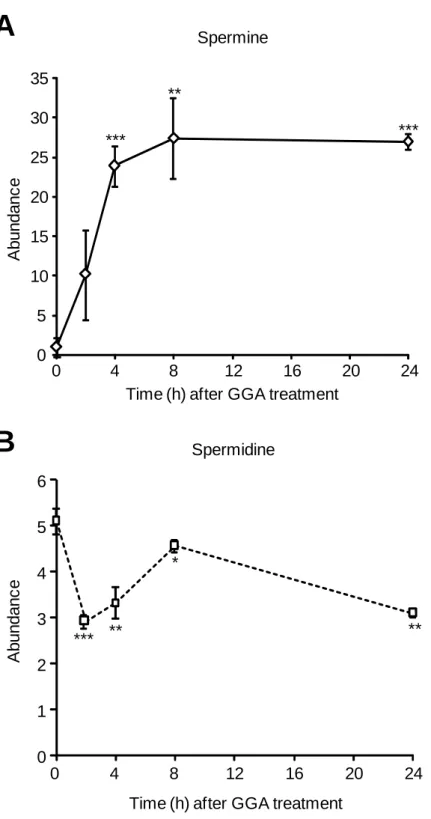
Among the potent biomarkers suggested in the present study, a spot of 203.2221, indicated by a pink arrow in Fig. II-5B, was identified as spermine and a spot of spermine was detected as a potent biomarker also in 2 other pair-wise comparisons between 0-h vs 4-h and between 0-h vs 8-h metabolites (pink arrows indicate a spot of spermine in Fig. II-6). Therefore, when the signal intensity of the spermine peak area was plotted along to the time after treatment with GGA, GGA was found to rapidly induce spermine (Fig. II-7A). Then, a spot of spermidine, a direct precursor polyamine intermediate of spermine, was searched by its protonated monoisotopic mass (m/z = 146.1657). As shown in Fig. II-7B, although GGA upregulated the cellular content of spermine, the cellular content of spermidine rather decreased after GGA treatment.
27
II-5. Discussion
In chapter II, it has been found that GGA immediately upregulates the cellular protein levels of the
SCO2 and TIGAR genes, both of which are p53-target genes in HuH-7 cells. Furthermore, GGA-induced metabolic shift from glycolysis to aerobic respiration found in chapter II is very important for cancer chemoprevention.
Interestingly, GGA-induced upregulation of the SCO2 and TIGAR genes was found at their protein level but not at their mRNA level by GGA treatment. I failed to detect any significant upregulation of these mRNA levels. Therefore, the upregulatory effects of GGA on p53-targeted genes of SCO2 and TIGAR should be post-transcriptional.
Prior to further investigation of a molecular mechanism how GGA induces upregulation of the SCO2 and TIGAR genes at their protein level, it was decided to survey metabolic alterations
associated with GGA-induced upregulation of TIGAR and SCO2 protein. At first, pair-wise comparison of several metabolites in metabolome was performed and then it was further validated by quantitative measurement on UPLC/Q-Tof/MS analysis by using each authentic standard compounds. As a result, it was found GGA-induced time-dependent increase of the cellular F6-P level and inversely decrease of the cellular F1,6-DP level, which is consistent with GGA-induced upregulation of TIGAR protein. In other words, these metabolic changes strongly suggest that GGA-induced TIGAR protein was expectedly active to decrease the cellular content of F1,6-DP through its bisphosphatase activity and consequently increase the cellular content of F6-P, indicating that GGA really works as suppressive to glycolysis through upregulation of TIGAR protein level. As described in General Introduction section, TIGAR protein is known to inhibit glycolysis by catalyzing the hydrolysis of both F2,6-DP and F1,6-DP to F6-P [17, 19].
Furthermore, a pair-wise comparison of metabolomes and the following validation by UPLC/Q-Tof/MS analysis revealed another important finding of GGA-induced upregulation of the cellular NADH level (Fig. II-3). In the present study, I did not analyze the subcellular distribution of NADH so that I am not aware how NADH was increased after GGA treatment, but one can
28
easily speculate that GGA might enhance aerobic respiration, because GGA rapidly and efficiently upregulated both of the nuclear SCO2 and the mitochondrial COX2 gene products as shown in the present study. Mitochondrial electron transfer chain itself is NADH-consuming system, but it is highly linked to citrate cycle, which is an efficient NADH-producing system. Hence, I speculated that GGA might shift cellular energy metabolism from glycolysis to citrate cycle-aerobic respiration system. In this regard, it is reported important findings that GGA rapidly induces hyperproduction of mitochondrial superoxide and consequent dissipation of m [24]. These previous observations, apparently contradictory to the enhanced aerobic respiration, might have better describe GGA-induced accumulation of the cellular NADH as well as GGA-induced cell death in HuH-7 cells.
It is worth noting that metabolomics analysis is very powerful to identify a potential biomarker without any prediction. In chapter II, global comparison of the cellular metabolites in HuH-7 cells after GGA treatment unexpectedly revealed that GGA rapidly and time-dependently upregulated the cellular content of spermine with significant decrease of spermidine. In general, polyamines such as spermine, spermidine and ornithine affect a plethora of cellular processes including transcription, translation, gene expression, autophagy and stress resistance and the regulation of polyamine levels is highly critical for the cell [54]. Although spermidine has an essential and unique role as the precursor for hypusine, which is an unusual amino acid and is found in post-translationally modified elongation factor eIF5A, no unique role for spermine has so far been identified unequivocally [55].
Recently, chemically induced oxidative stress such as tert-butylhydroxyquinone or hydrogen peroxide treatment in HuH-7 cells was reported to increase spermine level in 18 h by activating the transcription of ornithine decarboxylase (ODC) and spermidine/spermine-N1-acetyltransferase (SSAT) [56]. As mentioned above, GGA also induces superoxide hyperproduction in HuH-7 cells [24], hence, one can easily speculate that GGA may increase the spermine content via gene activation of these polyamine synthetic enzymes. However, the oxidative stress-upregulated
29
expression of the ODC and SSAT genes brought to increase also spermidine level [56]. Therefore, GGA-induced specific upregulation of spermine (spermidine was inversely downregulated after GGA treatment) may have a different mechanism from oxidative stress-induced upregulation of polyamines.
In summary, first GGA induced upregulation of the TIGAR gene, which might inhibit the glycolysis in HuH-7 cells with p53 mutation. Second GGA also increased the SCO2 gene expression, which might enhance aerobic respiration. So I speculated GGA might repair the Warburg effect by inhibiting glycolysis and also enhancing oxygen respiration or shifting back to normal mode of energy metabolism in the p53-mutated cells. Third UPLC/Q-Tof/MS-based metabolomics analyses partially support this concept and have provided a working hypothesis that GGA may perturb polyamine metabolism.
30
A
SCO2
0 2 4 6 8 24 (h) Time after GGA treatment
-Actin
B
0 2.5 5 10 25 50 (M)
SCO2
Porin
Concentration of GGA in medium
D
Control GGA GGOH FA 16 h after treatmentGGA GGOH
FA SCO2
Porin 0 0.2 0.4 0.6 0.8 1 1.2 1.4 1.6
0 4 8 12 16 20 24
Time (h) after GGA treatment SCO2/ 28S mRNA (ratio to 0-h control)
C
31
Fig. II-1. Upregulation of the cellular levels of SCO2 protein in HuH-7 cells by GGA treatment.
(A) HuH-7 cells were treated with or without 10 µM GGA for 2, 4, 6, 8 and 24 h. Whole-cell
lysates were prepared and SCO2 protein levels were analyzed by western blotting. β-Actin was used as a loading control. (B) HuH-7 cells were treated with or without GGA (2.5-50 µM) for 6 h.
Whole-cell lysates were prepared and SCO2 levels were analyzed by western blotting. Porin was used as a loading control. (C) Time course of changes in the cellular mRNA levels of SCO2 gene relative to 28S rRNA level after GGA treatment. (D) HuH-7cells were treated with or without 20 µM of GGA, GGOH or FA for 16 h, and SCO2 levels were analyzed by western blotting. Porin was used as a loading control.
32
Fig. II-2. GGA-induced upregulation of the cellular COXII and TIGAR protein levels.
HuH-7 cells were treated with or without 10 µM GGA for 2, 4, 6, 8 and 24 h. Whole-cell lysates were prepared, and then COX2 (A) and TIGAR (B) levels were analyzed by western blotting.
Either porin or β-actin was used as a loading control. (C) Time course of changes in the cellular mRNA level of TIGAR gene relative to 28S rRNA level after GGA treatment.
COX2
0 2 4 6 8 24 (h) Time after GGA treatment
Porin
B
TIGAR
-Actin
0 2 4 6 8 24 (h) Time after GGA treatment
A
0 0.2 0.4 0.6 0.8 1 1.2 1.4
0 4 8 12 16 20 24
Time (h) after GGA treatment TIGAR/ 28S mRNA (ratio to 0-h control)
C
33
Fig. II-3. Metabolic alterations of glycolysis intermediates after GGA treatment.
HuH-7 cells were treated with or without 10 µM GGA for 2, 4, 8 and 24 h. Pair-wise comparison of each metabolites shown in Fig. II-3 in metabolomics was performed and then the cellular concentrations of each metabolites were further validated by quantitative measurement on UPLC/Q-Tof/MS analysis by using each authentic standard compounds. Columns show average concentrations (nmol/10⁶ cells) ±SD (n=3) per cellular basis. All the P values were evaluated by t-test. *, P<0.05, **, P<0.01, ***, P<0.005.
0 0.5 1 1.5 2 2.5 3 3.5 4 4.5 5
0 2 4 8 24
0 1 2 3 4 5
0 2 4 8 24
F6-P
average concentration (nmol/10⁶cells)
Time (h) after GGA treatment
PEP NADH
***
***
**
75 80 85 90 95 100
0 2 4 8 24
75 80 85 90 95 100
0 2 4 8 24
Time (h) after GGA treatment average concentration (nmol/10⁶cells)
F1,6-DP
**
***
0 0.5 1 1.5 2 2.5
0 2 4 8 24
0 0.5 1 1.5 2 2.5
0 2 4 8 24
Time (h) after GGA treatment average concentration (nmol/10⁶cells)
**
0 0.5 1 1.5 2 2.5
0 2 4 8 24
0 0.5 1 1.5 2 2.5
0 2 4 8 24
average concentration (nmol/10⁶cells)
Time (h) after GGA treatment
***
**
34
Fig. II-4. Total positive ion chromatograms of the cellular metabolites were apparently similar between 24-h GGA-treated cell extracts and 0-h control cell extracts.
Representative UPLC/Q-Tof/MS total positive ion chromatograms of 24-h GGA-treated HuH-7 cell extracts (A) and 0-h control cell extracts (B).
B
A
35
B A
control
control control
control 24-h GGA
24-h GGA 24-h GGA
24-h GGA
Fig. II-5. OPLS-DA multivariate analyses of the data from ESI positive ion mode of UPLC/Q-Tof/MS.
(A) Score plot. Black square shows 0-h control and red square shows 24-h GGA treated cells. (B) S-plot. Potential biomarkers for GGA-treated cells were selected according to variable importance in the projection (VIP) value of more than 1 (1>) in the S-plot and are marked by red squares. A pink arrow indicates a spot of spermine; blue arrows indicate the potential biomarkers upregulated and identified at 2, 4, 8 and 24 h; red arrows at 4, 8 and 24 h; gray arrows at 8 and 24 h after GGA treatment.
36
Fig. II-6. OPLS-DA S-plots.
0-h control vs 2-h GGA treated (A), 0-h control vs 4-h GGA treated (B), 0-h control vs 8-h GGA treated (C). A pink arrows indicates a spot of spermine; blue arrows indicate the potential biomarkers upregulated and identified at 2, 4, 8 and 24 h; red arrows at 4, 8 and 24 h; gray arrows at 8 and 24 h after GGA treatment.
A
B
C
37
Fig. II-7. Rapid upregulation of the cellular spermine level after GGA treatment in HuH-7 cells.
From pair-wise comparison of 24-h GGA-treated metabolomes shown in Fig. II-5 and 2, 4 and 8-h metabolomes shown in Fig. II-6 against 0-h control metabolome was performed with the protonated monoisotopic mass of 203.2236 for spermine (A) and 146.1657 for spermidine (B) and then the signal intensity of each peak area was plotted against time after GGA treatment. *, P<0.05, **, P<0.01, ***, P<0.005.
0 5 10 15 20 25 30 35
0 4 8 12 16 20 24
Time (h) after GGA treatment
Abundance
Spermine
0 1 2 3 4 5 6
0 4 8 12 16 20 24
Time (h) after GGA treatment
Abundance
Spermidine
**
***
*
***
*** ** **
B
A
38
Chapter III
Induction of nuclear translocation of mutant cytoplasmic p53 by GGA in HuH-7 cells
Chieko Iwao Yoshihiro Shidoji
Induction of nuclear translocation of mutant cytoplasmic p53 by geranylgeranoic acid in a human hepatoma cell line.
Scientific Reports (2014) 4: 4419 / DOI: 10.1038/srep04419
Molecular and Cellular Biology, Graduate School of Human Health Science, University of Nagasaki, Nagasaki, Japan