Title 角筒絞り成形における焼付き現象に関する研究( 本文(Fulltext) )
Author(s) YANG, MINGXU
Report No.(Doctoral Degree) 博士(工学) 甲第449号 Issue Date 2014-03-25 Type 博士論文 Version ETD URL http://hdl.handle.net/20.500.12099/49018 ※この資料の著作権は、各資料の著者・学協会・出版社等に帰属します。
1
Galling behavior in square cup drawing
2 1 ... 1 1.1 ... 1 1.1.1 ... 1 1.1.2 ... 2 1.2 ... 8 1.2.1 ... 9 1.2.2 ... 10 1.3 ... 11 1.4 ... 12 2 ... 13 2.1 ... 13 2.1.1 ... 13 2.1.2 ... 13 2.2 ... 16 2.2.1 ... 16 2.2.2 ... 16 2.3 ... 19 2.3.1 ... 19 2.3.2 ... 21
3 2.3.3 ... 26 2.4 ... 27 2.4.1 ... 27 2.4.2 ... 29 2.5 ... 34 3 FEM ... 36 3.1 FEM ... 36 3.2 ... 38 3.3 ... 39 3.3.1 ... 39 3.3.2 ... 42 3.4 ... 45 3.5 ... 46 3.6 ... 41 3.6.1 ... 49 3.6.2 ... 52 3.7 ... 54 3.8 ... 58 4 ... 59 4.1 FEM ... 59
4 4.2 FEM ... 59 4.3 ... 65 4.3.1 ... 65 4.3.2 ... 68 4.4 ... 70 5 ... 71 5.1 ... 71 5.2 ... 71 5.3 ... 75 5.4 ... 80 5.5 ... 81 6 ... 83 ... 86 ... 88 ... 89
5
1
1.1 1.1.1 1) 2) Block ( ) 3) 4) 5)~13) Fig.1.16
Rz
Fig.1.1
Fig.1.1 Galling on product in sheet metal forming
1.1.2
7
16),17)
18),19)
Fig.1.2 Effect of roll roughness on maximum temperature in roll bite
Reduction /% M ax im um t em pe ra tu re i n ro ll b it e /
8
Fig.1.3 Shape of beginning point of heat streak
Figs.1.4 1.7 20)~23)
9
Fig.1.4 Strip tension-compression type friction test
Fig.1.5 U-bending type friction test
Die Die N F Strip Die Die N Strip Blank holder Blank holder Punch
10
Fig.1.6 Ironing type friction test
Fig.1.7 Draw bead type friction test
T Strip Die N F Strip Bead N F
11 Fig.1.4 MPa Fig.1.5 Fig.1.6 Fig.1.7 (1) (2) (3) (1) (2) (3) (4) (5) (1) (2)
12 (3) 24) l p (1.1) 25) p l = C
(1.1) C 1.2
13 1.2.1 CO2 100kg 1km/l 26) 3/4 90 300MPa 440MPa 1470MPa 27) Fig.1.8 28)
14
Fig.1.8 Fact and forecast of high strength steel rate for automobile bodies
FEM 29) 1.2.2 30)~32) H ig h St re ng ht h st ee lo r at e / Year
15 33) 34) ( ) 35) 36) 1.3 36)
16 1.4 1 2 3 FEM 4 3 FEM 5 FEM 6
17
2
2.1 2.1.1 Fig.2.1 Fig.2.2 2.1.2 Fig.2.318 A-A section
Fig.2.1 Illustration of square cup drawing test
19
(a) Blank shape (b) Drawn cup
Fig.2.2 Drawn cup
Fig.2.3 Thickening during drawing
Bent zone Drawn zone Drawn zone 54 54 4-R15 t = 2.0 mm
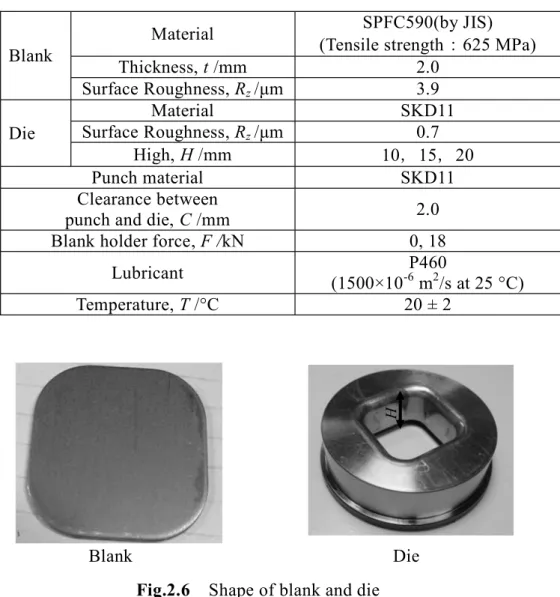
20 2.2 2.2.1 AC H1F110 Fig.2.4 Fig.2.5 Fig.2.6 Fig2.7 3 2.2.2 Table 2.1 2.0mm SPFC590 SKD11 Rz R 5.0mm H 10 15 20mm 3 C 2.0mm 0 18kN 2 P460 40mm/s
21
Fig.2.4 General view of servo-press
Fig.2.5 General view of drawing tools
Blank holder Punch Die
22
Table 2.1 Experimental conditions
Blank Die
Fig.2.6 Shape of blank and die
Fig.2.7 Surface appearance of blank
Blank
Material SPFC590(by JIS)
(Tensile strength 625 MPa)
Thickness, t /mm 2.0 Surface Roughness, Rz 3.9 Die Material SKD11 Surface Roughness, Rz 0.7 High, H /mm 10 15 20 Punch material SKD11 Clearance between
punch and die, C /mm 2.0
Blank holder force, F /kN 0, 18
Lubricant P460
(1500×10-6 m2/s at 25 °C)
23 2.3 2.3.1 H = 20mm 0 18kN Fig.2.8 F = 0kN F = 18kN (a) F = 0kN (b) F = 18kN
Fig.2.8 Galling position on die and drawn cup surface
Figs.2.9~2.11
24
Fig.2.9 Galling on die and drawn cup surface (H = 20mm, F = 0kN)
+
Fig.2.10 Galling on die and drawn cup surface (H = 15mm, F = 0kN)
Drawn cup Die N = 5 N = 3 N = 1 Drawn cup Die N = 5 N = 3 N = 1 N = 10
25
Fig.2.11 Galling on die and drawn cup surface (H = 10mm, F = 0kN)
2.3.2 Fig.2.12 H = 20mm F = 0kN N = 1 4 Fig.2.13 A B R C R D Drawn cup Die N = 5 N = 3 N = 1 N = 10
26
Fig.2.12 Drawing load curve (H = 20mm F = 0kN N=1)
(a) Point A in Fig. 2.12 (b) Point B in Fig. 2.12
(c) Point C in Fig. 2.12 (d) Point D in Fig. 2.12
Fig.2.13 Deformation state of blank during drawing
0 20 40 60 80 100 120 0 10 20 30 40 D ra w in g lo ad /k N Punch stroke /mm A B C D
27 Fig.2.14 F = 18kN N = 1 3 1 85kN 2 100kN Fig.2.15 N = 1 F = 0kN H H Figs.2.10~2.12 1 85kN 2 100kN Fig.2.16 F = 0kN 1 85kN 2 105kN F = 18kN 1 105kN 2 100kN Fig.2.17 1 2 Fig.2.13 D 2 Fig.2.18(a) Fig.2.13 D Fig.2.18(b) F = 0kN F = 18kN 2 2 2
28
Fig.2.14 Drawing load with different drawing cycle (H = 20mm, F =0kN)
Fig.2.15 Drawing load with different die height (N = 1, F =18kN)
0 20 40 60 80 100 120 0 10 20 30 40 D ra w in g lo ad /k N Punch stroke /mm H20 H15 H10 0 20 40 60 80 100 120 0 10 20 30 40 D ra w in g lo ad /k N Punch stroke /mm N = 1 N = 3 H = 10mm H = 15mm H = 20mm N = 3 N = 1
29
Fig.2.16 Drawing load with different blank holder force(H = 20mm, N = 1)
Fig.2.17 Drawing load with the different blank holder force(Blank holder force is
cut off) 0 20 40 60 80 100 120 0 10 20 30 40 D ra w in g lo ad /k N Punch stroke /mm F=0 F=18 F = 0kN F = 18kN 0 20 40 60 80 100 120 0 10 20 30 40 D ra w in g lo ad B la nk h ol de r fo rc e /k N Punch stroke /mm F=18,F-18 F=0 F = 18kN F = 0kN
30
(a) (b)
Fig.2.18 Shape of drawn cup of (d) in Fig.2.13
2.3.3
Fig.2.19
Fig.2.19 Schematic image of galling position and growing process
Drawn zone Drawn zone Bent zone Drawn zone Drawn zone Bent zone
31 2.4 2.4.1 KEYENCE VHX-600 S-3000N H = 15mm F = 0kN N = 3 Fig.2.20 Fig.2.21 Fig.2.22 N=1 N=1 2 3 Fig.2.23 (a) (b) 1mm (B ) (H ) Fig.2.20 Microscope
32
Fig.2.21 Scanning electron microscope
Fig.2.22 Observation point of drawn cup(N=3) Dull surface
Glossy surface Galling
33 (a)
(b)
Fig.2.23 Observation point of die
2.4.2 Figs.2.24~2.28 Fig.2.24 Fig.2.25 Fig.2.26 N = 1 Fig.2.27 N = 2 Fig.2.28 N = 3 N = 1 A1 A4 A2 A3
34
N = 2 3
Fig.2.24 Dull surface
35
Fig.2.26 Galling position on drawn cup (N = 1)
Fig.2.27 Galling position on drawn cup (N = 2)
Fig.2.28 Galling position on drawn cup (N = 3)
Galling
36 Figs.2.29~2.32 Fig.2.29 A1 SEM Fig.2.30 SEM A2 SEM Fig.2.31 A3 SEM Fig.2.32 A4 SEM 1000 times 3000 times
Fig.2.29 Surface appearance of die (A1)
37
1000 times 2000 times
Fig.2.30 Surface appearance of die (A2)
1000 times 3000 times
Fig.2.31 Surface appearance of die (A3)
Drawing direction
38
1000 times 2000 times
Fig.2.32 Surface appearance of die (A4)
2.5 (1) 1. ( ) R (2) (3) Drawing direction
39 (4)
40
3
FEM
FEM 3.1 FEM FEM DEFORM-3D 8 1/8 Fig.3.1 t = 2.0mm 590MPa = 1000( +0.017)0.2MPa -Fig.3.2 C 2.0mm H = 20mm F = 0 18kN 40mm/s41
Before drawing After drawing
Fig.3.1 Simulation model
Fig.3.2 Stress-Strain curve
Strain St re ss / M P a
42 3.2 0.03 0.06 0.12 FEM Fig.3.3 FEM = 0.06 = 0.12 0.06
Fig.3.3 Drawing load by FEM simulation and experiment(F = 0kN)
Punch stroke /mm D ra w in g lo ad / kN = 0.06 = 0.12 Experiment = 0.03
43 3.3 3.3.1 FLIR SC7500S 320 256 Fig.3.4 19.7 19.6 43mm 0.01s/ FEM
Fig.3.4 Temperature measurement by thermo-camera
25 50 75 100 125 150
=0.3 Fig.3.5
44
x
Fig.3.5 Dull surface zone and glossy surface zone on drawn cup surface
Fig.3.6 Correction graph for dull surface zone
Glossy surface zone Dull surface zone
45
Fig.3.7 Correction graph for glossy surface zone
Fig.3.8 Fig.3.8 (b)
Fig.3.8 (b)
Fig.3.9
Fig.3.8 Projection area on drawn cup and thermography
46
Fig.3.9 Temperature distribution at the moment of drawn cup sliding out from die
3.3.2 FEM 20W/(m2 K) 11000W/(m2 K) ( ) 5000 11000 15000 20000W/(m2 K) Figs.3.10~13 20000 W/(m2 K) . / 1 2 3 4 5 22 p d c b a
47
Fig.3.10 Temperature distribution by FEM simulation at the moment of drawn cup
sliding out from die( = 5000W/(m2 K))
Fig.3.11 Temperature distribution by FEM simulation at the moment of drawn cup
sliding out from die( = 11000W/(m2 K))
/ 1 2 3 4 5 22 p d c b a Higher than 100 / 1 2 3 4 5 22 p d c b a Higher than 100
48
Fig.3.12 Temperature distribution by FEM simulation at the moment of drawn cup
sliding out from die( = 15000W/(m2 K))
Fig.3.13 Temperature distribution by FEM simulation at the moment of drawn cup
sliding out from die( = 20000W/(m2 K))
/ 1 2 3 4 5 22 p d c b a Higher than 100 1 2 3 4 5 22 p d c b a /
49 3.4 DEFORM-3D Fig.3.14 Fig.3.15 4 R R 2 0.5 mm 0.5 mm 4 R 0.5 mm 10 R 4 10
Fig.3.14 Measurement points on die surface
Fig.3.15 Measurement points on drawn cup surface
Drawing zone R shoulder of drawing zone Bending zone R shoulder of bending zone Bent zone Drawn zone
50
Fig.3.16
D4
Die Drawn cup
Fig.3.16 Projective figures on die and drawn cup surface
3.5 Fig.3.17 D4 1 2 3 4 5 20 P D C B A 1 2 3 4 5 22 p d c b a
51
(a) Variation curve of contact pressure at D4 point
(b) Variation curve of temperature at D4 point
Fig.3.17 Definition of tribological parameters
Sliding distance
Friction work
Maximum pressure
52 FEM 1 0.01mm 20 (0.2mm) 4700 n n1,n20, n4700 p W L T max pmax (3.1) . pmax =Max(pni) i (1,20,40,∙∙∙4700)
(3.1) W (3.2) (3.2) F p A S R (3.3) 0.87mm 0.2mm (3.3) (3.3) L 1 0 N L (3.4)
53 L = N Sn
(3.4) Tmax (3.5) Tmax = Max(Tni) i (1,20,40,∙∙∙4700)
(3.5) 3.6 3.6.1 Figs.3.18~3.21 Fig.3.18 R Fig.3.19 Fig.3.20 R Fig.3.21
54
Fig.3.18 Maximum pressure at measurement points on die surface
Fig.3.19 Friction work at measurement points on die surface
1 2 3 4 5 20 P D C B A / G P a Galling position 1 2 3 4 5 20 P D C B A / G P a × m m Galling position
55
Fig.3.20 Sliding distance at measurement points on die surface
Fig.3.21 Maximum temperature at measurement points on die surface
1 2 3 4 5 20 P D C B A / m m Galling position 1 2 3 4 5 20 P D C B A / Galling position
56 3.6.2 Figs.3.22~3.25 Fig.3.22 Fig.3.23 Fig.3.24 Fig.3.25
Fig.3.22 Maximum pressure at measurement points on drawn cup surface
1 2 3 4 5 p d c b a / G P Galling position
57
Fig.3.23 Friction work distribution at measurement points on drawn cup surface
Fig.3.24 Sliding distance at measurement points on drawn cup surface
1 2 3 4 5 22 p d c b a / G P a m m Galling position 1 2 3 4 5 22 p d c b a / m m Galling position
58
Fig.3.25 Maximum temperature at measurement points on drawn cup surface
3.7 g17 Fig.3.25 g17 Fig.3.26 R Fig.3.27 g17 1 2 3 4 5 22 p d c b a / Galling position
59
Fig.3.26 Variations of wall thickness and temperature at point g17 during forming
for square blank
60 Fig.3.26
Fig.3.28
g17 Fig.3.25
Fig.3.28 Wall thickness in history deformation at measurement points on drawn
cup
61
Fig.3.29 Variations of contact pressure and temperature at point g17 during
forming for square blank
g17 21mm 21mm Fig.3.30 g17 R g17 R R
62
Fig.3.30 Forming state of cup at punch stroke 21mm
3.8
F E M
(1)
63
4
4.1 FEM Fig.4.1 2 Fig.4.2 Fig.4.3 H 10mm 15mm 20mm 3Fig.4.1 Blank shape of octagon and tricontadigon (b) Tricontadigon
54 54 (0, 0) (27, 0) (25.3, 10.3) (26.2, 6.7) (22.7, 14.6) (19.1, 19.1) y x (a) Octagon 54 54 4-C15
64
(a) Octagon (b) Tricontadigon
Fig.4.2 Drawn cup of otagon and tricontadigon
Fig.4.3 Die height
4.2 FEM FEM Fig.4.4 Fig.4.5 p16 160 n15 160 Fig.4.6 Fig.4.7 p16 n15 H
65
Fig.4.4 Maximum temperature in history deformation at measurement points on
octagon drawn cup surface
Fig.4.5 Maximum temperature in history deformation at measurement points on
Tricontadigon drawn cup surface
1 2 3 4 5 18 p d c b a / p16 1 2 3 4 5 15 p d c b a / n15
66
Fig.4.6 Maximum wall thickness in history deformation at measurement points on
octagon drawn cup surface
Fig.4.7 Maximum wall thickness in history deformation at measurement points on
Tricontadigon drawn cup surface
1 2 3 4 5 18 p d c b a /mm p16 1 2 3 4 5 15 p d c b a /mm n15
67
p16 n15 - Fig.4.8 Fig.4.9
Fig.4.10 Fig.4.11
Fig.4.8 Variations of wall thickness and temperature at point p16 during forming
for octagon blank
Contact exit Punch stroke /mm W al l t hi ck ne ss / m m T em pe ra tu re /
68
Fig.4.9 Variations of wall thickness and temperature at point n15 during forming
for tricontadigon blank
Fig.4.10 Variations of contact pressure and temperature at point p16 during
forming for octagon blank
Contact exit Contact exit Punch stroke /mm Punch stroke /mm W al l t hi ck ne ss / m m T em pe ra tu re / T em pe ra tu re / C on ta ct p re ss ur e /G P a
69
Fig.4.11 Variations of contact pressure and temperature at point n15 during
forming for tricontadigon blank
g17 p16 n15 4.3 4.3.1 2 0 FEM Figs.4.12 4.14 Contact exit Punch stroke /mm T em pe ra tu re / C on ta ct p re ss ur e /G P a
70
Fig.4.15 4.17
Fig.4.12 Galling position on drawn cup for square blank (F = 0 kN)
Fig.4.13 Galling position on drawn cup for octagon blank (F = 0 kN)
0.3 mm1 mm
0.3 mm 1 mm
71
Fig.4.14 Galling position on drawn cup for tricontadigon blank (F = 0 kN)
Fig.4.15 Galling position on die for square blank (F = 0 kN)
Fig.4.16 Galling position on die for octagon blank (F = 0 kN)
0.3 mm 1 mm
1 mm 1 mm
72
Fig.4.17 Galling position on die for tricontadigon blank (F = 0 kN)
4.3.2
Fig.4.18
73
Fig.4.18 Relationship between galling starting drawing cycle and die height
8)
F = 12 kN F = 0 kN
74 Figs.4.12 4.14
4.4
(1)
75
5
5.1 FEM 5.2 SPFC590 = 1000( +0.017)0.2MPa F 800 1000 1200 1500 Fig.5.1 FEM Figs.5.2~5.5Fig.5.1 Stress-Strain curve at each F value
F =800 F =1000 F =1200 F =1500 St re ss / M P a Strain
76
Fig.5.2 Maximum temperature at measurement points on drawn cup surface
for F = 800MPa
Fig.5.3 Maximum temperature at measurement points on drawn cup surface
for F = 1000MPa g17 1 2 3 4 5 22 p d c b a / g17 1 2 3 4 5 22 p d c b a /
77
Fig.5.4 Maximum temperature at measurement points on drawn cup surface
for F = 1200MPa
Fig.5.5 Maximum temperature at measurement points on drawn cup surface
for F = 1500MPa g17 1 2 3 4 5 22 p d c b a / g17 1 2 3 4 5 22 p d c b a / Higher than 200
78 590 F = 1000MPa 140 160 F = 800MPa 120 44 59 F = 1200MPa F = 1500MPa 98 F Fig.5.6
Fig.5.6 Relationship between maximum temperature and plastic coefficient
M ax im um t em pe ra tu re / F value /MPa
79
5.3
0.03 0.06 0.12 0.18
Figs.5.7~5.10
0.18
Fig.5.7 Maximum temperature at measurement points on drawn cup surface for
friction coefficient = 0.03 h18 1 2 3 4 5 22 p d c b a /
80
Fig.5.8 Maximum temperature at measurement points on drawn cup surface for
friction coefficient = 0.06
Fig.5.9 Maximum temperature at measurement points on drawn cup surface for
friction coefficient = 0.12 f16 1 2 3 4 5 22 p d c b a / g17 1 2 3 4 5 22 p d c b a /
81
Fig.5.10 Maximum temperature at measurement points on drawn cup surface for
friction coefficient = 0.18 p21 a14 Fig.5.11 Fig.5.12 p21 Fig.5.13 a14 Fig.5.14 e15 1 2 3 4 5 22 p d c b a /
82
Fig.5.11 Maximum wall thickness at measurement points on drawn cup surface for
each friction coefficient
Fig.5.12 Maximum wall thickness at measurement point p21 on drawn cup surface
for each friction coefficient
Friction coefficient Friction coefficient M ax im um w al l th ic kn es s /m m M ax im um w al l t hi ck ne ss / m m
83
Fig.5.13 Maximum wall thickness at measurement point a14 on drawn cup surface
for each friction coefficient
Fig.5.14 Variations in contact pressure at measurement point a14 on drawn cup
surface for different friction coefficient = 0.03 = 0.06 = 0.12 = 0.18 M ax im um w al l t hi ck ne ss / m m Friction coefficient Punch stroke /mm C on ta ct p re ss ur e /G pa
84 5.4 Fig.5.15 g17 2.63mm g17 G G C 0. 2 mm G
85
Fig.5.16 f16
152 169 17
Fig.5.16 Maximum temperature at measurement points on drawn cup surface for a
modified die shape
5.5 FEM (1) 44 59 98 f16 1 2 3 4 5 22 p d c b a /
86 (2)
87
6
1 2 (6) ( ) R (7) (8) (9) (10) 3 FEM88 (3) (4) 4 3 FEM (3) (4) 5 FEM (4) 440 590 980 (5) (6) 6
90
(1) (1987) 35-36
(2) (1990) 35-36
(3) Block H. Proc. General Discussion on Lubrication and Lubricants IME 2(1937) 14-15
(4) Block H. Proc. International Conference Gearing IME (1958) 144-145
(5) 36-281(1970) 119-125 (6) 44-382(1978) 2089-2098 (7) 43-376(1977) 4670-4678 (8) 44-383(1978) 2536-2546 (9) 44-383(1978) 2547-2557 (10) 24-9(1979) 573-578 (11) 46-408(1980) 953-961 (12) 47-423(1981) 1518-1529 (13) (2001) 203-204
(14) J. L. Andreasen N. Bay and L. De Chiffre International Journal of MachineTools and Manufacture Volume 38 Issues 5-6 (1998) pp. 503-510 (15) K. P. Rao and J. J. Wei Wear Volume 249 Issues 1-2 (2001) pp.85-92 (16)
67-14(1981) 2152-2161
(17) 41-468(2000) 59-63
(18) 13-141(1972) 729-743
(19) E.P. Unksov An Engineering Theory of Plasticity (1961) 107 Butterworth.
(20) 19-204(1978)
91
(21) 17-190(1976) 867-874
(22) 47-417(1981) 644-652
(23) ADDRG Sheet Metal Industry 54(1977) 147
(24) 57 (1982) 129 (25) (1993) 23-24 (26) 2000 (27) 46-534 (2005) 585-589 (28) 46-534 (2005) 8-11 (29) 154(2013) 5-10 (30) 43-492(2002) 3-10 (31) 46-7(2001) 7 (32) 46-528(2005) 4-10 (33) (1998) (34) 46-528(2005) 11-14 (35) 421(2001) 24 (36) 39-12(2001) 24-30
92
1 Tribological peculiarity of galling position in square cup drawing (Tomoki Soejima, Mingxu Yang, Zhigang Wang and Yasuharu Yoshikawa) Key
engineering materials, Vols.535-536, pp.334-337(2013)
2 ( , ,
, ) ,
1. Galling behavior in square cup drawing of high tensile strength steel sheet, (Mingxu Yang, Zhigang Wang and Keisuke Tanabe), The 10th asia-pacific conference on engineering plasticity and its application, pp.403-407(2010), Wuhan, China. 2. , ( , ), 2011 , pp.124-125(2011), , . 3. , ( , , ), 63 , No301(2012). 4. , ( , , ), 63 , No299(2012).
5. Tribological feature of square cup drawing test, (Mingxu Yang, Zhigang Wang, Yasuharu Yoshikawa and Shunsuke Ando), American institute of physics, pp.1146-1150(2013), Shenyang, China.
6. Effect of blank shape on galling behavior in square cup drawing, (Mingxu Yang, Zhigang Wang, Yasuharu Yoshikawa and Shunsuke Ando), 16th international conference on advances in materials and processing technologies, No218(2013),
Taipei, Taiwan.
7. , ( , , ,
93