Quality Control of Pharmaceutical Products
Based on the Evaluation of Physical Properties
of Ingredients inside Tablets Using
Near-infrared Spectroscopy
著者(英)
Kimie Awa
学位名
博士(工学)
学位授与機関
関西学院大学
学位授与番号
34504乙第358号
URL
http://hdl.handle.net/10236/13859
Quality Control of Pharmaceutical Products
Based on the Evaluation of Physical Properties of
Ingredients inside Tablets Using Near-infrared
Spectroscopy
A Thesis for the Degree
of
Doctor of Engineering
Submitted to
School of Science and Technology
Kwansei-Gakuin University by
Kimie Awa
Contents
General Introduction 7
References 14
Chapter 1: Self-modeling Curve Resolution (SMCR) Analysis of Near-infrared (NIR) Imaging Data of Pharmaceutical Tablets 19
Abstract 20
1. Introduction 22
2. Theory 25
3. Experiment 28
4. Results and Discussion 32
5. Conclusion 36
6. References 38
Chapter 2: An Effect of Cellulose Crystallinity on Moisture-absorbability of a Pharmaceutical Tablet Studied by Near-infrared Spectroscopy 48
Abstract 49
2. Experiment 54
3. Results and Discussion 57
4. Conclusion 67
5. References 69
Chapter 3: The Effect of Microcrystalline Cellulose Crystallinity on Moisture-absorbability, Water-penetration and Stability of
Pharmaceutical Tablets 82
Abstract 83
1. Introduction 84
2. Experiment 86
3. Results and Discussion 91
4. Conclusion 97
5. References 98
Chapter 4: Monitoring of Recrystallization of Microcrystalline Cellulose inside Pharmaceutical Tablets during Storage using Near-infrared Diffuse
Abstract 107
1. Introduction 108
2. Experiment 111
3. Results and Discussion 114
4. Conclusion 120
5. References 122
Conclusion 132
Acknowledgements 135
List of Abbreviations
AAP: acetaminophen
ALS: Alternating Least Squares
ASA: aspirin
DCPA: anhydrous dibasic calcium phosphate
EFA: Evolving Factor Analysis
IR: infrared
JP: Japanese Pharmacopoeia
LOF: Lack of Fit
MCC: microcrystalline cellulose
Mg-St: stearic acid magnesium salt
NIR: near-infrared
PAT: process analytical technology
PCA: principal component analysis
PTX: pentoxifylline
QbD: quality by design
SEM: scanning electron microscopy
SSR: sum squared residual
X-ray CT: X-ray computed tomography
General Introduction
Supply of high-quality pharmaceutical products is one of the most important tasks to
guarantee the medication safety. In the formulation design of pharmaceutical products,
the adequate administration route and dosage form are chosen with consideration for
physical, chemical, and biochemical properties of an active pharmaceutical ingredient.
Additionally in most cases, the pharmaceutical products which have the suitable product
performance are designed in order to maximize their drug efficacy or to improve patient
compliance and convenience. 1-6 The pharmaceutical product performance such as
dissolution, disintegration, moisture-absorbability, and stability has effects on the
bioavailability and quality of the products. Therefore, the pharmaceutical product
performance should be appropriately controlled.
Now, manufacturing and quality management of pharmaceutical products are
controlled by the pharmaceutical regulations in individual countries. The quality and
important pharmaceutical product performance are evaluated in the quality inspection
before shipping (Figure 1). Then only lots which conform to the acceptance criteria
are shipped. The conventional strategy for the formulation design and quality
management like this, however, is inefficient and sometimes unscientific. Accordingly,
high-quality pharmaceutical products stably and efficiently. In ICH harmonised
tripartite guideline Q8(R2), QbD is defined as ‘a systematic approach to development
that begins with predefined objectives and emphasizes product and process
understanding and process control, based on sound science and quality risk
management’. 7 This concept is the new strategy for the formulation design and
quality management (Figure 1). Robust manufacturing processes should be developed
based on the scientific evidence such as process understanding and scientific process
control, which lead to constant supply of high-quality pharmaceutical products. By
proposal of the concept of QbD, the formulation design and quality management based
on the scientific evidence becomes increasingly important. To understand the
mechanism of the pharmaceutical product performance is a valid approach. In
addition, it makes the formulation design more effective.
In order to understand the mechanism of the pharmaceutical product performance, it
is absolutely necessary to understand the physical properties of ingredients inside
products accurately. Because their physical properties, especially crystal structures
influence their own solubility, moisture-absorbability, and stability, which eventually
induce the change in pharmaceutical product performance. 8-15 In this thesis, we
ingredients inside products. NIR spectroscopy has significant light penetration
property and is a non-destructive and non-invasive technique. By using NIR
spectroscopy, it is possible to reveal the physical or chemical state of the component
inside sample. 16, 17 Thus, NIR spectroscopy has been widely used for the quality
evaluation of pharmaceutical products. 18-23 In addition, NIR spectrum is more
sensitive to changes in hydrogen bonding, compared to infrared spectroscopy and
Raman spectroscopy, making it possible to elucidate subtle but important
molecular-level variations in the sample. Consequently, NIR spectroscopy is a
powerful tool for the evaluation of the physical properties, especially crystal structures
of ingredients inside products.
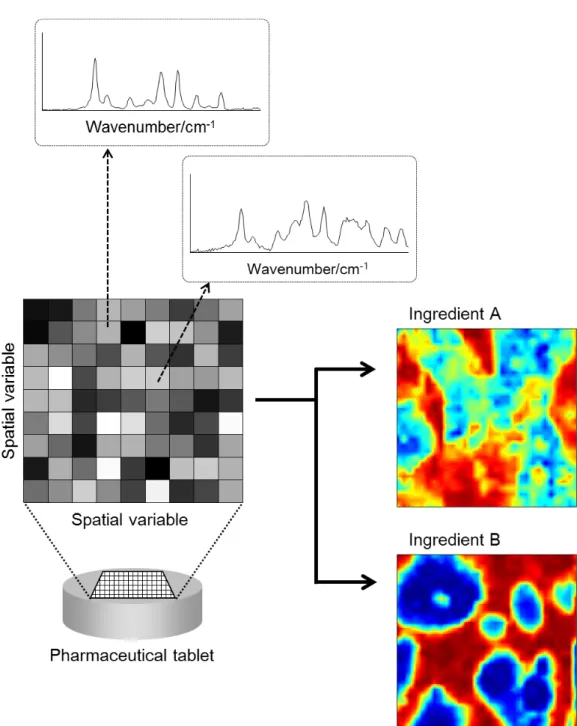
We used NIR imaging in some studies in this thesis. As shown in Figure 2, NIR
imaging measures a series of NIR spectra for every pixel which divides an object into
several spatial parts. Therefore, it can provide spatial and chemical information. To
reveal the distribution and the chemical or physical state of a certain ingredient in a
product can lead to the in-depth understanding of variation in pharmaceutical product
performance.
Although NIR spectroscopy and NIR imaging provide a lot of information, they have
and overlapping of many overtone and combination bands. The appropriate spectrum
analysis is really important to extract essential information from complicated spectra.
As a solution for this problem, chemometrics methods have often been applied. It
enables one to extract the essential information about the objects of interest in the data
by using statistical or mathematical techniques.
In this thesis, NIR spectroscopy was applied to the quality evaluation of
pharmaceutical tablets. We revealed effects of tablet manufacturing processes on the
physical properties of ingredients. Moreover, we investigated how the variations in the
physical properties change pharmaceutical product performance.
In Chapter 1, we investigated effect of the grinding process on dissolution profile
using NIR imaging. In many studies using NIR imaging, while interpretation of
distribution image of a certain ingredient is focused on, the detailed analysis of NIR
spectra is often overlooked. In the study in Chapter 1, NIR imaging combined with
self-modeling curve resolution (SMCR) analysis revealed that the grinding process
changed the crystal structure of an active pharmaceutical ingredient. In addition, the
distribution of the ingredients inside tablets was quantified by SMCR analysis. These
In Chapter 2, we investigated effects of grinding process on pharmaceutical product
performance of tablets containing microcrystalline cellulose (MCC) at the molecular
level. MCC is a well-known excipient commonly included in pharmaceutical tablets
as diluent, binder, and disintegrator. It is well-known that the crystal structures of
active pharmaceutical ingredients can influence on pharmaceutical product
performance.10-12 Therefore, their crystal structures are strictly controlled during the
manufacturing processes. On the other hand, the crystal structures of excipients are
often overlooked, even though their crystal structures can also affect pharmaceutical
product performance. 13-15 In the study in Chapter 2, it was revealed that the grinding
process changed the crystallinity of MCC. We also discussed the mechanism that the
variation in MCC crystallinity induced by grinding process changed the
moisture-absorbability of the tablet.
In Chapter 3, we used more practical tablets containing MCC and investigated the
actual effects of MCC crystallinity on pharmaceutical product performance of the
tablets. In the study in Chapter 2 and other previous study 24, we reported that some
manufacturing processes decreased the crystallinity of MCC, which eventually led to
the change in compression moldability, dissolution profile, and moisture-absorbability
the hardness and dissolution profile of tablets. 15 However, the tablets used in these
studies were constructed mainly from MCC, using 80 – 90% of MCC. Actual effects
of MCC crystallinity on actual pharmaceutical tablets containing a much smaller
amount of MCC is not fully understood yet. In the study in Chapter 3, it was revealed
that the water-penetration and moisture-absorbability of the tablets were influenced by
MCC crystallinity even when the tablets contained only 20% MCC. In addition, the
results also indicated that the change in moisture-absorbability had crucial effects on the
stability of tablets which is one of the most important pharmaceutical product
performance.
In Chapter 4, we monitored the transient variations in the crystallinity of MCC inside
tablets during storage using NIR spectroscopy. Crystal structures of active
pharmaceutical ingredients are strictly controlled during the manufacturing processes of
pharmaceutical products as well as during storage. On the other hand, the crystal
transformation behavior of excipients during storage has hardly been investigated, even
though their crystal structures can affect pharmaceutical product performance as
described in Chapter 2 and Chapter 3. In the study in Chapter 4, it was revealed that
the crystal transformation behavior of MCC depended on the humidity condition during
influenced the crystal transformation behavior of MCC.
In this thesis, we revealed that the manufacturing process of pharmaceutical products
can change the physical properties of ingredients, which eventually changes the
pharmaceutical product performance of tablets. These results must be useful
applications in controlling the quality of pharmaceutical products based on the scientific
References
1. Cannizzaro S.M.; Langer R.S. Chem. Rev. 1999, 99, 3181-3198.
2. Langer R. Nature 1998, 392, 5-10.
3. Fukui E.; Miyamura N.; Uemura K.; Kobayashi M. Int. J. Pharm. 2000, 204, 7-15.
4. Kuno Y.; Kojima M.; Nakagami H.; Yonemochi E.; Terada K. Eur. J. Pharm.
Biopharm. 2008, 69, 986-992.
5. Fukami J.; Yonemochi E.; Yoshihashi Y.; Terada K. Int. J. Pharm. 2006, 310,
101-109.
6. Phuapradit W.; Bolton S. Drug Dev. Ind. Pharm. 1991, 17, 1097-1107.
7. International Conference on Harmonisation of Technical Requirements for
Registration of Pharmaceuticals for Human Use, ICH Harmonised Tripartite
Guideline, Pharmaceutical Development Q8(R2), 2009.
8. FDA paper, Guideline for submitting supporting documentation in drug
applications for the manufacture of drug substances, 1987.
9. Otsuka M.; Matsuda Y. Encyclopedia of pharmaceutical technology, Vol. 12,
Polymorphism: pharmaceutical aspects, In J. Swarbrick, J. C. Boylan, editors,
1995.
11. Engel G.L.; Farid N.A.; Faul M.M.; Richardson L.A.; Winneroski L.L. Int. J.
Pharm. 2000, 198, 239-247.
12. McNamara D.P.; Childs S.L.; Giordano J.; Iarriccio A.; Cassidy J.; Shet M.S.;
Mannion R.; O'Donnell Ed.; Park A. Pharm. Res. 2006, 23, 1888-1897.
13. Ando M.; Ito R.; Ozeki Y.; Nakayama Y.; Nabeshima T. Int. J. Pharm. 2007, 336,
319-328.
14. Sebhatu T.; Elamin A.A.; Ahlnek C. Pharm. Res. 1994, 11, 1233-1238.
15. Suzuki T.; Nakagami H. Eur. J. Pharm. Biopharm. 1999, 47, 225-230.
16. Ozaki Y. Anal. Sci. 2012, 28, 545-653.
17. Siesler H.W.; Ozaki Y.; Kawano S.; Heise H.M. Near-infrared Spectroscopy,
Principles, Instruments, Applications, Wiley-VCH, Weinheim, 2001.
18. Reich G. Advanced Drug Delivery Reviews 2005, 57, 1109-1143.
19. El-hagrasy A.S.; Morris H.R.; D'amico F.; Lodder R.A.; Drennen III J.K. J. Pharm.
Sci. 2001, 90, 1298-1307.
20. De Beer T.; Burggraeve A.; Fonteyne M.; Saerens L.; Remon J.P.; Vervaet C. Int. J.
Pharm. 2011, 417, 32-47.
21. Moltgem C.V.; Puchert T.; Menezes J.C.; Lochmann D.; Reich G. Talanta 2012, 92,
22. Awa K.; Okumura T.; Shinzawa H.; Otsuka M.; Ozaki Y. Anal. Chim. Acta 2008,
619, 81-86.
23. Hattori Y.; Otsuka M. Vib. Spectrosc. 2011, 57, 275-281.
Chapter 1
Self-modeling Curve Resolution (SMCR)
Analysis of Near-infrared (NIR) Imaging Data
Abstract
The idea of Quality by design (QbD) has been proposed in pharmaceutical field.
QbD is a systematic approach to control the product performance based on the scientific
understanding of the product quality and its manufacturing process. In this study,
near-infrared (NIR) imaging was utilized as a tool to achieve this concept. A practical
use of a chemometrics technique called Self-modeling Curve Resolution (SMCR) was
demonstrated with NIR imaging analysis of wax matrix tablets containing two
ingredients, a soluble active ingredient, pentoxifylline (PTX), and an insoluble excipient,
palmitic acid. Concentration profiles obtained by SMCR revealed that the
homogenous distribution of chemical ingredients strongly depended on the grinding
time. In addition, pure component spectra by SMCR indicated a sequential change of
specific NIR peak intensities following the increase of the grinding time. The spectra
change showed the molecular structure change of PTX related to its crystallinity during
grinding process. These results indicate that the grinding process plays a central role
in quantitative control, that is to say, sustain-release of PTX from the wax matrix tablet.
This study, consequently, clearly demonstrates that NIR imaging combined with SMCR
can be a powerful tool to reveal the mechanism of chemical or physical changes induced
1. Introduction
To supply high-quality pharmaceutical products stably and efficiently, one of the
important tasks is to control the quality of pharmaceutical products based on the
scientific evidence. As one of approaches to this task, the concept of Quality by
design (QbD) has been proposed.1 The quality of pharmaceutical products should be
controlled based on scientific understanding of their quality attributes, formulation, and
manufacturing process.
Recently, infrared (IR), near-infrared (NIR), Raman and terahertz pulsed imaging
technology have been utilized as a tool to evaluate the quality of pharmaceutical
products, such as the ingredient distribution, the polymorph ratio inside tablets, and
coating thickness.2-7 These techniques based on vibration spectroscopy make it
possible to reveal the mechanism of physical or chemical changes at the molecular level.
The understanding of such mechanism can be a key factor for the quality control of
pharmaceutical products. That is, these spectroscopic imaging technologies can be a
solid solution for QbD. In this study NIR imaging was applied to understand
mechanism in the grinding process which is one of the pharmaceutical tablet
NIR imaging measures a series of NIR spectra for every pixel which divides an
object into several spatial parts. A unique feature of NIR imaging technique is that it
offers not only spatial distribution of objects but also structural information strongly
related to hydrogen bonding which is one of the key factors for crystal structure. In
spite of these advantages, NIR imaging sometimes has a difficulty in its data analysis.
Imaging data which has a high dimensional structure composed of two spatial and one
spectral dimensions are generally difficult to be directly and intuitively interpreted. As
a solution for this problem, chemometrics methods have often been applied to take the
full advantage of the spectral and spatial information contained in the imaging data. It
enables one to extract the essential information about the objects of interest in the data
by using statistical or mathematical techniques.
An example of these chemometrics techniques is principal component analysis
(PCA).8-10 Another example of popular chemometrics technique is a family of
multivariate curve resolution techniques called self-modeling curve resolution
(SMCR).11-14 SMCR techniques have widely been studied since its first introduction
by Lawton and Sylvester,15 and it has also been successively introduced to multivariate
imaging analysis.11, 16 SMCR utilizes a certain mathematical data decomposition
multi-component mixtures into individual factors for single species.12, 13 The only
premises which SMCR requires are bilinear data structure and some generic knowledge
about the pure variables, such as non-negativity, unimodality, closure of the
concentration, or spectral profiles. Compared with PCA, SMCR provides information
closely related to physical or chemical model of data. Instead of scores and loadings
mathematically constrained to be orthogonal, SMCR deconvolutes original data into
concentration profiles matrix C and pure component spectra matrix S. Concentration
profiles and pure component spectra represent physical or chemical distribution of main
contributing sources among samples and corresponding chemical compositions. For
example, in SMCR with multivariate imaging data, C can be seen as the spatial
distribution of each chemical species and S corresponds to their true spectrum.14
In this study, SMCR was used for NIR imaging data analysis of pharmaceutical
tablets to investigate their physical property or the mechanism of grinding process.
Namely, a practical use of SMCR was demonstrated with NIR imaging data of wax
matrix tablets containing two ingredients, pentoxifylline (PTX) and palmitic acid as
active ingredient and insoluble excipient, respectively. Concentration profile of the
tablets clearly revealed the distribution of the chemical ingredients inside tablets. The
homogenous distribution is clearly proportional to the given grinding time. It was also
shown that these distributions apparently corresponded to the release rate of PTX from
the tablets. Thus, it is revealed that sustained-release of PTX strongly depends on its
distribution inside the insoluble waxy matrix. Consequently, these results clearly
demonstrate that NIR imaging can be a powerful and versatile tool for the mechanism
understanding in the manufacturing process of pharmaceutical products and QbD of
pharmaceutical products becomes possible.
2. Theory
In this chapter, boldface capital letters are used for matrices, boldface lowercase
characters are used for vectors, and the superscript T indicates the transpose of matrix.
2.1
Self-modeling Curve ResolutionIf we assume the spectra of a mixture with contributions from A components, a
general form of SMCR is described as;
E CS
X= T + (1)
where X is a data matrix of m spectra recorded at n different wavenumbers. C is an
A
profiles described as follows; = = mA m2 m1 2A 22 21 1A 12 11 m 2 1 c c c c c c c c c c c c C (2) = = An A2 A1 2n 22 21 1n 12 11 A 2 1 T s s s S s s s s s s s s S (3)
Initial estimates can be obtained, for example, by either EFA (Evolving Factor Analysis)
for C,17, 18 or SIMPLISMA for S.19, 20 The basic principle of SMCR is to seek a
bilinear model that gives the best fit, in the sense of least squares or weighted least
squares, to X. In other words, SMCR estimates pure variables, C and S, minimizing
the error criterion of sum squared residual (SSR):
T
CS
X−
=
SSR (4)
2.2
Alternating Least SquaresALS (Alternating Least Squares) is an algorithm to minimize the SSR in Eq. (4) with
two matrices C and S.21, 22 The algorithm comprises a step of iteratively solving two
alternating least-squares problems, i.e., minimization of Eq. (4) over C for fixed S, as
minimization problems are given, respectively, by Eqs. (5) and (6). As a result, the
basic flow of ALS algorithm is the repetition of the calculation of Eqs. (5) and (6) until
SSR reaches a minimum value;
1 T S) XS(S C= − (5) 1 T T C) C(C X S= − (6)
Although this iteration process finds mathematically valid solutions, because of
rotational ambiguities, the solutions must be constrained in order to find chemically
reasonable solutions.21
2.3
Self-modeling Curve Resolution with Imaging DataSpectroscopic imaging system can measure spectra for each pixel of objects. For
example, if an object is divided into x × y pixels and spectra are collected at n variables
for each pixel, imaging data become three dimensional cubic data structure, say )
(x ×y×n size matrix. In a practice of SMCR with three dimensional data, spatial
coordinate of the data are arranged to be two dimensional data structure, such as
) )
((x × y ×n matrix. SMCR is applied to this arranged X to obtain C and S.
Consequently, C and ST becomes ((x × y)×A) and (A×n) matrices, respectively.
) )
((x × y ×A matrix to be (x ×y×A) size. Detailed description can be found in
Ref. 14.
3. Experiment
3.1
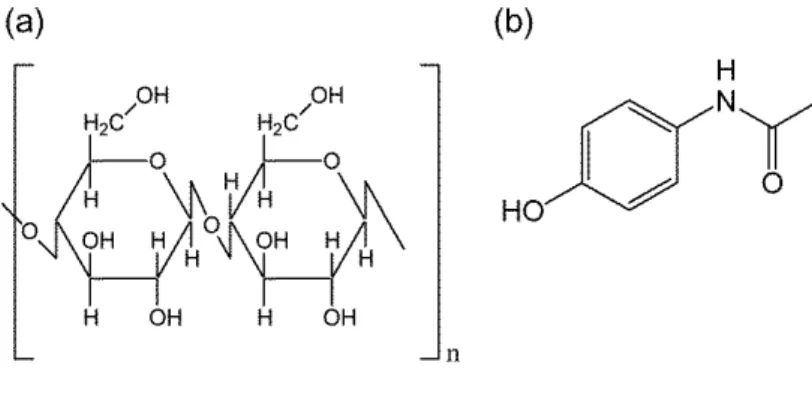
MaterialsPTX was purchased from Nakalai tesque, Inc. (Kyoto, Japan). Chemical structure
of PTX is shown in Figure 1-1. Palmitic acid was purchased from Kanto Chemical Co.
Inc. (Tokyo, Japan). All reagents were used without further purification.
3.2
Sample PreparationTotal 10 g PTX and 40 g palmitic acid were mixed and then ground by a ball mill,
MONO MILL P-6 (Fritch Japan Co., Tokyo, Japan) containing 50 zirconia balls with 10
mm diameter. The sample powder was ground for 0, 0.5, 1, 2, 10 and 45 minutes with
250 rpm rotating speed. Finally, for each ground mixture, 200 mg of mixture powder
was compressed to make a set of tablets using a single punch tablet
machine equipped with flat-faced punches and a cylindrical die (8 mm i.d.) set at 1000
3.3
Near-infrared ImagingNIR diffuse reflectance spectra of tablets were collected with a FT-NIR imaging
system, Spotlight 350 (PerkinElmer, MA, USA) over the 7800-4000 cm-1 region. NIR spectra were measured in 400×400 μm region with a spatial resolution 25 μm/pixel.
3.4
Dissolution StudyThe release profiles of PTX from wax matrix tablets were investigated in accordance
with the Dissolution Test (Paddle method) of the Japanese Pharmacopoeia XV (JP XV),
as reported previously.23 Namely, each tablets were dipped into dissolution medium,
phosphate buffer of pH 6.8, for an hour at 37 °C. The dissolution medium was
sampled in an hour and the percent release of PTX was calculated by measuring the
absorbance at 274 nm by using a ultra-violet and visible spectrophotometric, UV2400
(Shimadzu Co., Kyoto, Japan).
3.5
X-ray Powder Diffraction AnalysisStructural changes related to their crystallinity were confirmed with X-ray powder
diffraction (XRD) of the samples. XRD profiles of each ground mixture were
The operating conditions were as follows: radiation, Cu Ka; power, 40 kV × 50 mA;
automatic monochromator; divergence slit, 1.00 mm; scan mode, continuous mode;
scan range, 2 - 40˚; scan rate, 4˚/min, scan step. 0.02˚.
3.6
Data AnalysisFirst, chemical rank of the whole system is evaluated by singular value
decomposition. As shown in Figure 1-2, chemically meaningful rank can be estimated,
in a mathematical sense, as 2 for each tablet. It is noted that this number of chemical
rank 2 corresponds to that of chemical ingredients in each tablet, PTX and palmitic acid.
Therefore, it can be seen that the system concerning the grinding process is mainly
described with distribution of PTX and palmitic acid.
For each tablet, SMCR was applied to the NIR spectra over the spectral region of
7600 – 4500 cm-1 and concentration profiles C and pure component spectra S were
obtained. SMCR requires an initial estimate for C or S. Several well-known
methods, EFA for C and SIMPLISMA or OPA for S,20 are usually used for the initial
estimate. However, chemical ingredients inside a pharmaceutical tablet are often
known in many cases of process analysis, and their ‘true’ spectra can be directly
no interaction or structural changes during the grinding process, measured spectra can
be simply described with linear combination of some coefficients and their ‘true’ spectra
obtained from the measurement of unmixed samples in advance. In contrast, if some
physical or chemical changes are induced to the chemical ingredients by thermal or
mechanical force given in measurements or sample preparation process, it can not be
assumed that measured spectra are completely descried just with their ‘true’ spectra of
pure samples. For example, if the decrease (or increase) of relative peak intensity or
the peak shift related to crystallinity occurs in the grinding process, it is not adequate to
identify pure component spectra with the ‘true’ spectra of unprocessed samples because,
in this case, the pure component spectra includes the influence by the force given in the
grinding process. In other words, the comparison between the ‘true’ spectra of pure
ingredients and corresponding pure component spectra by SMCR can make it possible
to reveal the structural change at molecular level induced by the grinding process.
Therefore, NIR spectra of each individual ingredient were utilized as the initial S. In
SMCR, all spectra were normalized and non-negativity constraint was imposed. All
calculations were performed by the in-house programs coded in MATLAB (Version
4. Results and Discussion
First, curve resolution performance for each tablet was estimated by a fitting
parameter, called Lack of Fit (LOF). LOF, used as an indicator of curve resolution
performance, is defined as 100 ) ˆ ( LOF 1 1 2 2 × − =
∑∑
= = m i n j ij ij ij x x x (7)where xˆij is a reconstructed spectral intensity based on the optimized C and S. It is
noted that if the reconstructed spectrum approaches the original, LOF decreases. In
other words, LOF is a kind of degree to represent the closeness of the obtained SMCR
model to the observed chemical phenomena. Table 1-1 summarizes LOF for each
tablet. It is noted that LOF ranges from 0.068 to 3.776 %, resulting relatively small
resolution errors.
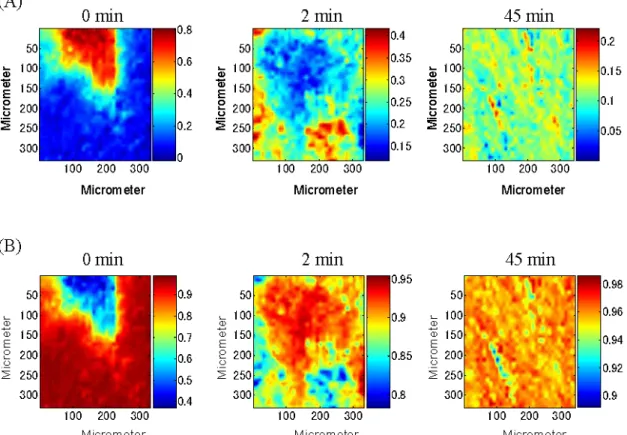
Figure 1-3(A) and (B) illustrate a series of concentration profiles C of PTX and
palmitic acid, respectively, for the tablets ground for 0, 2 and 45 minutes. These
concentration profiles of the tablets ground for 0 – 45 minutes can be as an index to
estimate the distribution of PTX and palmitic acid inside the tablets. As shown in
homogenous distribution of ingredients inside tablets.
The relationship between the ingredient distribution and the dissolution property can
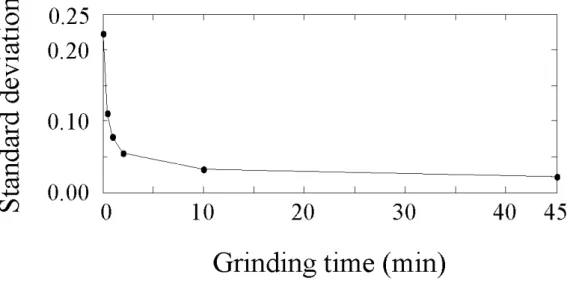
also be discussed in this chapter. Figure 1-4 shows the standard deviation of
concentration profiles of PTX. Standard deviation of concentration profiles is given
as;
∑
= − − = m i i C C m 1 2 ) ( 1 1 σ (8)where, C is a concentration profiles for a specific chemical component (e.g. palmitic
acid or PTX) and m corresponds to the number of spectra. Standard deviation of
concentration profiles can be a quantitative index representing the distribution of
chemical ingredients. For example, if a chemical ingredient distributes homogenously
inside a tablet, its standard deviation approaches to zero. As shown in Figure 1-4, the
standard deviation obviously decreased with the increase of grinding time, which
showed that PTX was uniformly distributed inside the tablets when enough grinding
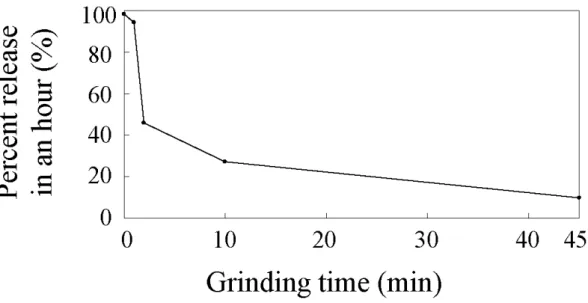
time was given. Figure 1-5 shows the relationship between the release rate of PTX
from each wax matrix tablet and the grinding time. The release rate of PTX decreased
with the increase of grinding time. It is noted that the decrease of release rate clearly
inside the insoluble waxy matrix is one of the key factors of sustained-release of PTX.
In the design of pharmaceutical drugs, several pharmaceutical properties such as release
rate of the ingredient are important indices to control the effect of pharmaceutical drugs
in the body. Therefore, it is noteworthy that the estimate of release rate by NIR
imaging may become possible since release rate is clearly related to standard deviation
of concentration profiles.
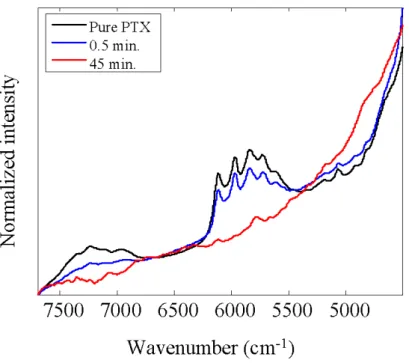
Figure 1-6 represents optimized S for PTX over the spectral region of 7600 – 4500
cm-1. Black line represents the pure spectrum of PTX. Blue and red lines represent the
pure spectra of tablets ground for 0.5 and 45 minutes, respectively. It is interesting to
point out that there are some differences between the initial and optimized S in Figure
1-6. If there were no structural change in the mixtures and no interaction among the
ingredients, the NIR spectra of the tablets could be described simply as a linear
combination of the pure spectra of individual chemical ingredients. Namely, in this
case, each optimized S would become equal to each initial S obtained directly from the
measurement of unmixed samples in advance. On the other hand, if there is a true
chemical or physical change in the ingredients upon grinding, the optimized S may be
altered and show some difference compared to its original pure component spectrum.
information, which is not described just by the spectra of pure ingredients. In our case,
the comparison of S from each tablet indicated a sequential change of S caused by the
physical force given in the grinding process. In Figure 1-6, peaks in the region of
6300 – 5500 cm-1 clearly decreased with the increase of grinding time. These peaks
are assigned to the overtone and combination modes of -CH groups of PTX. For
example, a peak at 5830 cm-1 is due to the first overtone of antisymmetric stretching
mode of CH2 group. The difference between the initial and optimized S is most
probably due to that chemical interaction caused by grinding process. The spectral
difference between initial and optimized S or among S, for example, indicates their
structural change related to polymorphs or amorphous properties induced by the
grinding process. The NIR spectra of separately ground PTX showed the decrease in
peaks in the region of 6300 – 5500 cm-1. This result supports that the optimized S
indicates the change of PTX caused by grinding process. This kind of use of SMCR
analysis applied to the sequentially perturbed system can be a useful tool to reveal the
detailed effect of the thermal or mechanical force given in the manufacturing process
which causes stepwise or continuous change in C and S.
On the other hand, XRD profiles indicated the decrease of crystallinity of PTX. As
decreased with the grinding time. This result supports the observation obtained with
the initial and optimized S by SMCR. Namely it clearly corresponds to the crystal
structure change of PTX related to CH group, say probably hydrogen bonding.
Decreases in crystallinity of ingredients generally induce the enhancements in their
solubility. On the contrary in this study, the solubility ratio of PTX was restrained
though its crystallinity decreased. These results suggest that decrease in the solubility
ratio may be related to the distribution of the ingredient. For example, if PTX
molecules are covered with hydrophobic palmitic acid, it can prevent the contact with
water. On the other hand, the result reveals the presence of a specific change of PTX
crystalline structure. Thus, its crystallinity decrease may also be another key factor of
sustained-release of PTX. Consequently, it indicates the possibility and utility that
NIR imaging combined with SMCR enables one to reveal the change of crystallinity or
crystal structure of ingredients without using XRD.
5. Conclusion
The NIR imaging analysis of pharmaceutical tablets containing PTX and palmitic
applied to the NIR imaging data of the tablets to extract qualitative and quantitative
information. Concentration profiles obtained by SMCR revealed that PTX was
well-distributed in the waxy matrix of tablet with the increase of grinding time. On the
other hand, pure component spectra by SMCR apparently indicated a sequential change
of crystal structure of PTX induced by the grinding process. Thus, these results imply
that following two factors are strongly related to sustained-release of PTX: the
distribution of PTX particles inside the insoluble waxy matrix; and the crystal structure
change of PTX which may be based on intermolecular hydrogen bonding induced by
the manufacturing process. Consequently, this study has demonstrated that it is
possible to reveal both distribution uniformity and molecular structure change of the
ingredients by NIR imaging combined with SMCR analysis. It can be a powerful and
versatile tool for the mechanism understanding in the manufacturing process of
pharmaceutical products. This tool would surely prompt QbD of pharmaceutical
6. References
1. International Conference on Harmonisation of Technical Requirements for
Registration of Pharmaceuticals for Human Use, ICH Harmonised Tripartite
Guideline, Pharmaceutical Development Q8(R2), 2009.
2. Elkhider N.; Chan K.L.A.; Kazarian S.G. J. Pharm. Sci. 2007, 96, 351-360.
3. El-Hagrasy A.S.; Morris H.R.; D’Amico F.; Lodder R.A.; Drennen III J.K. J. Pharm.
Sci. 2001, 90, 1298-1307.
4. Henson M.J.; Zhang L. Appl. Spectrosc. 2006, 60, 1247-1255.
5. Kang E.; Wang H.; Kwon K.; Robinson J.; Park K.; Cheng J-X. Anal. Chem. 2006,
78, 8036-8043.
6. Lin W-Q.; Jiang J-H.; Yang H-F.; Ozaki Y.; Shen G-L.; Yu R-Q. Anal. Chem. 2006,
78, 6003-6011.
7. Strachan C.J.; Taday P.F.; Newnham D.A.; Gordon K.C.; Zeitler J.A.; Pepper M.;
Rades T. J. Pharm. Sci. 2005, 94, 837-846.
8. Šašić S. Appl. Spectrosc. 2007, 61, 239-250.
9. Næs T.; Isaksson T.; Fearn T.; Davies T.; A User-Friendly Guide to Multivariate
Calibration and Classification, NIR publications, Chichester, 2002.
Smeyers-Verbeke J. Handbook of Chemometrics and Qualimetrics, Elsevier
Science, Amsterdam, 1998.
11. Lawton W.H.; Sylvestre E.A. Technometr. 1971, 13, 617-633.
12. Gemperline P.J. Anal. Chem. 1999, 71, 5398-5404.
13. Jiang J.H.; Liang Y.; Ozaki Y. Chemom. Intell. Lab. Syst. 2004, 71, 1-12.
14. De Juan A.; Tauler R.; Dyson R.; Marcoil C.; Rault M.; Meader M. Treds Anal.
Chem. 2004, 23, 70-79.
15. Lawton W.H.; Sylvestre E.A. Technometr. 1971, 13, 617-633.
16. Budevska B.O.; Sum S.T.; Jones T.J. Appl. Spectrosc. 2003, 57, 124-131.
17. Gampp H.; Maeder M.; Meyer J.C.; Zuberbuhler A.D. Talanta 1985, 32, 1133-1139.
18. Meader M.; Zuberbuehler A.D. Anal. Chim. Acta 1986, 181, 287-291.
19. Kvalheim O.M.; Liang Y.Z. Anal. Chem. 1992, 64, 936-946.
20. Sanchez F.C.; Van den Bogaert B.; Rutan S.C.; Massart D.L. Chemom. Intell. Lab.
Syst. 1996, 34, 139-171.
21. Tauler R. Chemom. Intell. Lab. Syst. 1995, 30, 133-146.
22. Tauler R.; Smilde A.K.; Kowalski B.J. J. Chemom. 1995, 9, 31-58.
Figure 1-3 Concentration profiles C of (A) PTX and (B) palmitic acid for each tablet
Figure 1-4 A plot of grinding time versus standard deviation of concentration profiles
Figure 1-7 XRD profiles of mixtures of PTX and palmitic acid ground for (A) 0, (B) 2,
Chapter 2
An Effect of Cellulose Crystallinity on
Moisture-absorbability of a Pharmaceutical
Tablet Studied by Near-infrared Spectroscopy
Abstract
In this study, we investigated molecular level variation of tablets caused by grinding
and its effect on moisture-absorbability of the tablets. Model tablets contained
acetaminophen (AAP) as an active pharmaceutical ingredient and microcrystalline
cellulose (MCC) as an excipient. Different level of grinding was applied to MCC prior
to tablet formulation, to intentionally cause structural variation in the MCC. The
moisture-absorbability of tablets showed obvious variation depending on the grinding
time, and the corresponding change in near-infrared (NIR) spectra was readily captured.
The detailed analysis of the variation of the band frequencies (i.e. wavenumber)
revealed that the grinding process substantially disintegrates the crystalline and
generates glassy amorphous structure of MCC, which is a requirement to absorb water
molecules. Consequently, it is very likely that the change of the moisture-absorbability
of the tablets is closely related to the development of the amorphous structure. These
results indicate that the pharmaceutical product performance can be influenced by the
physical properties of the excipient, which, in turn, can be controlled by the grinding
1. Introduction
In the formulation design of pharmaceutical products, the adequate administration
route and dosage form are chosen with consideration for physical, chemical, and
biochemical properties of an active pharmaceutical ingredient. In some cases, the
site-specific drug release property is designed in order to deliver the active ingredient to
a target organ efficiently.1-3 In other cases, the oral disintegration or controlled-release
is desirable for improvement of patient compliance and convenience.1, 4-6 Suitable
excipients and formulation are selected for desirable pharmaceutical product
performance.7-9 Additionally, it is important to note that the pharmaceutical tablet
performance such as dissolution, disintegration, moisture-absorbability, and stability has
effects on the bioavailability and quality of the tablet. It is known that the tablet
performance is affected by the density and surface condition of the tablet.10, 11 The
tablet performance is also closely related to the physical properties, especially crystal
structure, of active pharmaceutical ingredient and excipient in the tablet.12-16 The
crystal structure of active pharmaceutical ingredient is strictly controlled during the
manufacturing processes. On the other hand, the crustal structure of excipient is often
Therefore, it is important to control the physical properties of excipient in a
pharmaceutical product.
The so-called mechano-chemical effect is structural variation of chemical
components caused by thermal or mechanical force provided during some
manufacturing processes.17 Microcrystalline cellulose (MCC) is a well-known
excipient commonly included in pharmaceutical tablets as diluent, binder, and
disintegrator.7-9 It is known that the polymeric structure of MCC is influenced by
specific manufacturing process and the change in the polymeric structure eventually
results in the variation of the pharmaceutical property of the tablet.18 For example, we
reported that the compression can induce the disintegration of crystalline structure of
MCC. The development of the mobile amorphous component by the compression
makes it possible to pack the tablet tightly, which eventually results in the delay in the
dissolution and moisture-absorption.18 In addition, the development of the disordered
amorphous structure results in the variation of the pharmaceutical property since the
amorphous component tends to absorb even more water molecules.19, 20 Thus, the
clarification of the polymeric structure change of MCC leads to penetrating insight into
the manufacturing process, which, in turn, can be useful for the control of the
Vibrational spectroscopy, infrared (IR), near-infrared (NIR), and Raman
spectroscopy, has frequently been used for exploration of the physical properties of
formulation components in pharmaceutical products.21-26 In particular, NIR
spectroscopy has significant light penetration property. It provides an interesting
opportunity to elucidate the physical and chemical information inside pharmaceutical
products, i.e. tablets.27-31 Also, NIR spectrum is more sensitive to the change in the
hydrogen bonding, compared to IR spectroscopy and Raman spectroscopy and,
therefore, it enables one to sort out molecular-level variations of the sample.
Consequently, NIR spectroscopy is a powerful tool for the evaluation of the polymeric
structure of MCC inside products. In fact, in our previous study we investigated the
molecular-level variations of MCC, i.e. crystalline structural variations, by using NIR
spectroscopy.32
In this study, we explored an effect of grinding of MCC on transient variation
induced by storage of tablets. For example, the grinding may induce substantial
changes in the cellulosic polymeric structure. When stored under the presence of
water molecule, the development of such structure possibly brings the transient
variation which may, in turn, affect the pharmaceutical property of the tablet containing
pharmaceutical ingredient and MCC as an excipient. The MCC was subjected to
grinding treatment prior to tablet formulation, and then the tablets containing MCC
were stored for relatively long period (i.e., 3 months) to intentionally cause structure
variation of the cellulose structure depending on the level of the applied grinding. The
moisture-absorbability of stored tablets showed an obvious variation depending on the
grinding time. Substantial changes in the NIR spectral features were also observed
when the MCC went through the grinding. The positional shifts of the crystalline and
amorphous peaks revealed that the grinding process substantially disintegrated the
crystalline and generated glassy amorphous structure of MCC. Additionally, the
molecular level findings derived from NIR spectra and morphological information from
scanning electron microscopy (SEM) lead to comprehensive picture of the system
alternation caused by the storage for 3 months. These results indicate that the
molecular-level variation of excipient induced by the grinding changes the
pharmaceutical product performance, which, in turn, can be controlled by the grinding
2. Experiment
2.1
MaterialsMCC, CEOLUS® (PH-101), was purchased from Asahi Kasei Chemicals Co., (Tokyo,
Japan). AAP, 4-acetamidophenol, was purchased from Tokyo Chemical Industry Co.,
Ltd. (Tokyo, Japan). All reagents were used without further purification. Their
chemical structures are shown in Figure 2-1.
2.2
Sample PreparationGround MCC samples were prepared by a vibration sample mill, TI-100 (Cosmic
Mechanical Technology Co., Ltd., Fukushima, Japan), fitted with a porcelain rod for 0,
20, 40, and 60 minutes, respectively. Total 1 g AAP and 4 g ground MCC were mixed.
Then 200 mg of the mixture powder were compressed to make a set of tablet with a
manual tableting machine, HANDTAB-100 (Ichihashi-Seiki Co., Ltd., Kyoto, Japan), at
a fixed pressure level, and several tablets were made per grinding condition. The
powder was placed inside the die of 8 mm diameter. The 10 kN pressure was
gradually applied to the upper punch to circumvent the generation of unwanted
frictional heat. Pressure was released immediately after reaching 10 kN. No
temperature and relative humidity kept at approximately 24˚C and 60%, respectively.
2.3
Moisture-absorption AnalysisThe moisture-absorption analysis was carried out using tablets stored for three
months under the usual laboratory conditions, approximately 24˚C and non-controlled
humidity. The tablets were dried with a vacuum drying oven, DP23 (Yamato
Scientific Co., Ltd., Tokyo, Japan), for 48 hours at 25˚C. Then, each tablet underwent
moisture absorption experiment by a moisture sorption analyzer, IGAsorp (Hiden
Isochema Ltd., Warrington, UK) (N = 1). The increase in the weight caused by the
transient moisture-absorption was monitored at the fixed temperature 25˚C and relative
humidity 95%.
2.4
X-ray Computed TomographyX-ray computed tomography (CT) images of the tablets were scanned by a X-ray
computed tomograph equipment, SKY SCAN 1172 (Bruker microCT, Kontich, Belgium) equipped with Cu tube, with a spatial resolution of 5.5 µm and rotation step of 0.40° (N = 1). The X-ray sauce was operated with a tube voltage of 60kV and current of 100 µA.
2.5
Scanning Electron MicroscopyScanning electron microscopy (SEM) photographs of the ground MCC and the tablet
surface were taken with a scanning electron microscope, SU 1510 (Hitachi
High-Technologies Co., Tokyo, Japan) (N = 1). The ground MCC was coated with a
palladium gold layer using an ion sputter, E-1010 (Hitachi High-Technologies Co.,
Tokyo, Japan), with 15mA for 120 seconds. The tablets were measured without
sputtering after 3 months’ storage under the usual laboratory conditions, approximately
24˚C and non-controlled humidity.
2.6
Near-infrared SpectroscopyNIR diffuse reflectance spectra of the tablets were collected by a FT-NIR imaging
system, Spotlight 350 (PerkinElmer, Inc., MA, USA) over the 7500 – 5500 cm-1 region
(N = 1). Note that the tablets were measured without further vacuum drying before the storage. NIR spectra were measured in 500 × 500 µm region of the tablet surface with a spatial resolution 25 µm/pixel for each tablet, which resulted in approximately 450 spectra per a tablet. Each spectrum was collected with a 16 cm-1 resolution by
2.7
X-ray Powder Diffraction AnalysisX-ray powder diffraction (XRD) profiles of the ground MCC were recorded using an
X-ray diffractometer, RINT-ULTIMA III (Rigaku Co., Tokyo, Japan). The diffracted
intensity under Cu Ka radiation (40 kV and 50 mA) was measured with scan range of 5
- 40° and scan step of 0.02° at scan rate of 2°/min.
3. Results and Discussion
3.1
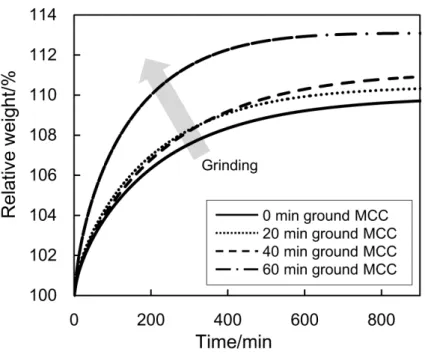
Moisture-absorbability of TabletsWater absorption to the tablets was measured by the moisture-absorption analysis.
The analysis was carried out using tablets stored for three months under the usual
laboratory conditions. The moisture-absorbability of each tablet is shown in Figure
2-2. When exposed to the controlled atmosphere, the tablet started to absorb water
molecules to increase its relative weight. The way for the tablet to absorb water is
essentially influenced by the physical or chemical property of the tablet. For example,
one can find that the relative weight of each tablet showed an obvious increase at the
more pronounced with the grinding. The grinding mostly induced the substantial
change in MCC and it led to a variation of the water-absorption behaviors.
It is important to point out here that the grinding process essentially works to
pulverize the particles, the particle size of MCC, thus, can be reduced by grinding. For
example, Figure 2-3 shows SEM images of the MCC powder samples. Brightly-lit
clumps in the figures represent massively coagulated MCC particles. It is noted that
the size of the clump was clearly decreased with the application of the grinding. It is,
thus, likely that the particles were pulverized by the grinding.
The effect of the grinding on the tablet density was explored by X-ray CT. Figure
2-4(a) shows top-view images of inside of tablets by X-ray CT. The brightness of CT
image reflects a difference in the density of material. The gray level of each pixel in
the CT images corresponds to the X-ray attenuation, which reflects the proportion of
X-ray scattered or absorbed as it passes through each voxel.33 X-ray attenuation is
primarily a function of X-ray energy along with the density and composition of the
material. For example, dark pixels in Figure 2-4(a) represent low density region, and
brighter pixels, in contrast, represent high density region. Thus, the X-ray CT images
reflect a difference in the tablets density. It is important to note that, seemingly, no
specific difference in the density. Such observation becomes even more obvious when
one look at the porosities of the images. Figure 2-4(b) shows the porosities estimated
by binarization of three-dimensional images. Note that the porosity, defined as the
ratio of pixels having binary value 0 or 1, was calculated after the binarization with a
threshold set to be one- fifth of the maximum intensity of the image. Interestingly, no
significant difference in the porosities of tablet can be observed regardless of MCC
grinding time as excepted. In fact, the corresponding weights and volumes of the
tablets provided also less significant differences (data not shown). It is, thus, likely
that the particle size reduction by grinding does not provide substantial change in the
tablet density.
Figure 2-5 shows SEM images of the tablet surfaces. Note that the SEM
observation was carried out using tablets stored under the same condition as tablets used
in moisture-absorption analysis, i.e. three months’ storage under the usual laboratory
conditions. Comparison of these SEM images provides useful information about the
difference in the surface morphology between the tablets. For example, one can find
that the several cracks appeared on the tablet containing MCC ground for 40 minutes.
Importantly, the cracks on the tablet containing MCC ground for 60 minutes then
development of the cracks is mostly explained as spontaneous swelling of the tablets.
After the manipulation of the tablet, the tablet gradually started to absorb atmospheric
moisture. The excessive increase in the volume by the swell often generates cracks on
the surface of the tablet. The development of such rough surface was followed by the
penetration of the water molecules into the matrix and thus accelerated water absorption.
Consequently, the grinding is more or less associated with the surface roughness, which,
in turn, affects the moisture-absorption of the tablet.
Altogether, it is likely that the difference in the moisture-absorbability is closely
related not to the density but to the structure change of MCC induced by the grinding.
While above observation reveals macroscopic picture of the system, unfortunately, the
moisture-absorption and SEM images do not provides any useful information on the
molecular-level alternation essentially governing the change in the actual
pharmaceutical property of the tablets.
3.2
Molecular-level Variation of Ground Microcrystalline Cellulose in TabletsSo far, it has been revealed that the grinding induced significant variations of the
morphology of the tablets and it eventually affected the moisture-absorbability. Thus,
in-depth understanding of the variation caused during the storage. It should be pointed
out that the spectra were measured before the storage for 3 months. After the storage,
the tablet showed different morphological and pharmaceutical variation depending on
the grinding time. Thus, the analysis of the NIR spectra of the tablet before the storage
may provide key information about the origin of the observed alternation caused during
the storage. The average spectra derived from the each tablet are shown in Figure
2-6(a). The pure spectra of the AAP and MCC are presented for reference in Figure
2-6(b). The peaks observed in this region are specific to the vibration modes of AAP
and MCC. For example, the peak at 6970 cm-1 is assignable to the first overtone of the
OH stretching mode of OH groups in the amorphous region of MCC with weak
hydrogen bonds.34 The peak at 6300 cm-1 is ascribed to hydrogen-bonded OH groups
in the crystalline region of MCC.34-36 The peak at 6395 cm-1 is probably assignable to
the first overtone of the OH stretching mode of AAP.37 In Figure 2-6(a), a significant
increase of the spectral intensity was observed in the whole range of the NIR region
with grinding. This may be explained as the increase of the light scattering, which
eventually brings the baseline fluctuation. It is also important to note that the peaks in
Figure 2-6(a) were embedded by the overlap, making the identification of the intensity
useful to elucidate meaningful variation of spectral intensity by removing the unwanted
baseline change and resolving the overlapped feature of an NIR spectrum. For
example, Figure 2-6(c) represents the second derivative spectra calculated from the
spectra in Figure 2-6(a). Now one can find that the spectra were free from the
intensity variation arising from the scattering. It is also noted that the peaks were
clearly resolved, enabling to sort out the intensity variation by the grinding. In Figure
2-6(c), the amorphous peak at 6970 cm-1 became much larger negative value when the
grinding is applied. Such change in the intensity can be explained as the gradual
increase in the content of the amorphous structure. In contrast, the increase in the
intensity of the crystalline peak at 6300 cm-1 indicates that the grinding decreases the
quantity of the crystalline structure. It is also interesting to point out here that the AAP
peak at 6395 cm-1 also showed an obvious variation of the spectral intensity, while the
AAP in the tablets did not undergo the grinding treatment. Such change in the AAP
peak may be interpreted to mean that the increased surface roughness scattered the NIR
light and prevented its penetration and, thus, it finally provided an apparent variation of
the quantity of the AAP as well as MCC in the tablets depending on the grinding time.
Consequently, it is very likely that the change of the spectral intensity reflects not only
densities of the tablets were equivalent regardless of MCC grinding time, it is
reasonable to conclude that the difference in surface roughness of the tablets caused the
unwanted fluctuation of the spectral intensity and, unfortunately, the fluctuation can not
be removed completely even though the spectrum is subjected to second derivative.
Such observation indicates that the assumption, that the change in the spectral intensity
purely reflects the structural variation of the crystalline structure of the MCC, is now on
a very shaky ground. Alternative analytical approach which does not depend on the
spectral intensity is required.
Physical transitions of components usually result in the systematic alteration of
vibrational spectroscopic features.38 Vibrational frequency for a diatomic molecule
can be described as a function of reduced mass and bonding force constant, which is a
measure of the strength or rigidity of a chemical bond in its normal equilibrium
position.32,39 For example, the degree of molecular-level interactions such as hydrogen
bonding often influences the band position of a vibrational spectrum. The
development of crystalline structure consisting of the hydrogen bonding between
adjacent polymer chain results in the decrease in the force constraint of OH bonds.
Consequently, the increase in the degree for hydrogen bonding can be observed as a
molecular structure in turn can be readily detected as a form of band position shift such
as a red or blue shift. Importantly, the change in the band potion shift is less
influenced by the variation of the spectral intensity. It becomes possible to extract the
key information concerning the structural alternation of the system without being
hampered by the fluctuation of the spectral intensity.32, 39 For example, peak positions
concerning the crystalline band observed over the entire surface plane of the tablet
ground for (a) 0 and (b) 60 minutes are shown in Figure 2-7. Note that the intensities
at each coordinate (X- and Y-axis) means the wavenumber where the peak maximum is
observed. The wavenumber of the band position was estimated in more detail by zero
crossing points of third derivative of the raw spectra with data interpolation. The main
motivation of using third derivative here is to enhance spectral resolution by
mathematical treatment based on zero crossing technique.32 It can enhance small level
of a band shift (e.g. less than spectral resolution) which cannot be readily detected in a
typical stack of one dimensional spectrum. Comparison of the figures reveals that the
entire plane shown in Figure 2-7(a) was mainly covered with darker color, suggesting
most of the crystalline bands were located at the lower wavenumber positions. The
entire plane shown in Figure 2-7(b), in contrast, was filled with the brighter color,
frequency shift to the higher wavenumber can be interpreted as substantial decrease of
molecular interaction, i.e. crystalline structure, the result can be explained as the
disintegration of the crystalline component. Figure 2-8 represents the averages and
standard deviations of band positions of (a) crystalline and (b) amorphous peak derived
from the every individual tablet. As expected, the crystalline peaks obvious shifted to
the higher wavenumber direction due to the disintegration of the ordered structure.
The amorphous peak, in contrast, gradually shifted to the opposite direction, suggesting
increase in the population of the disordered (i.e., less interacted) structures. Such shift
in the opposite manner can be interpreted as the development of the glassy amorphous
component. It is, therefore, likely that the grinding disintegrates the crystalline
structure of the MCC and the decrease in the crystalline content is compensated by the
development of the disordered amorphous structure.
Such conclusion derived from the analysis of the NIR spectra is clearly supported by
the XRD patterns of the MCC powder samples shown in Figure 2-9(a). The crystalline
structure of cellulose provided distinct peaks at 15°, 16.4° and 22.5°. While it was not
clearly observed in the XRD pattern, it is known that the amorphous component also
generates a halo peak around 21°.40 The peaks at 15°, 16.4° and 22.5° showed a
mostly reflects the fact that the crystalline structure was disintegrated by the grinding
and this was followed by the development of disordered amorphous structure. The
crystallinity of MCC powder calculated from the XRD patterns is shown in Figure
2-9(b). Note that the crystallinity was calculated as the ratio of the crystalline and
amorphous components by using a curve-fitting method.40 As expected, the
crystallinity showed a gradual decrease with the grinding. This result agrees with that
derived from the band shift analysis of NIR spectra.
3.3
The Effect of Crystallinity of Microcrystalline Cellulose on Moisture- absorbability of the TabletsNow the results derived from above observations brought together provide an
inserting opportunity to derive a more comprehensive picture of the system. MCC
consists of crystalline and disordered amorphous structures. Some mechanical forces
essentially disintegrate the crystalline structure and generates mobile amorphous. The
crystalline structural change of MCC may affect the way to absorb water molecules
because the ability for MCC to absorb water is closely related to its polymeric structure.
In fact, we revealed that the amorphous component of MCC tends to bind water
consider the importance of the grinding. In our case, the visual inspection of Figure
2-7 clearly reveals that the grinding disintegrated the crystalline structure and generated
amorphous component over the entire surface plane of the tablets. The predominant
development of the amorphous should be followed by the spontaneous absorption of
even more water molecules during the storage. The swelling caused by the water
absorption generated the rough surface on the tablet, which, in turn, increased the
moisture-absorbability of tablet. Consequently, it can be concluded that the
disintegration of crystalline structure of MCC by grinding process decreased the
physical stability of the tablets and subsequently increased the moisture-absorbability of
tablet. These results are useful for the control of the pharmaceutical product
performance by grinding process.
4. Conclusion
In this study, we investigated an effect of grinding on moisture-absorbability of
tablets containing MCC. The ability for the tablets to absorb water molecules was
increased depending on the grinding of MCC. The SEM observation of the tablet
accelerated the penetration of water molecules into the tablet. Then, the variation of
polymeric structure of the MCC induced by the grinding was explored by NIR
spectroscopy. NIR spectra analysis based on band position shift provided key
information related to the crystalline structure of MCC in tablets. Namely, it was
revealed that the grinding process substantially disintegrated the crystalline and
generated the glassy amorphous structure of the MCC over the entire surface plane of
the tablet. The predominant development of the amorphous should be followed by the
spontaneous absorption of even more water molecules when exposed to the open
atmosphere for relatively long period. The water absorption swelled the tablet and
generated the rough surface on the tablet, which, eventually, increased the
moisture-absorbability of the tablet. These results indicate that the pharmaceutical
product performance can be influenced by the physical properties of the excipient,