令和2年度博士学位論文
シクラメンの花色生合成に関わる分子生物学的
解析
Study on Molecular Mechanism of Flower
Coloration in Cyclamen
埼玉工業大学 大学院工学研究科 博士後期課程
生命環境化学 専攻
指導教員 秦田 勇二 教授
I Contents List of abbreviation ... 1 Abstract ... 4 Chapter 1 Introduction ... 6 1.1 Anthocyanin ... 6
1.1.1 The structure of anthocyanin ... 6
1.1.2 The biosynthetic pathway of anthocyanin ... 8
1.2 The main factors related to anthocyanin-based flower color formation ... 11
1.2.1 The structural genes involved in anthocyanin biosynthesis ... 11
1.2.2 The transcription factors involved in anthocyanin biosynthesis ... 15
1.2.3 The co-pigment ... 16
1.2.4 Other factors ... 17
1.3 Research progress on molecular breeding of cyclamen flower color ... 18
Chapter 2 Isolation and analysis of flavonoid 3’-hydroxylase (F3’H) genes involved in flower coloration from Cyclamen ... 22
2.1 Introduction... 22
2.2 Materials and methods ... 24
2.2.1 Plant materials ... 24
2.2.2 Characterization of anthocyanidin composition ... 25
2.2.3 Extraction of genomic DNA ... 25
2.2.4 Extraction of total RNA ... 26
2.2.5 Synthesis of first-strand cDNA ... 28
2.2.6 Isolation of STRF3’H genes... 28
2.2.7 Bioinformatics analysis of STRF3’H sequences ... 31
2.2.8 Genomic PCR of STRF3’Hs ... 31
2.2.9 Amplification of STRF3’5’H and corresponding genomic sequence ... 32
2.2.10 Expression pattern analysis of STRF3’H genes ... 32
2.2.11 Expression of STRF3’Hs in E. coli ... 33
2.3 Results and discussion ... 37
2.3.1 Anthocyanins in the petals of STR ... 37
II
2.3.3 Structural features and homology analysis of STRF3’H protein... 41
2.3.4 Genomic structure analysis of STRF3’Hs... 43
2.3.5 Genomic PCR of CperF3’5’H ... 44
2.3.5 Expression pattern of STRF3’Hs ... 50
2.3.6 Expression analysis of F3’Hs and F3’5’H in C. persicum and STR ... 51
2.3.7 In vitro expression of STRF3’Hs ... 56
2.4 Concluding remarks ... 59
Chapter 3 Identification of 5-O-glucosyltransferases involved in anthocyanin biosynthesis from Cyclamen purpurascens ... 61
3.1 Introduction... 61
3.2 Plant materials ... 64
3.3 Method ... 65
3.3.1 Extraction of genomic DNA ... 65
3.3.2 Extraction of total RNA and synthesis of first-strand cDNA ... 65
3.3.3 Isolation of Cpur5GT genes ... 65
3.3.4 Bioinformatics analysis of Cpur5GT genes ... 65
3.3.5 Cpur5GT genes expression analysis ... 66
3.3.6 Protein expression and purification ... 66
3.3.7 Enzyme assay of Cpur5GT2 ... 67
3.4 Results and discussion ... 70
3.4.1 Cloning and biochemistry analysis of Cpur5GTs ... 70
3.4.2 Expression pattern of Cpur5GT genes ... 76
3.4.3 Expression of recombinant Cpur5GT2 in vitro ... 78
3.4.4 Enzyme assay of recombinant Cpur5GT2 ... 78
1
List of abbreviation
3GT/UFGT: Flavonoid 3-O-glycosyltransferase
5GT/A5GT: Anthocyanin 5-O-glycosyltransferase
5’RACE: 5’ Rapid amplification of cDNA ends
7GT: Flavonoid 7-O-glycosyltransferase
ANS: Anthocyanin synthase
Amp: Ampicillin
AT: Anthocyanin acyltransferase
bp: Base pair
BSA: Bovine serum albumin
cDNA: Complementary deoxyribonucleic acid
C4H: Cinnamic acid hydroxylase
CHI: Chalcone isomerase
CHS: Chalcone synthase
CIA: Chloroform/isoamyl alcohol (24:1)
CoA: Coenzyme A
CTAB: Cetyltrimethylammonium bromide
Cy3G: Cyanidin 3-glucoside
Cy3,5dG: Cyanidin 3,5-diglucoside
CYP: Cytochrome P450
D.W: Distilled Water
DEPC: Diethyl pyro carbonate
Dp3G: Delphinidin 3-glucoside
Dp3,5dG: Delphinidin 3,5-diglucoside
DFR: Dihydroflavonol reductase
2
DHM: Dihydromyricetin
DHQ: Dihydroquercetin
dNTP: Deoxy-ribonucleotide triphosphate
eEF1α: Elongation factor-1α
EDTA: Ethylene diamine tetra acetic acid
ER: Endoplasmic reticulum
F3H: Flavanone 3-hydroxylase F3’H: Flavonoid 3’-hyroxylase F3’5’H: Flavonoid 3’,5’-hyroxylase FLS: Flavonol synthase FNS: Flavone synthase GT: Glycosyltransferase GST: Glutathione transferase
HPLC: High performance liquid chromatography
IPTG: Isopropyl-β-D-thiogalactopyranoside
LB: Luria-Bertani medium
Mv3G: Malvidin 3-glucoside
Mv3,5dG: Malvidin 3,5-diglucoside
MT: Methyltransferase
NADPH: Nicotinamide adenine dinucleotide phosphate
OD: Optical density
ORF: Open reading frame
PAL: Phenylalanine lyase
PCI: Phenol/Chloroform/Isoamyl alcohol (25:24:1)
PCR: Polymerase chain reaction
Pg3G: Pelargonidin 3-glucoside
Pg3,5dG: Pelargonidin 3,5-diglucoside
3
Pn3G: Peonidin 3-glucoside
Pn3,5dG: Peonidin 3,5-diglucoside
Pt3G: Petunidin 3-glucoside
Pt3,5dG: Petunidin 3,5-diglucoside
PSPG: Plant secondary product glycosyltransferase
RNase: Ribonuclease
SDS: Sodium dodecyl sulfate
SDS-PAGE: SDS- polyacrylamide gel electrophoresis
SOC: Super optimal broth with catabolite repression
SOPMA: Self-optimized prediction method with alignment
UDP: Uridine diphosphate
4
Abstract
Cyclamen is one of the world’s best-selling potted plants due to better ornamental traits and simple cultivation management. Most of the current ornamental cyclamen cultivars are obtained from a single wild species, purple flower Cyclamen persicum (C. persicum, 2n = 2x = 48), through natural variation and the hybridization of mutants. These cultivars are always rich in colors, mainly because of an important group of flavonoids, anthocyanin. Investigate the molecular mechanism of cyclamen flower color formation, get the information about genes related to anthocyanin biosynthesis is of great significance for molecular breeding of new varieties with novel colors.
5
than that in C. persicum. All the results suggested F3’H is likely taking an active role in pigmentation in STR. We also constructed the recombinant expression vector pET21a-STRF3’H1, pET21a-STRF3’H2a, pET21a-STRF3’H2b and determined the best conditions for protein induction, which provided a basis for analyzing the function of STRF3’H gene and identifying the enzyme activity of STRF3’H in vitro.
In order to enhance the commercial value of the ornamental cyclamen, researchers are also committed to cultivating cyclamen with various colors and fragrances. The wild species, Cyclamen purpurascens (C. purpurascens), which has a sweet fragrance, had been applied to horticulture breeding of cyclamen. Interestingly, all the F1 progenies of the cross between C. purpurascens and C. persicum cultivars contain 3,5- diglucoside type anthocyanins in petals, same to C. purpurascens (the major pigment is malvidin 3,5-diglucoside) (Takamura et al. 2005). Anthocyanin 5-O-glucosyltransferase (A5GT) is responsible for glycosylation at the 5-O-position to generate more stable 3,5-diglucoside type anthocyanins. It is indicated that the expression of A5GT in petals is dominant, even in the cross of C. purpurascens and C. persicum cultivars. This time we isolated two complete ORFs of A5GT genes from C. purpurascens. By analyzing the deduced amino acid sequences, phylogenetic relationships and expression patterns, we concluded that Cpur5GT2 is more likely to encode a typical A5GT, so a prokaryotic expression vector of Cpur5GT2 was constructed and the enzyme assay was performed in vitro. The outcomes revealed that Cpur5GT2 has a valid enzymatic activity for anthocyanin glycosylation and may make positive contribution to cyclamen coloration.
Keywords: Cyclamen; pigment; anthocyanin; flower color; flavonoid 3’-hydroxylase;
6
Chapter 1 Introduction
Flower is one of the most attractive organs of ornamental plants, and flower color is one of the most direct ornamental characters. Novel flower color can not only enhance the ornamental value of plants, but also bring potential commercial value. The formation of plant flower color mainly depends on three types of plant pigments, carotenoids, flavonoids and betalains. Carotenoids include carotene and xanthophyll, which are fat-soluble pigments that exist in the cytoplasm in a deposited or crystalline state, and usually causing the pigments in the plants to be yellow, orange, or red (Tanaka et al. 2008). Betaines are water-soluble nitrogen-containing pigments that exist in most families of the Caryophyllales and a class of fungi. At present, the known betaines can be divided into the yellow etaxanthins and red betacyanins (Strack et al. 2003). Flavonoids are widely distributed in plants and are secondary metabolites of water-soluble aromatics. They are mostly found in cell vacuoles (Tanaka et al. 2008). When the light passes through the petal pigment layer, part of it is absorbed, and part is reflected by the sponge tissue, and then enters people’s eyes through the pigment layer, forming the impression of flower color. The appearance of flower colors is closely related to the types and contents of pigments, and is also affected by the pH of vacuoles, types and concentrations of metal ions, co-pigments and environmental factors.
1.1 Anthocyanin
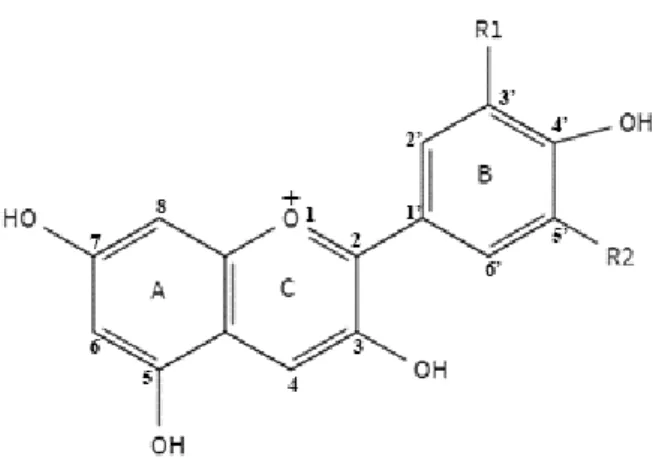
1.1.1 The structure of anthocyanin
7
Anthocyanins exist in different structural forms in different pH environments. Usually, they are stable at low pH, and their stability decreases rapidly at high pH and even degrades. The presence of anthocyanins gives plants a variety of colors, which enriches the ornamental value of plants and also plays pushing role in the reproduction and evolution of species, for examples, attract pollinators and seed dispersers (Huits et al. 1994), protect plants from UV radiation (Bieza et al. 2001), participate in the synthesis of plant hormones (Winkler et al. 1995), against phytopathogens as the phytoalexin (Nicholson et al. 1992; Dixon et al. 1999) and so on.
8
1.1.2 The biosynthetic pathway of anthocyanin
9
diversity modification will be carried out. These modifications depend primarily on UDP‐ glycose‐dependent glycosyltransferase (GT), anthocyanin acyltransferase (AT) and methyltransferase (MT). Each site undergoes glycosylation, acylation and methylation modification to form a variety of different anthocyanin types, which make plants show various colors (Winkel-Shirley, 2001). Finally, anthocyanins are transported to the vacuole for storage and play a physiological role with the assistance of vacuolar transport proteins, such as glutathione transferase (GST). The anthocyanin biosynthetic pathway in higher plant can be divided into three synthetic branch pathways: pelargonidin-based pathway (orange red to brick red), cyanidin-based pathway (pink to red) and delphinidin-based pathway (violet to blue). And these three pathways do not necessarily coexist in the same plant, for example, many plants in nature do not have blue flowers, due to the lack of delphinidin branching pathway, such as carnation and rose (Holton and Tanaka 1994; Mol et al. 1999; Yoshida et al. 2009); cymbidium and petunia lack brick red/orange varieties because they do not have pelargonidin-based anthocyanins (Johnson et al. 1999; Forkmann and Heller 1999).
Fig 1-1. The basic structure of anthocyanin.
10
11
1.2 The main factors related to anthocyanin-based flower color
formation
1.2.1 The structural genes involved in anthocyanin biosynthesis
In ornamental plants with anthocyanin as the main pigment, the type and content of anthocyanin are the main factors that determine the final appearance of anthocyanin. Different kinds of anthocyanins show different colors, and when the content of the same anthocyanin changes, the color will change accordingly. For example, when the content of cyanidin gradually increases, the color gradually changes from light red to dark red. This is usually related to the expression of structural genes and/or regulatory factors related to anthocyanin biosynthesis (Nakatsuka et al. 2005).
12
with TT5 to promote the production of flavonoids (Jiang et al. 2015). When the expression level of CHI gene decreases, chalcone and its derivatives will accumulate, and anthocyanin biosynthesis will be hindered. The inactivation of CHI from onion (Allium cepa) leaded to accumulate of yellow chalcone derivatives, and resulted in a golden mutation in the bulbs of the onion (Kim et al. 2004). Suppressing the expression of CHI in tobacco will affect the accumulation of flavonoids in petals and pollen, resulting in color changes (Nishihara et al. 2005).
F3H catalyzes the hydroxylation of the C3 site of flavanones and synthesizes dihydroflavonol, which is considered to be the central point of the anthocyanin biosynthetic pathway. The cDNA of the F3H gene was originally cloned from Antirrhinum majus (Martin et a1., 1991). Loss of F3H function will hinder the conversion of flavanone to dihydroflavonol, thereby affecting the accumulation of anthocyanins. The mutation of F3H (Transparent Testa 6) in Arabidopsis thaliana leads to a decrease in the pigments in the seed coat, which turns the color of the seed coat gray and white (Peer et al. 2001). Due to the insertion of the retro transposable element TORE1, the ToreniaF3H gene was not expressed in white-flowered torenia, which resulted in a decrease in anthocyanin levels in petals (Nishihara et al. 2014).
F3’H and F3’5’H are belonging to cytochrome P450 enzymes (CYP450s) family that regulate hydroxylation of the B-ring. The degree of B-ring hydroxylation has the greatest effect on anthocyanin-based flower color.
13
lines and produces red flower, on the contrary, overexpression of FLS promotes the accumulation of flavonols and produces white flowers (Luo et al. 2016). The DFR of some plants has strong substrate specificity, which is one of the reasons why plants show different colors. DFR from Petunia cannot catalyze the reduction of DHK to leucopelargonidin, so there is no pelargonidin-based pigment accumulation, and there is no orange-red petunia flower in nature (Forkmann and Ruhnau 1987).
ANS is responsible for catalyzing the oxidation of colorless 1eucoanthocyanidins to produce colored anthocyanidins, which are essential for the formation of plant colors. Mutations in ANS genes can also cause anthocyanins to fail to accumulate normally. Gentian ANS gene mutation causes its flowers to change from pink to white (Nakatsuka et al. 2005). ANS also affects the synthesis of anthocyanins along with upstream and downstream genes. The flowers of forsythia are yellow because of lack of anthocyanins, and mainly accumulate carotenoid xanthophylls. After transformed AmDFR (Antirrhinum majus) and MiANS (Matthiola incana) into forsythia (Forsythia × intermedia cv ‘Spring Glory’, the petals of the transgenic plants were detected with carotene as well as cyanidin-based anthocyanidins, and the flower present a novel bronze-orange color (Rosati et al. 2003).
14
sugar groups generally bind to the hydroxyl group at the C3 position of anthocyanins, and sometimes also bind to the hydroxyl group at the C5 and C7 positions. At present, the most researched is 3GT. Kobayashi et al. (2001) found that 3GT gene was only expressed in red grape variety Vitis Vinifera, but not in white grape. Virus-induced silencing of the RrGT2 gene reduced the accumulation of anthocyanins in the corolla of transgenic tobacco, and tobacco plants showed lighter flowers than normal plants (Sui et al. 2018). Studies on most plants show that the expression level of 3GT is positively correlated with the accumulation of anthocyanins.
MT is one of the key enzymes for anthocyanin modification, and the methylation reaction catalyzed by it contributes to the enrichment of anthocyanin types. Up to date some OMTs have be isolated and confirmed as useful molecular tool for altering and diversifying flower color, such as A3’5’OMT (Nakamura, 2015), PsAOMT (Du et al. 2015), NmATMs (Okitsu et al. 2018).
15
anthocyanin biosynthesis is helpful to understand the formation of metabolites and the “communication” mechanism in the anthocyanin biosynthetic pathway of higher plants. Of course, the universality of the complex in the entire plant kingdom also requires in-depth exploration.
1.2.2 The transcription factors involved in anthocyanin biosynthesis
16
resulting in purple-red leaves in Paeonia (Zhang et al. 2019). bHLH transcription factor is named for its basic helix loop helix (basic helix loop helix) conserved domain. The E Box cis-acting element in the promoter region of the gene encoding key enzyme involved in anthocyanin biosynthetic can be specifically recognized by bHLH transcription factors. The transcriptional core region of WD40 protein is called WD40 motif and consists of 40 amino acid residues. WD40 protein is ubiquitous in plants and plays an important role in regulating plant growth and development. The most common mode of action of these transcription factors is to directly bind to the cis-acting elements in the promoter region of the gene to regulate; the other is to combine with each other to form a ternary transcription protein complex and then jointly regulate. For example, MYB-bHLH-WD40 is the most widely studied and discovered complex that regulate the spatiotemporal expression of genes encoding related enzymes in the anthocyanin biosynthesis (Hichri et al. 2011). Nuraini et al. (2020) found in the study of violet color formation in Matthiola incana, MiMYB1 was a key gene that strictly regulated the biosynthesis of anthocyanins in the petals of Matthiola incana, and the MiMYB1-MibHLH2-MiWDR1 complex can activate the transcription of endogenous enzyme genes such as MiF3’H, MiDFR and MiANS.
1.2.3 The co-pigment
17
FLS genes are mutated, the synthesis of flavones and flavonols is hindered, which may cause flower color changes. There are two different kinds of FNS in the biosynthesis of flavones in plants: FNS I, a soluble dioxygenase, was only described for members of the Apiaceae family; FNS II, belong to cytochrome P450 family, has been found in all other flavone accumulating tissues (Martens and Mithöfer, 2005). In transgenic torenia plants with suppressed FSII expression, accumulation of both flavone and anthocyanin decreased in the petals, and the flower color changed from blue to pale blue (Ueyama et al. 2002). That implied that flavone contributes to the stability of anthocyanin by co-pigmentation of flavone and anthocyanin. Flower color of Petunia changed from violet to pale violet by the expression of the FLS or FNS gene (Tsuda et al. 2004). The content of anthocyanin in the petals of transgenic tobacco expressing OsFLS was significantly reduced, while the content of kaholinol-3-O-rutinoside was significantly increased, and resulting in light pink or white flowers (Park et al. 2019).By regulating the expression of DFR and FLS genes in tobacco, the accumulation of anthocyanin and flavonol can be influenced to produce red or white flowers (Luo et al. 2016). The heterologous expression of MaFLS in tobacco inhibits the expression of NtDFR, NtANS1 and NtANS2, resulting in reduced petal coloration (Liu et al. 2019).
1.2.4 Other factors
18
Anthocyanins are mainly stored in vacuoles of petal epidermal cells, and the pH value of vacuoles also affects the color presentation of anthocyanins. Due to the mutation and inactivation of the Pr gene encoding InNHX1 (vacuolar Na+/H+ exchanger) in Japanese
morning glory, the vacuole PH increases during the flower-opening, and finally its reddish-purple buds changed into reddish-purple flowers (Yamaguchi et al. 2001). In addition, some metal ions could combine with the O-dihydroxyl position of the anthocyanin B ring to form highly colored and stable metal complexes. Sigurdson et al. (2017) complexed different types of cyanidin derivatives with Fe3+, Al3+, and found that both ions can make anthocyanins
produce a certain red shift and color enhancement, but Fe3+ has the most obvious effect.
In addition, anthocyanin synthesis is the result of both internal and external factors. Enzymes encoded by structural genes and regulator genes determined the type of anthocyanin, and environmental factors can not only affect the rate of anthocyanin biosynthetic, but also affect the accumulation and stability of anthocyanin. When anthocyanin is accumulated in plant cells, environmental factors have an effect on its stability, thereby accelerating or slowing down the degradation of anthocyanin.
1.3 Research progress on molecular breeding of cyclamen
flower color
19
more attention to consumers’ preferences and commit to cultivating new varieties with rich and unique ornamental characteristics and high quality. Hybrid breeding is a traditional and important means to create new varieties or types of flowers. It can not only combine the excellent characteristics of two or more varieties, but also produce huge heterosis, improve the growth vigor and stress resistance of flowers. However, there are also some defects in hybrid breeding, such as incompatibility of distant hybridization, difficulty in breaking plant reproductive isolation, long breeding cycle and inconveniency for improvement of single traits. Mutation breeding, which has a relatively short history, is usually performed by radiation mutagenesis and is often combined with tissue culture techniques. It has the advantages of high mutation rate, obtaining more excellent variation types in a short time, etc. But at the same time there are disadvantages such as difficult to grasp the direction of inducing mutation and less favorable variation. With the continuous development of biotechnology, genetic engineering methods have become complementary methods of conventional breeding. It breaks the boundaries of communication between species, provides great potential for improving and modifying flower traits, and provides technical guarantee for directional breeding of flowers. Genetic engineering breeding has also attracted the attention of many cyclamen researchers, especially on the improvement of main ornamental traits.
20
cyclamen is most closely related to anthocyanins, an important class of flavonoids, except for a few yellow varieties whose main component is chalcone. The cultivar ‘Golden Boy’, lacking anthocyanins, has a pale-yellow flower with chalcone 2’-glucoside as a major pigment. ‘Pure White’, lacking anthocyanins, has a white flower with quercetin and kaempferol glycosides (Ishizaka, 2018). Therefore, the use of molecular technology to regulate the synthesis of anthocyanins to create more new colors of cyclamen seems to be a direct and effective choice.
21
22
Chapter 2 Isolation and analysis of flavonoid 3’-hydroxylase
(F3’H) genes involved in flower coloration from Cyclamen
2.1 Introduction
23
these anthocyanins were not detected in Arabidopsis tt7-1 mutant seedlings. Expressing the F3’H gene of Snapdragon Antirrhinum kelloggii in petunia increases the cyanidin content in the transgenic plants and the flower color becomes redder (Ishiguro, 2012). The expression of F3’H in tulips is positively correlated with the accumulation of cyanidin. However, after the insertion mutation of F3’H promoter, its transcriptional activity decreased, which hindered the synthesis of cyanidin in petals, resulting in the production of light-colored varieties (Yuan Y. et al. 2014). F3’H of Euphorbia pulcherrima cultivar ‘Harvest Orange’ contained an insertion of 28 bases, which caused frameshift mutation with a premature stop codon, resulting in nonfunctional enzymes. In the absence of F3’H enzyme activity, the plants have enough pelargonidin precursor to give bracts of ‘Harvest Orange’ rare orange-red color (Nitarska et al,2018). These indicate that regulating the expression of F3’H can indeed regulate the accumulation of anthocyanins in plants, thereby changing the color of plants.But up to now the molecular and biochemical characterization of cyclamen F3’H has almost not been described.
24
2.2 Materials and methods
2.2.1 Plant materials
C. persicum and STR were grown in greenhouse facility at Saitama Institute of Technology. The petals of cyclamen were divided into two parts: a base part known as the “eye”, and all other part of the petal called “slip” (Figure 2-2). Leaf and slips were sampled and immediately frozen in liquid nitrogen then kept at -80 °C until required.
F3’H F3’5’H Dihydromyricetin (DHM) Dihydrokaempferol (DHK) Dihydroquercetin (DHQ)
Fig. 2-1 Schematic diagram of the catalytic reactions of F3’H and F3’5’H in the anthocyanin synthesis pathway
(a) C. persicum (b) ‘Strauss’
Fig. 2-2 The photo of plant materials (a) C. persicum, (b) ‘Strauss’
25
2.2.2 Characterization of anthocyanidin composition
Taking full opened slips of STR as materials, 10% acetic acid by 10 times the volume of fresh weight was added and grinded thoroughly in a mortar, transfer to a centrifuge tube, and centrifuge, 13200 rpm, 15 min, 4 ℃. Aspirate the supernatant, filter it with a 0.22 μm microporous membrane, and store in a refrigerator at 4 ℃, shaded from light. High-performance liquid chromatography (HPLC) was performed. A Prodigy ODS-3 reversed-phase column (4.6 × 100 mm 3 μm 100 Å, Phenomenex) was used to separate the metabolites at 30 ℃. The mobile phase consisted of 1.5% (v/v) phosphoric acid(A), 1.5% (v/v) phosphoric acid, 20% (v/v) acetic acid and 25% (v/v) acetonitrile solution (B). The elution program was proceeded over 60 min at a flow rate of 0.3 ml min-1. Quantify the
reaction products by measuring the absorbance peak area at 530 nm.
2.2.3 Extraction of genomic DNA
26
Vacuum drying. Use 45 μl of TE to dissolve the precipitate, add 5 μl of RNase A (5mg ml -1), and place at 37 ℃ for 1 hour to remove RNA interference.
After the RNase treatment, add equal volumes of Phenol/Chloroform/Isoamyl alcohol (25:24:1) (PCI) (15000 rpm, 5 min, 4℃) and CIA (15000 rpm, 5 min, 4℃) for extraction, and finally recover the supernatant to a new centrifuge tube. Precipitate DNA with 2.5 times volume of 100% alcohol and 1/10 volume of 3 M sodium acetate (NaAc) (15000 rpm, 15 min, 4℃), keep the precipitate, add 500 μl of 70% alcohol for elution (15000 rpm, 5 min, 4℃). Discard the supernatant, dry the precipitate, add an appropriate amount of TE solution to dissolve the precipitate, and finally store at -20 ℃.
2.2.4 Extraction of total RNA
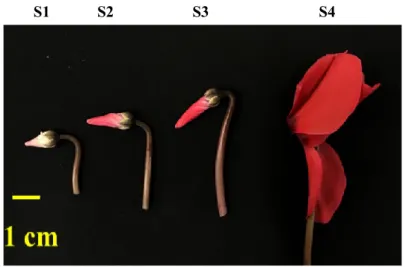
Total RNA was extracted from leaves and the slips at four different floral development stages: 1) bud between 0.2 cm and 0.5 cm; 2) bud between 0.6 cm and 1.0 cm; 3) bud more than 2.0 cm long; 4) full opened flower (Figure. 2-3). The method modified from CTAB method (Chang et al. 1993).
27
M sodium acetate and 2.5 times the volume of 100% Ethanol, centrifuged for 13 000 rpm 40 ℃. Decanted the super natant without disturbing the pellet and subsequently wash with 500 μl 70% ethanol then centrifuge at 15 000 rpm, 4 ℃ for 5 minutes. Removed residual ethanol by drying in a vacuum drying. DNase treatment: added 43 μl of RNase-free water, 5 μl of 10×DNaseI Buffer and 2 μl of DNase Ⅰ (0.2 units/μl), then incubated for 1 hour at 37 ℃ in water bath. Added volumes equal of PCI to RNA sample and centrifuged for 5 min at 15 000 rpm, 4 ℃. Transferred the aqueous upper phase to new microcentrifuge tube, added volumes of equal of CIA to RNA sample and centrifuged for 5 min,15 000rpm, 4 ℃. Ethanol precipitation of RNA: add 3 M sodium acetate solution, 100% Ethanol, centrifuge for 13 000 rpm 4 ℃. Decanted the super natant without disturbing the pellet and subsequently wash with 500 μl 70 % ethanol, then centrifuge at 15 000rpm 4 ℃ for 5min. Removed residual ethanol by drying in vacuum drying. Added 50 μl RNase-free water to dissolve. Store at -80 ℃ until use.
S1 S2 S3 S4
28
2.2.5 Synthesis of first-strand cDNA
First-strand cDNAs were synthesized from 2 μg total RNA extracted from slips of all stages using an oligo (dT)-anchor primer (5’-GAC TCG AGT CGA CAT CGA T17-3’) with
reverse transcriptase according to the manufacturer’s instructions (PrimeScript II 1st cDNA synthesis kit, TaKaRa, Japan). Store the synthesized cDNA at -20 ℃.
2.2.6 Isolation of STRF3’H genes
The degenerate primerswere designed based on the conserved domains of plant F3’H proteins involved in anthocyanin accumulation, such as Arabidopsis thaliana (AtTT7, AF155171, 2000), Petunia (PhF3’H, AF155332, 1999), Centaurea cyanus (CcF3’H, FJ753550,2009) and Vitis amurensis (VaF3’H, FJ645766, 2009). The partial cDNA of the F3’H homologues were isolated from slips of STR by reverse transcription-polymerase chain reaction (RT-PCR). To isolate the putative STRF3’H full-length cDNA, 3’rapid amplification of cDNA ends (RACE) method (Frohman et al. 1988) and 5’-RACE method were carried out by using a 5’/3’-RACE 2nd Generation Kit (Roche, Germany). Four pairs of gene special primers (Table 1.) were designed to amplify the 5’ cDNA ends of STRF3’Hs. To obtain the full-length open reading frames, the cDNA templates were amplified by PCR with the gene-specific primers list in Table 1.
Recovery of PCR products: Gel electrophoresis for PCR products at 220 V for about 20 minutes. Put the gel after electrophoresis under UV light, cut and recover the target band part of the gel as soon as possible. The recovery operation is in accordance with the kit (NucleoSpin® Gel and PCR Clean-up, MACHEREY-NAGEL, Germany).
29
Desalting: Add 20 μl of PCI to the ligation product, mix and centrifuge (15 000 rpm, 4 ℃, 5 min).Aspirate the supernatant and transfer to a new 1.5 ml tube, add 20 μl of CIA, and centrifuge (15,000 rpm, 4 ℃, 5 min). Transfer the supernatant to a new 1.5 ml tube, followed Ethanol precipitation and ethanol rinsing. After drying in a vacuum desiccator for 5 min, add an appropriate amount of TE buffer (PH8.0) to dissolve the precipitate.
Electroporation: Thawed 40 μl of competent cells (Escherichia coli JM109) on ice and added 2 μl of the desalted ligation products, mixed and transferred the mixture to gap of 0.1 cm electrode cuvette. Transformation was performed by electroporation (Gene Pulser Xcell TM), selected the protocol detail screen for E. coli to pulse 1.8 kV. Add 700 ml SOC
medium, repeatedly pipette and aspirate, then transfer all the bacterial liquid to a new centrifuge tube, and incubated for 1 hour in a 37°C water bath. Spread the incubated bacterial solution with 40 μl of5-Bromo-4-chloro-3-indolyl β-d-galactopyranoside(X-gal) (20 mg L-1) and 4 μl of isopropyl-β-D-thiogalactopyranoside (IPTG) (200 mg mL-1) on the
LB medium containing 100 mg ml-1 of Ampicillin (Amp). Place in a 37 °C incubator for 16
hours.
30
reaction program was set as follow: step1,95 ℃ 2 min; step2,95 ℃ 30 s,48 ℃ 30 s, 72℃ 1 min,30cycles; step3, 4 ℃. PCR products were detected by electrophoresis. Take a new test tube and inject 1.5 ml of LB medium containing 100 mg ml-1 of Amp. Transfer
50 ml of LB culture solution containing colony corresponding to the reaction solution with the target band into the new test tube, and culture with shaking at 37 °C, 130 rpm, 16 h.
31 (PH 8.0), store at -20 ℃ until use.
Sequencing: Sequenced by a DNA sequencer (Model 3500, Applied Biosystems, USA) using the Big Dye® Terminator ver. 3.1 Cycle Sequencing Kit (Applied
Biosystems, MA, USA).
2.2.7 Bioinformatics analysis of STRF3’H sequences
Predict the physical and chemical properties and other information by online software ProtParam (http://web.expasy.org/protparam/). Transmembrane domain was predicted by TMHMM (http://www.cbs.dtu.dk/services/TMHMM/). Prediction of protein secondary structure was carried out by Network Protein Sequence Analysis (Combet et al. 2000) using self-optimized prediction method with alignment (SOPMA) (Geourjon and Deléage 1995). Multi-alignment analysis was performed by the ClustalW (Thompson et al. 1994) program, the deduced amino acid sequence of STRF3’H1 and STRF3’H2a, STRF3’H2b were aligned with other F3’H proteins that obtained from the DDBJ/GenBank DNA databases (TT7, AF155171; PhF3’H, AF155332; VaF3’H, FJ645766). Phylogenetic trees were constructed using the Neighbor-Joining method (Saitou et al. 1987) with MEGA7 (Kumar et al. 2016).
2.2.8 Genomic PCR of STRF3’Hs
32
2.2.9 Amplification of STRF3’5’H and corresponding genomic
sequence
STRF3’5’H was cloned from C. persicum (GQ891056). To amplify the corresponding genomic sequence of STRF3’5’H, two pairs of gene-specific primers were used (table 1). For genomic PCR of STRF3’5’H, 0.5 μg DNA extracted from the leaves of STR were used as template, the cycling conditions were as followed: pre-denaturation at 95 ℃ for 2 min, followed by 30 cycles of amplification (30 seconds at 95 ℃, 30 seconds at 60 ℃ and 2 min at 72 ℃), then extension at 72 ℃ for 7 min, at last cooling to 4 ℃.The PCR product was recovered, ligated to the cloning vector and sequenced; the methods were as 2.2.6 described.
2.2.10 Expression pattern analysis of STRF3’H genes
The expression level of STRF3’H genes at different flowering stages as well as the expression level in leaves were detected by real-time PCR. Real-time PCR was conducted on the Quant Studio™ 1 System using the standard cycling mode with PowerUpTM SYBR®
Green Master Mix (Thermo Fisher Scientific). Each 20 μl reaction contained 100 ng of cDNA (template), 10 μM of primer, and 10 μl of 2× Master Mix. The eEF1a genes of STR were amplified as an internal control under the same conditions. Each experiment was done in duplicate and repeated at least twice, 2−ΔΔCT method was used to analyze the relative
expression level of target genes (Livak and Schmittgen 2001).
The transcription level of F3’H genes and F3’5’H in STR and C. persicum were also analyzed by real-time PCR. The detection was performed on the EcoTM Real-Time System
with Brilliant III Ultra-Fast SYBR® Green QPCR Master Mix (Agilent Technologies),
33
experiment was conducted in four replicates, and relative gene expression was determined using the 2−ΔΔCT method (Livak and Schmittgen 2001).
2.2.11 Expression of STRF3’Hs in E. coli
Take the cDNA of F3 H1, F3’H2a, F3’H2b as the template respectively and use the gene-specific primer with the restriction site (forward with BamHI site and reverse with SacI site) for PCR amplification. Subcloned the amplified fragments into the pTAC-2 vector (Takara), and sequenced to confirm that the sequences were correct. Excised these target fragments by BamHI/ SacI double digestion and ligated in to pET21a (+) vector (Novagen) digested in advance by the same enzymes. Ligation system according to the ligation high (Toyobo, Japan) instructions. Transform the ligation mixture into E. coli DH5α (Nippon Gene, Japan) competent cell by heat shock method, and spread the bacteria with recombinant plasmid on LB medium containing AMP (100 mg ml-1). After the plaque
grows, pick a single clone to extract the plasmid and sequence. The operation method is as described above. Transfer the correctly sequenced recombinant plasmid, pET21a-STRF3’H1, pET21a-STRF3’H2a, pET21a-STRF3’H2b to E. coli BL21(DE3) (Novagen). Take pET21a-STRF3’H1 as an example:
Pre-culture: Inoculate single colonies to 2 ml LB broth with 100 mg ml-1 AMP
incubated at 37 ℃ 16 hours. Take 20 μl of the cultured bacteria liquid and add it to 2 ml LB liquid medium containing AMP (100 mg ml-1), and cultivate at 37 °C until OD600
reached 0.4-0.6.
Main culture: Add IPTG to a final concentration of 100 μM, 500 μM, respectively, and further culture the cells at 20 ℃, adjust the incubation time for10 h, 16 h, 20 h.
34
remaining 700 μl bacterial solution to the centrifuge tube, and suspend the precipitate. Add 70 μl of Fast BreakTM Cell Lysis Reagent (Promega), mix by inversion for 40 minutes, then centrifuge at 132 000 rpm, 4 ℃, 15 min, transfer the supernatant to a new 1.5 ml tube, and store it at 4 ℃ together with the tube containing the precipitate.
Purification of soluble protein: the fusion protein was purified utilizing the His LinkTM
Spin Protein Purification System (Promega) following the kit instruction.
SDS-PAGE: Add 50 μl of 10 mM-Tris-HCl buffer solution to the insoluble protein and stir until the precipitate is dissolved. Take 15 μl of insoluble protein, soluble protein, and purified protein, respectively, mix with 5 μl of loading buffer to SDS-PAGE electrophoresis. After completion of electrophoresis, SDS-PAGE electrophoretic gel was stained with Coomassie Brilliant Blue R250 and eluted with eluent (25 ml methyl alcohol, 35 ml acetic acid, Milli-Q water up to 500 ml).
Mass cultivation and expression: Inoculate single colonies of E. coli BL21(DE3) harboring pET21a-STRF3’H1 plasmid to 2 ml LB broth with 100 mg ml-1 AMP incubated
at 37 ℃ 16 hours. Take 500 μl of the cultured bacteria liquid and add it to 50 ml LB AMP (100 mg ml-1) liquid medium, and cultivate at 37 °C until OD600 reached 0.4-0.6. Add
35 Table 1 . Primers used in chapter 2.
Primer Sequence (5’-3’) For 5’RACE C.perF3’H1-RP TTAAGCCTGGTAAACTTCCTTAGCG C.perF3’H1-RP1 ATCAGCATTGGGCCTTTCG C.perF3’H1-RP3 CTCCTTGATGATGGCTTGTAGG STRF3’H1-RP5 CCGTGTTTCTGGTCACTTCC STRF3’H1-RP6 CCAACATTACACGTCCTAGC STRF3’H1-RP7 GTGCGTCTTCAGAAACTTGG STRF3’H2-FP2 CAAGATGAAGAAGCTTCACC STRF3’H2-RP4 TCTCCTAAACACACAGCTTGC STRF3’H2-FP3 ATATGTTCACAGCCGGAACG STRF3’H2-RP3 GCGAATGTGACGAAAGTCATCC
For isolation of ORFs
STRF3’H1-FP ATGTCTACTTTGGGACTCACACTATTC
STRF3’H1-RP TTAAGCCTGGTAAACTTCCTTAGCG
STRF3’H2-FP ATGTTCTCTCCCAGCCTCG
STRF3’H2-RP TTAAACCTGGTAAACATGGGTC
For Real time-PCR
C.purF3’5’H-FP ATGGCACTAGACATAGTCTTGC C.purF3’5’H-RP TTAAGCAACATAGGCACTTGGG C.perF3’H1-FP3 TTGGTAGTTGGCCAAAACCG
37
2.3 Results and discussion
2.3.1 Anthocyanins in the petals of STR
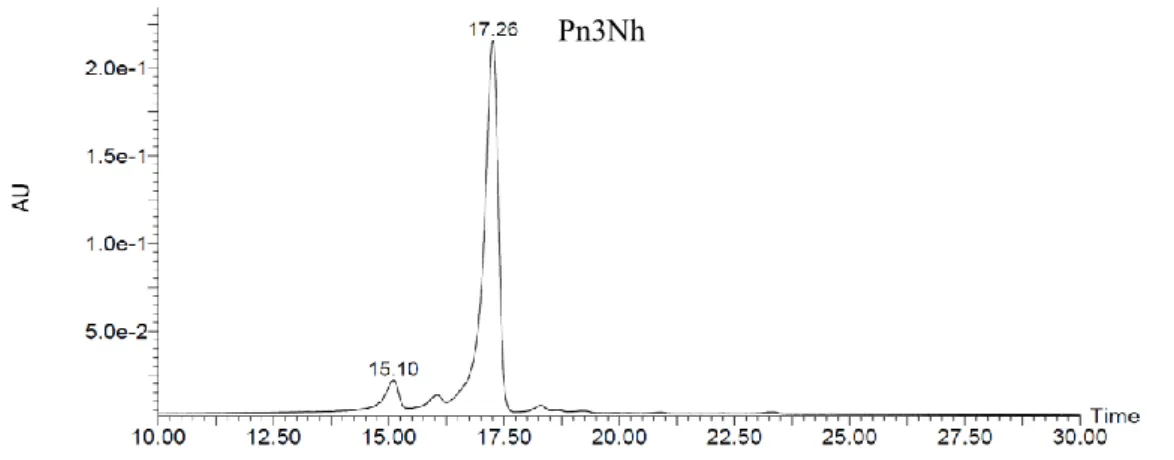
HPLC analysis of the pigments extracted from STR slip showed a particularly main peak, which was identified as Pn3Nh the major anthocyanin of STR (Figure. 2-4). However, the main anthocyanin component of C. persicum was identified as Mv3,5dG (Ishizaka, 2018). The precursors of these two pigments are cyanidin and delphinidin respectively. F3’H and F3’5’H are key enzymes at the branch of cyanidin and delphinidin synthetic pathway. It suggested that the red mutant of STR may be related to F3’H and / or F3’5’H.
2.3.2 Isolation and sequence analysis of F3’H genes from STR
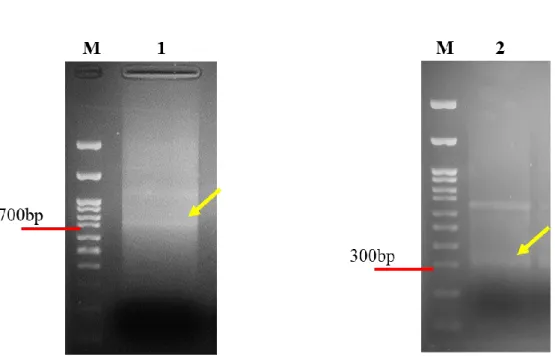
Two fragments of F3’H (STRF3’H1 and STRF3’H2) were obtained from STR slips by degenerate PCR. The 5’ end sequences of STRF3’H1 was amplified by 5’RACE, the first amplification was about 700 bp, and the second amplification was about 300 bp (Figure. 2-5). The full-length cDNA of STRF3’H1 was preliminarily obtained by splicing the two
Fig. 2-4 Anthocyanins in the slips of ‘Strauss’, analyzed by HPLC chromatogram and detected at 530 nm
38
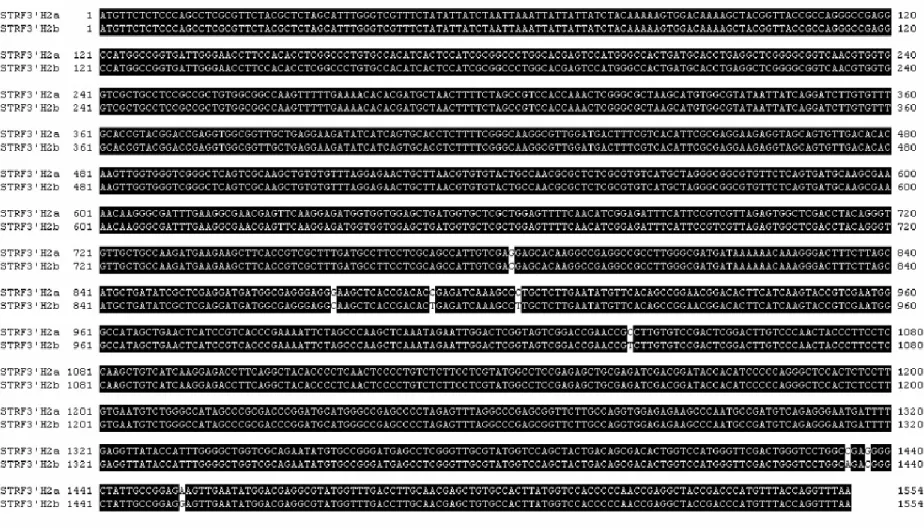
sequences. Then gene-special primers were designed between start codon (ATG) and stop codon (TAA), to sequencing the ORF in segments, finally got the confirmed ORF of STRF3’H1. The 5’ end sequences of STRF3’H2 was also obtained by 5’RACE twice (Figure. 2-6). Gene-specific primers were designed based on the preliminarily obtained sequence, and the first strand of cDNA generated by reverse transcription was used as a template for amplification, finally two full-length ORFs (STRF3’H2a and STRF3’H2b) were obtained.
39
Fig. 2-5 Electropherogram of STRF3’H1 gene 5’RACE.
M, 100bp DNA marker; 1, The first amplified fragment; 2, The second amplified fragment
Fig. 2-6 Electropherogram of STRF3’H2 gene 5’RACE.
40
41
2.3.3 Structural features and homology analysis of STRF3’H protein
Three candidate genes deduced to encode 507, 517, 517 amino acids separately. The predicted molecular weights of these three amino acids were 56.1, 56.9, 56.9 kDa, and the calculated isoelectric point were 6.82 ,7.03, 6.66, respectively. The instability index (II) of F3’H1 was computed to be 34.49, which can be classified as a stable protein. On the contrary, F3’H2a and F3’H2b were classified as unstable protein because the instability index (II) was computed to be 41.26 and 40.97. The grand average of hydropathicity (GRAVY) of F3’H1 was computed to be -0.010, which is a hydrophilic protein. However, the GRAVY of both F3’H2a and F3’H2b was computed to be 0.031, which means that they are hydrophobic proteins.
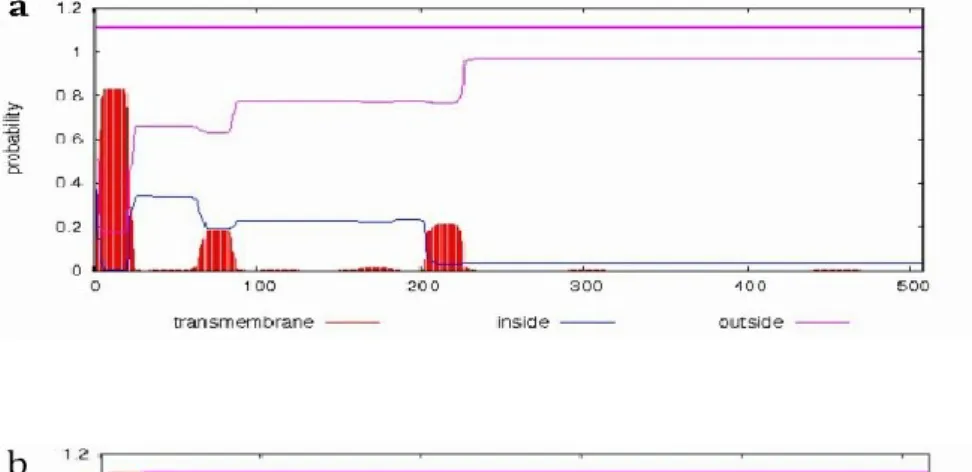
SOPMA predicted that the secondary structure of STRF3’H1 is mainly made up of alpha helix (46.75%) and random coils (37.08%), while extended strands (10.45%) and beta turn (5.72%) only occupied a small part. STRF3’H2a and STRF3’H2b also have similar structural characteristics. STRF3’H2a is composed of alpha helix (46.81%), random coils (35.98%), extended strands (11.80%) and beta turn (5.42%). STRF3’H2b is composed of alpha helix (47.39%), random coils (36.56%), extended strands (11.61%) and beta turn (4.45%). TMHMM online analysis of the amino acid sequences showed that STRF3’H2a and STRF3’H2b have parallel structures, both of them have a transmembrane domain located at S5 to T27, the part of M1 to P4 located inside the microsomal membrane, K28 to
V517 located outside (Figure. 2-8a, b). However, the prediction also showed that STRF3’H1
42
the N-terminal transmembrane signal anchor domain to exert physiological functions (Murakami et al. 1994). From amino acid sequence alignment, the N-terminal of F3’H1 was five amino acid residues less than that of F3’H2a and F3’H2b. Does this affect the anchoring of F3’H1 on membrane thus the structure and function? Actually, the functional analysis based only on the amino acid sequence is not very rigorous, and functional verification of F3’H is still needed.
The amino acid sequence alignment of STRF3’H1, STRF3’H2a, STRF3’H2b with TT7 from Arabidopsis showed 68.2%, 66.4% and 66.2% identities; with PhF3’H (Petunia hybrida) showed 70.8%, 70.3% and 70.1% identities; with VaF3’H (Vitis amurensis) showed 75.5%, 75.4% and 74.8% identities (Figure. 2-9). And it’s obvious that all three deduced protein sequences contain several domains highly conserved in plant F3’Hs. Three F3’H-specific conserved motifs were found in STRF3’Hs amino acid sequence. All of three STRF3’H amino acid sequences have the motif that exactly same as “VVVAAS” (Brugliera et al. 1999), but “GGEK” was present at G417GER420 of STRF3’H1, “VDVKG” were
present at “A423DVRG427” of STRF3’H1, “A433DVRG437” of STRF3’H2a and STRF3’H2b.
In addition, four cytochrome P450-specific conserved motifs were also found. The heme domain “FGAGRRICAG”, which is considered to be responsible for the enzyme to bind carbon monoxide (Werck-Reichhart et al. 2002), was present in all three sequences. STRF3’Hs also bear the conserved motif “AGTDTS”, forming an oxygen-binding pocket, which is required for its catalytic activity (Chapple 1998). There is an E356-R359-R398
(STRF3’H1) trinity forms a pocket lock motif to stabilize the core structure, while it also presents at STRF3’H2a, STRF3’H2b “E366-R369-R408” (Hasemann et al. 1995). The
43
transmembrane domain located at the 5th to the 27th amino acid, while F3’H1 may not. According to amino acid sequence alignment, the N-terminal of F3’H1 was 5 amino acid residues less than that of F3’H2a and F3’H2b. Whether this affects the anchoring of F3’H1 on the membrane and thus affects its structure and function needs to be further explored. “GGEK” is a unique motif to F3’H, an important feature that distinguishes them from their close relatives F3’5’H (Brugliera et al. 1999). But in sorghum and other monocots (except rice), it mostly presented as “GGSH” (Boddu et al., 2004). In this study the F3’H unique motif in STRF3’H1 presented as “GGER”, which were also found in Vitis vinifera (Castellarin et al. 2006), Antirrhinum kelloggii (AB547161) and other plants.
A phylogenetic tree of several reported plant F3’H and F3’5’H protein sequences was shown in figure 2-10, STRF3’H1, STRF3’H2a, STRF3’H2b were clustered in the CYP75B clade together with other F3’Hs but further from Cyclamen F3’5’H group in evolutionary distance. The phylogenetic tree and multiple alignment strongly suggested that STRF3’H1, STRF3’H2a, STRF3’H2b encodes a typical flavonoid 3’-hydroxylase.
2.3.4 Genomic structure analysis of STRF3’Hs
44
position is relatively conservative. Most of the first intron is located 400-500 bp after the start codon. The number of introns of the plants F3’H gene is not fixed neither. It is common to have two introns, such as the F3’Hs of grape (Jeong et al. 2006), morning glory (Hoshino et al. 2003), apple (Han et al. 2010), while the Poaceae usually have one intron, like F3’H of sorghum (Boddu et al., 2004). According to a recent report, GbF3’H1 cloned from Ginkgo biloba L. also contains only one intron (Wu et al., 2020). Many plants have multiple introns in the F3’H gene, for example three introns in Arabidopsis thaliana TT7 (AF155171) and three in Brassica napus F3’H (Xu et al. 2007). In a rare case, IbF3’H gene (Ipomoea batatas L. Lam) has no introns (Zhou et al. 2012).
Differences in STRF3’Hs between ‘Strauss’ and C. persicum were investigated at the genomic level. The same four sets of STRF3’H1-specific primers were used to amplify the entire F3’H1 of C. persicum, and four DNA fragments of the same size as those amplified from ‘Strauss’ were obtained (Figure. 2-11b). The analysis of STRF3’H2a, 2b also presented the similar results (Figure. 2-12b).
2.3.5 Genomic PCR of CperF3’5’H
45
Fig. 2-8 Predicted transmembrane structure domain of STRF3’H1(a), STRF3’H2a (b),
46
Fig. 2-9 Multiple alignment of the deduced amino acid sequences of F3’H1, F3’H2a, F3’H2b from STR and Arabidopsis TT7 (AF155171),PhF3’H (AF155332), VaF3’H (FJ645766). The F3’H-specific motifs “VVVAAS”, “GGEK”, and “VDVKG” are
47
Fig. 2-10 Phylogenetic tree analysis of STRF3’H and other known F3’Hs and F3’5’Hs. Vertical line indicates F3’Hs isolated from STR in this study. CsF3’H, Camellia
48
b. a.
Fig. 2-12 Genomic analysis of STRF3’H2a and STRF3’H2b. (a) The genomic structures of STRF3’H2a and STRF3’H2b. The open boxes indicate exons, the shadowed boxes indicate introns. There are 8 bp differs in their 3rd exon. Boxes A, B, C and D indicate the amplified regions that separate STRF3’H2a/b into four parts. (b) Genomic PCR of four separated regions of STRF3’H2a/b in ‘Strauss’ and C. persicum. A, B, C and D are as shown in (a).
Fig. 2-11 Genomic analysis of STRF3’H1. (a) The genomic structures of STRF3’H1. The open boxes indicate exons, the shadowed box indicate introns. Boxes A, B, C and D indicate the amplified regions that separate STRF3’H1 into four parts. (b) Genomic PCR of four separated regions of STRF3’H1 in ‘Strauss’ and C. persicum. A, B, C and D are as shown in (a).
49
Fig. 2-13 Genomic analysis of CperF3’5’H. (a) The genomic structure of CperF3’5’H. The open boxes indicate exons, the shadowed box indicate intron. Boxes E and F indicate the amplified regions that separate CperF3’5’H into two parts. (b) Genomic PCR of two separated regions of CperF3’5’H in ‘Strauss’ and C. persicum. E and F are as shown in (a).
a.
50
2.3.5 Expression pattern of STRF3’Hs
51
The expression of STRF3’H genes was detected in the leaves.STRF3’H2a in leaves expressed weaker than that at stage1 and stage2, but stronger than the full-opened stage. STRF3’H2b in leaves expressed weaker than stage1, but higher than the other three stages. The expression level of STRF3’H1 was higher than that of any flowering stage. High expression of F3’H has also been detected in the leaves of other plants, such as Arabidopsis (Schoenbohm et al. 2000), Perilla (Kitada et al. 2001) and Azalea (Nakatsuka et al. 2008). The expression levels of GbF3’H1 in ginkgo leaves were significantly higher than that in flowers, roots and other tested tissues, which because of this expression is associated with the secondary metabolism product accumulation in the corresponding organs (Wu et al., 2020). Although we know that the expression of F3’H is related to the accumulation of anthocyanins, there is almost no accumulation of anthocyanins in leaves, which may be caused by insufficient expression of other genes in the anthocyanin synthesis pathway (Noda et al. 2004). On the other hand, this also suggests that F3’H plays a role in the synthesis of other secondary metabolites.
2.3.6 Expression analysis of F3’Hs and F3’5’H in C. persicum and
STR
52
Variation in flower color is generally the result of differences in either structural or regulatory genes involved in the flavonoid biosynthetic pathway (Tanaka et al. 2008). Compared with C. persicum, STR has a completely different main anthocyanin composition, so we compared the expression level of key genes related to their main anthocyanin synthesis. The expression level of F3’5’H in C. persicum was higher than that in STR, and the main anthocyanin component of C. persicum was Mv3,5dG. Previous study revealed that F3’5’H is responsible for synthesizing delphinidin and its derivatives, F3’5’H gene encoding this enzyme often referred to as the blue gene (Holton et al. 1994). Some plants, such as chrysanthemums, roses and carnations etc., cannot produce blue or purple flowers, partly because they lack the activity of the F3’5’H enzyme (Tanaka and Brugliera 2013). Loss of endogenous F3’5’H transcript will cause the flower color of cyclamen to change from purple to red/pink (Boase et al. 2010). In the present study, is the reduced expression level of F3’5’H of STR responsible for the lack of Mv3,5dG accumulation in its flowers? There are two main causes of defective gene expression, one is a mutation in the gene itself and the other is a mutation in the transcription factor that regulates the expression of that gene. For example, due to the insertion of a retrotransposon in the first exon, RsF3’H (Raphanus sativus L.) lost its function and promotes the accumulation of pelargonidin-bases anthocyanin (Masukawa et al. 2018). We investigated the differences in CperF3’5’H between C. persicum and STR at the genomic level, and found no difference. Therefore, whether the apparently reduced expression of F3’5’H in STR is caused by the mutation of the associated transcription factors needs to be further explored.
53
flavonoids towards the synthesis of cyanidin-based anthocyanins (Olsen et al. 2010). The Arabidopsis transparent testa 7 (tt7) mutant that has no F3’H function exhibits a yellow seed coat, and the anthocyanin accumulation level of the mutant plant is lower compared to wild species (Schoenbohm et al. 2000). Castellarin et al. (2006) found that the expression of F3’H was associated with the accumulation of cyanidin-based anthocyanins in the berry skin of grapevines. Overexpression of F3’H gene in I. nil cultivar ‘Violet’ can change the flower color of ‘Violet’ that lacks F3’H function from red to blue (Takatori et al. 2015). A recent study found that an indel in PsF3’H (Paeonia suffruticosa Andr.) affects the synthesis of cyanidin-based anthocyanins, and this may be the reason of the low anthocyanin content in acyanic petals. RcMF3’H1 was related to synthetic cyanidin-based red anthocyanins (Zhang et al. 2020). In this study the high expression level of F3’Hs and
54
55
Fig. 2-15 Expression analysis of F3’H genes, F3’5’H gene in C. persicum and STR. (a) STRF3’H1 (b) STRF3’H2a (c) STRF3’H2b (d) F3’5’H
eEF1α gene was amplified as an internal control. The error bar represents the standard error.
56
2.3.7 In vitro expression of STRF3’Hs
The recombinant vectors (STRF3’H1, STRF3’H2a, pET21a-STRF3’H2b), were constructed and sequenced, and the sequences of the inserted genes were determined to be accurate. Transformed the plasmids with correct sequence into E. coli BL21(DE3) by heat shock, prepare for protein induction expression.
57
Fig. 2-16 SDS-PAGE analysis of the recombinant pET21a-STRF3’H2a
Lane M: molecular mass marker; lane1, supernatant after 0 M IPTG induction; lane 2, supernatant after 0.1 mM IPTG induction; lane 3, supernatant after 0.5 mM IPTG induction; lane 4, supernatant after 1 mM IPTG induction; lane 5, purified supernatant after 0.5 mM IPTG induction. Induction condition: 20 ℃, 16 h.
48 kDa 63 kDa
Fig. 2-17 SDS-PAGE analysis of the recombinant pET21a-STRF3’H2b
Lane M: molecular mass marker; lane1, supernatant after 0 M IPTG induction; lane 2, supernatant after 0.1mM IPTG induction; lane 3, supernatant after 0.5 mM IPTG induction; lane 4, purified supernatant after 0.5 mM IPTG induction.
Induction condition: 20 ℃, 16 h. 48 kDa
58
Fig. 2-18 SDS-PAGE analysis of the recombinant pET21a-STRF3’H1
Lane M: molecular mass marker; lane1, supernatant after 0 M IPTG induction; lane 2, supernatant after 0.1mM IPTG induction; lane 3, supernatant after 0.5 mM IPTG induction; lane 4, precipitation after 0 M IPTG induction; lane 5, precipitation after 0.1mM IPTG induction; lane 6, precipitation after 0.5mM IPTG induction.
59
2.4 Concluding remarks
F3’H and F3’5’H are the key enzymes involved in anthocyanin biosynthesis, which affect the direction of pigment formation and the type of final pigment.In this study, three ORFs of F3’H gene were cloned from STR by RACE method.The results of real-time PCR showed that the expression level of STRF3’Hs were the highest at the early stage of flower development, decreased with flower development and reached the lowest at the flowering stage. Therefore, we speculate that STRF3’Hs are involved in the formation and accumulation of anthocyanin precursors.STRF3’Hs also expressed strongly in leaves with very low anthocyanin content, which indicates that F3’H also plays an important role in other secondary metabolism pathways besides anthocyanin.
60
61
Chapter 3 Identification of 5-O-glucosyltransferases involved in
anthocyanin biosynthesis from Cyclamen purpurascens
3.1 Introduction
In different plants, the biosynthesis of anthocyanins undergoes different modifications, including glycosylation, methylation, acylation and so on (Yamazaki et al. 1999). Through the synergistic effects of these modifications, more diverse kinds of anthocyanins can be formed, so as to present a variety of floral colors. However, glycosylation always precedes other modifications, and it plays a constructive role in changing the hydrophilicity of anthocyanins, increasing their solubility and chemical stability, as well as facilitating their storage and transport in cells (Vogt and Jones, 2000). In plants, these glycosylation reactions are controlled by a specific family of glycosyltransferases (GTs). GTs is a multi-member family of transferases widely existing in organisms that catalyze the formation of glycosidic bonds between specific glycosylates and receptors (Meech et al. 2019). According to the similarity of sequence, conserved motifs and catalytic mechanism, GTs can be classified into 111 subfamilies (http://www.cazy.org/fam/acc_GT.html).
62
pigmentation in corn kernels, was later shown to encode a flavonoid glycosyltransferase (UFGT) (Dooner & Nelson, 1977). UGTs have different regional selectivity in flavonoid glycation reactions. According to the different catalytic sites, UGT can be divided into 3-O-glycosyltransferase, 5-3-O-glycosyltransferase, 7-O-glycosyltransferase and the glycosyltransferase that catalyzes the generation of diglycosides. For example, anthocyanin 3’,5’-O-glucosyltransferase (UA3’5’GT) cloned from the petals of Clitoria ternatea L., could catalyze the glycosylation of 3’-OH position and 5’-OH position of delphinidin glucoside successively to produce delphinidin 3-O-(6’’-O-malonyl)-β-glucoside-3’,5’-di-O-β-glucoside (Kogawa et al. 2007). In addition, flavonoid C-glycosyltransferase has also been isolated from some plants (Noguchi et al. 2008; Brazier-Hicks et al. 2009; Falcone Ferreyra et al. 2013).
63
(Ju et al. 2018). It can be concluded from the above relevant studies that the expression level of A5GT is correlated to the accumulation of major pigments in these plants, and A5GT from different plants has a wide range of substrate specificities. But as far as we know, A5GT of cyclamen has hardly been characterized.
Cyclamen is loved by people because of its rich ornamental trait, and is widely used in potted plants and garden greening. Most of commercial cultivars are obtained through the natural mutation and hybridization of wild Cyclamen persicum, they always have various color, shape, size, but no-good fragrance (Grey-Wilson 2002). Another wild species, C. purpurascens, is considered a precious material for the cultivation of aromatic cyclamen. However, in the early days, it was difficult to cross between C. purpurascens and C. persicum cultivars, because C. purpurascens always have very small and few flowers. Furthermore, histological observation showed that the fertilized ovule in C. purpurascens and C. persicum cultivars cross combination contained weak hybrid embryos without endosperm, and the endosperm eventually aborted (Ishizaka, 2018). To solved the problem of strong cross-incompatibility with C. persicum and other species, Ishizaka and Uematsu (1992) established the ovule cultivation system, which is a valuable method for creating interspecific Cyclamen hybrids. Subsequently, chromosome doubling technology overcomes seed sterility caused by lack of affinity between different genomes (Ishizaka and Uematsu 1995b). So far, C. purpurascens can really be used in the cultivation of fragrant cyclamen. Interestingly, all the F1 progenies of the cross between C. purpurascens
64
a deep purple eye with malvidin 3,5-diglucoside, although the mainly pigment of ‘Strauss’ is Pn3Nh (Takamura et al. 2004). Fragrance cyclamen cultivar ‘Kaori-no-mai’ (KM), produced by crossing of C. persicum cultivars and C. purpurascens, accumulated Mv3,5dG as a dominant anthocyanin component and present purple-colored flower. While its ion beam-irradiated mutant ‘Mayabi-no-mai’ (MY), with red-purple-colored flower, accumulated malvidin 3-glucoside (Mv3G) (Ishizaka et al. 2012). It seems that the deletion of A5GT gene caused the change of flower color of MY and A5GT may make positive contribution to cyclamen flower color formation. Previously, three 5GT-like genes (Cpur5GTs) have been isolated partially from C. purpurascens. Among them, Cpur5GT2 was most likely to be a functional A5GT (Hase et al. 2012). This time we isolated the full-length ORF of Cpur5GT2 and analyzed the enzyme activity in vitro.
3.2 Plant materials
Cyclamen was grown in greenhouse at Saitama Institute of Technology, Japan. The petals, leaves, immature anthers, and petioles of C. purpurascens were collected and immediately frozen in liquid nitrogen then stored at - 80 °C until required.
65
3.3 Method
3.3.1 Extraction of genomic DNA
Genomic DNA was extracted from leaves of C. purpurascens. Detailed descriptions as 2.2.1.
3.3.2 Extraction of total RNA and synthesis of first-strand cDNA
Total RNA was extracted from different tissues (young petals, full-opened petals, immature anthers, leaves and petioles) of C. purpurascens. RNA extraction method and cDNA synthesis are detailed in 2.2.2 and 2.2.3.
3.3.3 Isolation of Cpur5GT genes
Based on the obtained gene fragments (Cpur5GT1, Cpur5GT2 and Cpur5GT3) (Hase et al. 2012), 3’ RACE and 5’ RACE methods were carried out using the 5’/3’-RACE 2nd Generation Kit (Merck, Germany), to amplify unknown sequence upstream and downstream of Cpur5GTs. Gen-special primers were designed to obtained the full-length ORFs (Table 2). The amplified target gene fragments were subjected to gel recovery, ligated to pTAC-2 Easy vector (BioDynamics Laboratory Inc., Japan), transformed into E. coli JM109 competent cells, screened with blue and white spots, finally positive clones were picked for sequencing (Model 3500, Applied Biosystems) using the BigDye® Terminator
ver. 3.1 Cycle Sequencing Kit (Applied Biosystems, MA, USA).
3.3.4 Bioinformatics analysis of Cpur5GT genes
66
and chemical properties and other information by online software ProtParam (http://web.expasy.org/protparam/). Protein the secondary structure prediction was carried out by Network Protein Sequence Analysis (Combet et al. 2000) using self-optimized prediction method with alignment (SOPMA) (Geourjon and Deléage 1995). The transmembrane regions of proteins encoded by Cpur5GT1 and Cpur5GT2 were predicted by online tool TMHMM (http://www.cbs.dt u.dk/services/TMHMM/). Multi-alignment analysis was performed by the Clustal W program (Thompson et al. 1994), the deduced amino acid sequence of Cpur5GTs were aligned with other A5GT proteins that obtained from the DDBJ/GenBank DNA databases. Phylogenetic trees were constructed using the Neighbor-Joining method (Saitou et al. 1987) with MEGA7 (Kumar et al. 2016).
3.3.5 Cpur5GT genes expression analysis
To investigate the expression levels of the isolated Cpur5GT genes in different tissues (young petals, full-opened petals, immature anthers, leaves and petioles), real-time PCR were performed on the Quant Studio™ 1 System with Power Up™ SYBR® Green Master Mix (Thermo Fisher Scientific). The reaction system in a total volume of 20 μl containing 100 ng of template cDNA, 10 μM of primer, 10 μl of 2 × Master Mix, and implemented under the standard cycling mode. The eEF1α genes were amplified as an internal control under the same conditions. Each experiment was done in 4 replicates, 2−ΔΔCT method was
used to analyze the relative expression level of target genes (Livak and Schmittgen 2001). See 2.2.6 for specific operation steps.
3.3.6 Protein expression and purification
67
and ligated at NdeI and BamHI restriction sites with ligation high (Toyobo, Japan). Transformed the recombinant expression vector pET16b-Cpur5GT2 into E. coli strain BL21 (DE3) competent cells (Novagen). Picked the single colony of E. coli BL21 (DE3) embracing the reconstructed plasmids and cultured at 37 ℃ in LB liquid medium containing 100 μg ml-1 AMP untilled the OD
600 was about 0.4-0.6, next induced the
expression of the fused protein with 5 μM, 10 μM, 20 μM IPTG at 28 ℃ for 16 h. Recovered the expressed product, resuspended in Fast BreakTM Cell Lysis Reagent (Promega) then
purified the fusion protein utilizing the HisLinkTM Spin Protein Purification System
(Promega) in terms of the manufacturer’s protocol. Used SDS-PAGE (15%) to detect the expression of the target protein, took the uninduced recombinant expression vector as a control. After determining the induction concentration of IPTG, perform a mass expression, see 2.2.10 for specific operations. Protein of mass expression was purified with Capturem
TM His-Tagged purification maxiprep columns.
Quantification of purified protein, refer to Bradford method (Bradford 1976). Prepare dye reagent (Bio-Rad protein assay, USA) in a volume of 1:4 dye reagent and deionized water, and filter through Whatman #1 filter. Prepare five BSA (Bio-Rad protein assay, USA) standards of different concentrations (0.078 mg ml-1, 0.156 mg ml-1, 0.39 mg ml-1, 0.78 mg
ml-1) to make a standard curve. Pipet 100 μl of each standard and sample solution into a
clean test tube. Add 5.0 ml of diluted dye reagent to each tube and mix. Incubate at room temperature for 10 min. Measure absorbance at 525 nm. Make a standard curve and calculate the sample concentration.