1
Title of Thesis
Developing a High-Rate Two-Stage Anaerobic Digestion Model to Deal with Biodegradabl e Municipal Solid Waste
生物分解性都市ごみを対象とした高速二段嫌気性消化モ デルの開発
PhD Dissertation 2019 July
By
PHAM VAN DINH
Supervisor
Prof. TAKESHI FUJIWARA
Graduate School of
Environmental and Life Science (Doctor’s Course)
OKAYAMA UNIVERSITY
A
Acknowledgement
I am appreciated to many people whose support, advice and encouragement allowed me to complete this work.
Firstly, I would like to express my sincere and honest thanks to my supervisor Prof. Takeshi FUJIWARA who took me to Okayama University and helped me open a new research direction.
His academic guidance, technical support, advice and patience during my study deserve all my gratitude. His strictness and high requirement demands in the study have pushed me to go forward ahead. More importantly, he always encouraged and respected my own research viewpoints. Some crucial requirements beyond my hands, Prof. Fujiwara did not hesitate to contact other labs to provide the best working conditions for me. I have learnt many valuable things from him. I would also like to thank my co-supervisors, Prof. Katsuya KAWAMOTO and Assoc. Prof. Yasuhiro MATSUI for valuable academic comments and suggestions during my research. Without their supports, the completion of this thesis would not have been possible I am incredibly thankful to Prof. Naoki NISHINO for his essential supports. He allowed me using GC analyzer in his lab to perform the VFAs analysis. Especially under his guidance, his students, Mr Qui and Ms Thuong, helped me identify the microorganism in my bioreactors.
Without their precious support, it would not be possible to conduct this research.
My sincere thanks are addressed to Prof. Hideaki NAGARE for allowing me to use TOC analyser in his lab and his guidance support in use.
I would like to express my deep gratitude to Director MUROYAMA for giving me a chance to do an internship in Sanyo Mitsui Co., Ltd. The jobs that I was experiencing, the places I visited, all was very impressive. Especially the staffs in the company, they inspired me working harder.
I am thankful to Japanese Government (Monbukagakusho: MEXT) scholarship program and Okayama University for giving me fundamental academic knowledge and financial supports that I otherwise would not have been able to develop my scientific discoveries
My gratitude also extends to my lab-mates for supporting my living in Japan. The most important their friendliness, kindness, and communication helped me have an exciting and fun experience in the lab.
Special thanks to my family members for lots of spiritual support. They always stand beside me and encourage whatever I pursue. Last but not least, I wish to thank my loving and supportive wife, Quynh, and my beautiful baby, Nhat Mai, who provide endless motivation in my work.
I wish to acknowledge all people, whom I might not have mentioned here and who either directly or indirectly give me their thoughtfulness and encouragement.
B
Abstract
Solid waste generation is an inevitable consequence of human activities and has been rapidly increasing in recent years. Remarkably, biodegradable municipal solid waste (BMSW) was often reported to account 50-60% total municipal solid waste, which has been landfilling for many years. That has caused various issues that threaten the environment and public health.
Therefore, researchers have been urged to search for high feasible methods to deal with BMSW.
Within sustainable solutions, anaerobic digestion (AD) systems which convert biodegradable waste into energy gas, have particularly attracted attention within the scientific community.
In my study, a new AD system has been developed based on current potential techniques.
The factors affecting the operation of the developed system has been discussed to find out its suitable operation range. This dissertation covered five following chapters:
Chapter 1 – A review of anaerobic digestion systems for biodegradable waste:
Configurations, operating parameters, and current trends. This chapter showed that two-stage anaerobic digestion (TAD) system, which separates sensitive methanogenesis and insensitive hydrolysis in two different reactors, is the most potential technique. Especially, methanogenic reactors using granular sludge have super high load threshold. However, applying TAD with granular sludge to deal with BMSW has not been studied yet.
Chapter 2 – Developing a new two-stage anaerobic digestion system. In which, the granular sludge has been employed with the desire to achieve both high stability and high organic loading rate. However, this study used a different principle compared to the current technics. Instead of using a high-speed flow to increase contact between granules and substrates, this study wanted to operate at a low-speed flow. Therefore, the granules settled down at the bottom of the reactor to create an anaerobic filter zone. A fine biomass (suspended sludge) layer was also maintained at upper the granular filter zone. The anaerobic bacteria in this layer would decompose the rest of the substrate. Especially, biogas gas generated at high-speed would help to form a fluidized zone resulting in well contact between the rest of the substrate and suspended sludge. Therefore, the efficiency of the reactor would well at high organic loading rate.
Furthermore, while most studies have employed granular sludge collected from another reactor, anaerobic bacteria in this study was enriched from the digestive bacteria system of horses.
Chapter 3 - Comparison between single- and two-stage anaerobic digestion: Kinetics of methanogenesis and carbon flow. This chapter wanted to verify the performance of the developed TAD system comparing to the conventional single-stage anaerobic digestion (SAD) system. The SAD experiments completed after a long digestion time (143 days) and was
C
characterized by the kinetic rate constant k=0.02 day-1 which was much lower than that in the TAD (k = 0.66-2.16 day-1). The SAD seemed to be inhibited due to the high concentration of free ammonia and low inoculum to substrate ratio. In the SAD, only 17.8-22.3% of the initial carbon could be converted into biogas (equivalent to 91-110 Nml/g-VS) with low methane content (44.1-48.7%). Meanwhile, TAD converted 41.67% initial carbon to biogas (equivalent to 299.0-374.6 Nml/g-VS) with high methane content (71.68-81.0%). Moreover, the methanogenesis in the TAD had high stability which helped it get back to normal state after only several days although the concentrations of the influent increased double in the range of 6.5-24.5 g-COD/l. As these results, the TAD was much more stable, faster, and stronger than that in the SAD.
Chapter 4 studied the effects of pH, HRT, and OLR on the developed two-stage anaerobic digestion system. In the fermentation reactor, increasing pH in the range of 4.5 to 6.5 caused a significant increase in the yield and composition of the fermentative products. Fermentation at pH 4.5 produced 53.88 g-SCOD/g-VS and 25.2 g-VFA/g-VS (49.3%, acetate and propionate).
These concentrations increased gradually up to 64.09 g-SCOD/g-VS and 32.4 g-VFA/g-VS (71.6%, acetate and propionate) at pH 6.5. There was no significant difference between fermentation at pH 6.0 and 6.5. In the methane reactor, biogas yield was in the range of 193.3- 327 Nml/g-TS with 54.2-71.6% of CH4. That was due to the effects of operating parameters.
While pH and HRT showed synergic effects on the performance of methanogenesis, OLR presented antagonistic effects. And the influences of OLRs and HRT was more and more clearly at lower pH of the influent. Working with pH input of 6.0-6.5, the reactor could operate well at a very high OLR (11.4 kg-TS/L/d) even using the shortest HRT (3.5 d). The reactor worked with the pHs below this range would be inhibited significantly. When pH-input at 4.5, the reactor could only work with low OLRs.
Chapter 5 - Influence of the effluent recirculation on two-stage anaerobic digestion of biodegradable municipal solid waste. This chapter introduced the effluent to control pH at the hydrolytic reactor and also dilute hydrolysate concentration. Results in fermentation reactor showed that using the effluent recirculation brought stabilization at the pH 6.5. Meanwhile, without recirculating the effluent, it cost a dose of 76.7 g-NaOH/kg-TS to maintain fermentation at pH 6.5. At a lower alkaline dose of 49.9 g-NaOH/kg-TS caused a decrease of the pH down to 5.5 leading to a reduction of 5.2% TCOD, 5.6% SCOD and 9.6% TVFAs. Continue to recirculate the effluent to dilute hydrolysate at BT increased pH of substrate resulted in having higher performance compared to without the effluent recirculation. Increasing recirculation rate in the range of 0.5-3 at buffer tank led to change the operating parameters of the methane reactor
D
including reducing both input concentration from 71.8 to 26.7 g/L and HRT from 7.02 to 2.63 days. Recirculation rate 2 was the best ratio for operation (TCOD input of 35.2 g-O2/L) to gaining biogas yield of 431.7 Nml/g-VS (64% CH4) and COD removal of 92.7%. At RR 3, contact time between biomass sludge and substrate flow was not long enough. At lower recirculation rates, activities of microorganism were inhibited by direct contact to a high concentration of hydrolysate.
i Table of Contents
List of abbreviations ... iv
List of Tables ... vi
List of Figures ... vii
Chapter 1 - A review of anaerobic digestion systems for biodegradable waste: Configurations, operating parameters, and current trends ... 1
Abstract. ... 1
1.1. Introduction ... 1
1.2. Basics of Anaerobic Digestion ... 3
1.2.1. Biochemical mechanism of biogas production ... 3
1.2.2. Anaerobic reactors ... 6
1.3. Anaerobic Digestion System ... 7
1.3.1. The single-stage systems ... 8
1.3.1.1. The wet single-stage systems ... 8
a. The wet low-rate system ... 8
b. The wet high-rate systems ... 9
1.3.1.2. The dry single-stage systems ... 10
1.3.1.3. Assessments ... 12
1.3.2.1. Configuration of two-stage systems ... 15
1.3.2.2. The hydrolytic/acidogenic reactor ... 16
1.3.3. The methanogenic/acetogenesis reactor ... 18
1.3.2.3. Assessments ... 20
1.3.3. The three-stage systems ... 22
1.3.3.1. Configuration of three-stage systems ... 22
1.3.3.2. Operations ... 23
1.3.3.3. Assessments ... 24
1.4. Current Application and Trends ... 26
1.5. Conclusions and Recommendations ... 28
References ... 29
Supplementary materials ... 39
Chapter 2 – Developing a Two-stage Anaerobic Digestion System ... 43
2.1. Introduction ... 43
ii
2.2. Proposal a two-stage AD system using granular sludge ... 43
2.3. Granular sludge ... 46
2.3.1. Granule structure ... 46
2.3.2. Principle of Granulation process ... 48
2.4. Starting up the system ... 49
2.5. Results ... 52
References ... 53
Chapter 3 - Comparison between Single- and Two-stage Anaerobic Digestion of Vegetable Waste ... 55
Abstract. ... 55
3.1. Introduction ... 56
3.2. Materials and Methods ... 57
3.2.1. Analytical method ... 57
3.2.2. Substrate and Inoculum ... 57
3.2.3. Experiment of single-stage digestion ... 58
3.2.3. Experiment of two-stage digestion ... 59
3.2.5. Kinetic models ... 59
3.3. Results and Discussions ... 60
3.3.1. Single-stage digestion ... 60
3.3.2. Two-stage digestion ... 62
3.4. Conclusions ... 66
References ... 67
Chapter 4 - Effects of pH, HRT, and OLR on Two-Stage Anaerobic Digestion System of Biodegradable Municipal Solid Waste ... 70
Abstract. ... 70
4.1. Introduction ... 71
4.2. Materials and Methods ... 72
4.2.1. Feedstock and inoculum ... 72
4.2.1. Experimental setups ... 72
4.2.2. Chemical analysis ... 73
4.3. Results and Discussion ... 74
4.3.1. Fermentation reactor ... 74
iii
4.3.2. Methane reactor ... 76
4.4. Conclusions and Recommendations ... 79
References ... 80
Chapter 5 - Influence of The Effluent Recirculation on Two-stage Anaerobic Digestion of Biodegradable Municipal Solid Waste ... 83
Abstract. ... 83
5.1. Introduction ... 84
5.2. Materials and Methods ... 85
5.2.1. Feedstock ... 85
5.2.2. Experimental model ... 86
5.2.3. Analytical methods ... 87
5.3. Results and Discussions ... 87
5.3.1. Comparison between recirculation and without recirculation of the effluent. ... 87
5.3.2. Effects of the recirculation rate on methane reactor ... 89
5.4. Conclusions and Recommendations ... 91
References ... 91
APPENDIX ... 94
iv
List of abbreviations
AB Anaerobic baffled
AC Anaerobic contact
AD Anaerobic digestion
AFB Anaerobic fixed bed
BMSW Biodegradable municipal solid waste
BT Buffer tank
C/N Carbon to nitrogen
CMT Complete mixed tank
COD Chemical oxygen demand
CSTR Continuous stirred tank reactor
EB Expanded bed
EGSB Expanded granular sludge bed
FAN Free ammonia
FB Fluidized bed
FW Food waste
HR Hydrolytic reactor
HRT, RT Hydraulic retention time
IC Internal circulation
LW Livestock waste
MR Methane reactor
MSW Municipal solid waste
OFMSW Organic fractions of municipal solid waste OLR Organic loading rate
RH Rice husk
RT Retetion time
SAD Single-stage anaerobic digestion
SCOD Soluble COD
SRT Solid retention time
T Temperature TAD Two-stage anaerobic digestion
v
TC Total carbon
TCOD Total COD
TS Total solid
UASB Upflow anaerobic sludge blanket VFAs Volatile fatty acids
VS Volatile Solid
VW Vegetable waste
WPF Wet plug-flow
vi List of Tables
Table 1.1. Comparison between wet and dry single-state digestion systems ... 13
Table 1.2. Illustrative examples of the applications of the single-stage anaerobic digestion 14 Table 1.3. Illustrative examples of the applications of the two-stage anaerobic digestion ... 21
Table S3. Configurations of a three-stage system ... 23
Table 1.4. Illustrative examples of the applications of the three-stage anaerobic digestion .. 25
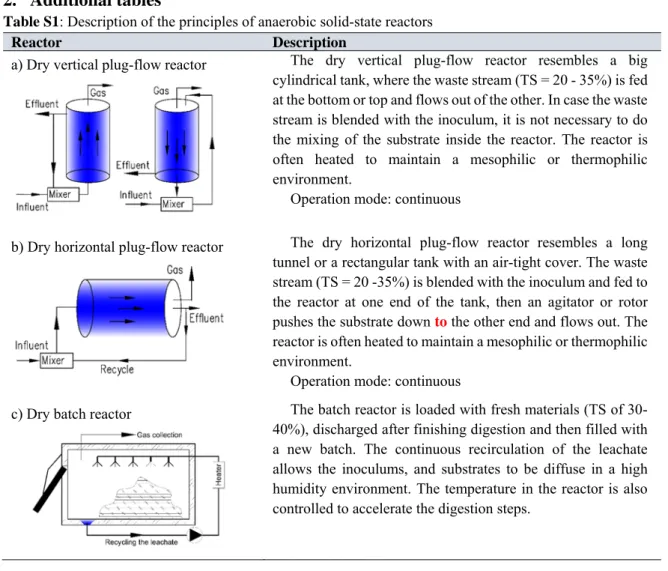
Table S1: Description of the principles of anaerobic solid-state reactors ... 40
Table S2: Description of the principles of anaerobic wet reactors ... 40
Table 2.1. Anaerobic sludge granulation ... 49
Table 3.1. Characteristics of materials (n=3)... 58
Table 3.2. Characteristics of biogas production and digestate from the SAD ... 60
Table 3.3. The detail operation of the methane reactor ... 63
Table 4.1. Characteristics of the materials (number of samples n=3) ... 72
Table 4.2: Experimental stages ... 73
Table 4.3. Parameters in operation of methane reactor ... 77
Table 4.4. Multivariate regression analysis of biogas yield and methane concentration ... 79
Table 5.1. Characteristics of the materials ... 85
Table 5.2: Operating parameters of the methane reactor ... 86
vii List of Figures
Fig. 1.1. a) Classification of digesters; b) Classification of AD systems ... 8
Fig. 1.2. The configuration of the two-stage digestion system ... 15
Fig. 1.3. Diagram of the three-stage anaerobic digestion system ... 22
Fig. 1.4. Applications of AD systems in Europe based on cumulative capacity installed in 2014 ... 27
Fig. S1. Anaerobic digestion processes ... 39
Fig. S2. Effects of temperature on the rate of the AD process ... 39
Fig. S3: Biogas power generation in various countries by 2014 ... 39
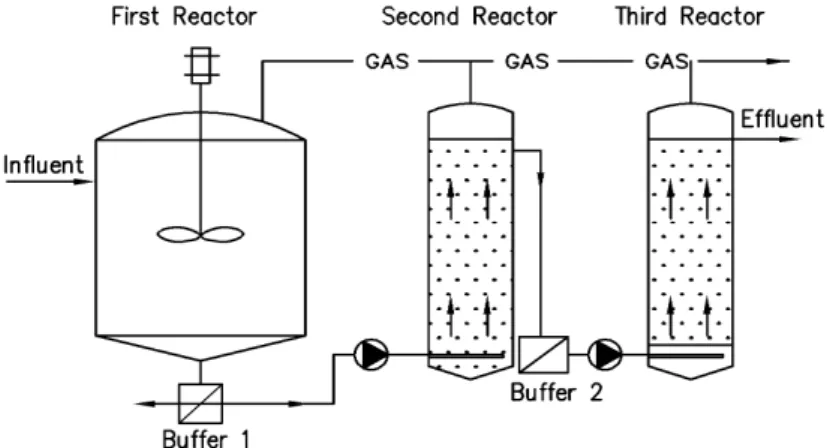
Fig. 2.1. Principal of proposed methane reactor ... 44
Fig. 2.2. Proposal of two-stage anaerobic digestion system ... 46
Fig. 2.3. Schematic representation of granular structure ... 47
Fig. 2.4. Cavities of granules under Scanning Electron Microscope ... 48
Fig. 2.5. Granular sludge obtained in the methane reactor ... 52
Fig. 2.6. Structure of granular sludge ... 52
Fig. 3.1. Outline of the single-stage and two-stage processes ... 58
Fig. 3.2. The fate of carbon in the single-stage digestion ... 61
Fig. 3.3. Accumulative biogas in the single-stage digestion ... 62
Fig. 3.4. Daily biogas production in the methane reactor during the experimental stages ... 63
Fig. 3.5. The fate of carbon in the two-stage digestion (stage III) ... 65
Fig. 4.1. Two-stage anaerobic digestion model ... 73
Fig. 4.2. Influence of pH levels on fermentative products ... 75
Fig. 4.3. Effects of pH and OLRs on biogas production in methane reactor ... 77
Fig. 5.1. Material flow of two-stage anaerobic digestion ... 86
Fig. 5.2. Comparison between non-recycle and recycle of the effluent ... 88
Fig. 5.3. Effects of different RRs on methanogenesis ... 89
1
Chapter 1 - A review of anaerobic digestion systems for biodegradable waste: Configurations, operating parameters, and current trends
Abstract.
With benefits to the human health, environment, economy, and energy, anaerobic digestion (AD) systems have attracted remarkable attention within the scientific community. Anaerobic digestion system is created from (bio)reactors to perform a series of bi-metabolism steps including hydrolysis/acidogenesis, acetogenesis, and methanogenesis. By considering the physical separation of the digestion steps above, AD systems can be classified into single-stage (all digestion steps in one reactor) and multi-stage (digestion steps in various reactors).
Operation of the AD systems does not only depend on the type of digestion system but also relies on the interaction among growth factors (temperature, pH, and nutrients), the type of reactor, and operating parameters (retention time, organic loading rate). However, these interactions were often reviewed inadequately for the single-stage digestion systems. Therefore, this paper aims to provide a comprehensive review of both single-stage and multi-stage systems as well as the influence of the growth factors, operating conditions, and the type of reactor on them. From those points, the advantages, disadvantages, and application range of each system are well understood.
Keywords: Anaerobic digestion systems; anaerobic digester; single-stage; two-stage;
three-stage; solid waste treatment.
1.1.Introduction
Solid waste generation is an inevitable consequence of human activities and its rapid increase in recent years has caused significant problems that humankind has to deal with. In 2010, nearly 1.3 billion metric tons of municipal solid waste (MSW) were produced worldwide, and the annual generation is estimated to increase up to 2.2 billion metric tons by 2025 (Al Seadi et al., 2013; Hoornweg & Bhada-Tata, 2012). The organic fraction of MSW (OFMSW) was often reported around 50-60% of total MSW, which had been cast off in landfills for many years (Al Seadi et al., 2013; Rapport et al., 2008; Trzcinski & David, 2017; W. Zhang et al., 2015).
2
According to Hoornweg and Bhada-Tata (2012), an annual amount of 250.05 million tons MSW was dumped into landfills in high-income countries; that of low-income and middle- income countries were 2.67 and 157.1 million tons, respectively. Besides OFMSW, major sources of biodegradable waste also originate from agriculture (animal manures, energy crops, algal biomass, harvest remains), food industry (food/beverage processing, dairy, starch, sugar, pulp/paper, ect…), and sewage sludge (Kayhanian et al., 2007; Kothari et al., 2014). Landfilling bio-degradable waste leads to various issues that threaten the environment and public health (Han et al., 2014; Hoornweg & Bhada-Tata, 2012). Also, the fact that the world population continues to grow together with the progress of human civilization leads to the increase of global energy demand. The traditional energy sources such as fossil fuel are exhausting, and nuclear energy is a potential risk to the environment and human health (H. H. Chen & Lee, 2014). Thus, the increasing energy demand is becoming a global challenge, and this has promoted the interest in search of alternative energy sources. Meanwhile, biodegradable waste can be converted to methane gas (renewable energy source) by using anaerobic digestion (AD) systems. Therefore, with benefits to the human health, environment, economy, and energy conservation, the AD systems have attracted remarkable attention within the scientific community (Deng et al., 2014; Mao et al., 2015).
The AD systems are constituted from reactors to perform a series of bi-metabolism steps including hydrolysis/acidogenesis, acetogenesis, and methanogenesis (Chiu & Lo, 2016; Mao et al., 2015; C. Zhang et al., 2014). By considering the physical separation of the digestion steps in various reactors, the AD digestion systems include single-stage, two-stage, and three- stage. In which, reactors are the place where growth factors (temperature - T, pH, nutrients) and operating parameters (retention time – RT and organic loading rate - OLR) are controlled to allow one or several digestion steps occur (Chernicharo & Augusto, 2007; Gerardi, 2003). The growth factors affect the living conditions of anaerobes and determine the success or failure of the reactors (Mao et al., 2015). Meanwhile, the RT determines the contact time between microorganism and substrate so that it is long enough to complete the transformation. A too long RT will lead to such a big reactor that will increase investment and operating costs. The OLR determines a measure of the amount of daily organic matter treated by a certain volume of the reactor. Both RT and OLR rely on the growth factors and the type of reactor. So the performance of the AD systems is determined by the complex relationships among the growth factors, the operating parameters, system type, type of reactor, and also coordination of reactors
3
in the system. These relationships were often reviewed inadequately in the single-stage digestion system (Chiu & Lo, 2016; Kothari et al., 2014; Mao et al., 2015). Meanwhile, for the multi-stage digestion systems, the information is still limited. Demirel and Yenigün (2002) are two of few authors who did a review on the operation of the two-stage digestion system.
However, they only investigated one configuration of the continuous stirred tank reactor (CSTR) for hydrolysis/acidogenesis and the upflow anaerobic sludge blanket (UASB) reactor for the methanogenesis. Moreover, the three-stage digestion system has limited information. So far there have been no studies providing a systematic and full review of the AD systems, including the coordination between the functional reactors in a system as well as the operation of each reactor.
This paper aims to provide a comprehensive review of the AD systems for biodegradable waste including the single-stage, two-stage, and three-stage systems. Each type of them is discussed about classification, configuration, and operation. Moreover, advantages, disadvantages, and application ranges for each system are also evaluated. The factors influencing the AD systems are identified and discussed based on the existing literature. Therefore, this study is as a guideline for the AD system design. This paper is organized into five following sections.
Section 1 is an introduction. Section 2 presents mechanism of AD processes and anaerobic reactors which are responsible for the AD process. In Section 3, the operation of the AD systems is systematized according to the biological phase separation, and the newest achievements are reviewed within the literature. Section 4 presents the current applications.
Finally, Section 5 is conclusions and recommendations.
1.2.Basics of Anaerobic Digestion
1.2.1. Biochemical mechanism of biogas production
The anaerobic digestion is a series of bio-metabolism steps including hydrolysis, acidogenesis, acetogenesis, and methanogenesis, respectively (Appels et al., 2008; Chiu & Lo, 2016; Demirel
& Scherer, 2008; Mao et al., 2015; Ostrem, 2004; C. Zhang et al., 2014; Ziemiński & Frąc, 2012), see Fig. S1. In which, every digestion step has different growth characteristics as presented below.
The first step (hydrolysis, also called solubilization) breaks down high molecular weight constituents (e.g., lipids, carbohydrate, and protein) into smaller soluble organic matter (e.g., fatty acid, glucose, and amino acid) by exo-enzymes, and is represented by reaction (1) (Abbasi
4
et al., 2011; Gerardi, 2003). The hydrolytic microorganism has ability to strongly resist the environmental fluctuations and the toxins which may be present in the feedstock (Stewart, 2014). They can work in a wide range of pH (4-11) (P. Zhang et al., 2009). However, pH-values in the range of 6 - 8 were often reported to provide an optimum working condition for hydrolysis (Sanders, 2001; Trzcinski & David, 2017; B. Zhang et al., 2005). The hydrolysis of lignocellulosic materials is a relatively slow process. Thus, hydrolysis is considered as a rate- limiting process in the digestion of lignocellulose (Krishna & Kalamdhad, 2014; Ostrem, 2004;
C. Zhang et al., 2014). Fortunately, this issue can be accelerated significantly by using pre- treatment processes including physical, chemical, and biological methods. The details of these methods are presented by Ariunbaatar et al. (2014).
( ) + (1)
The second step (acidogenesis) transforms the products of the hydrolytic process into volatile fatty acids (VFAs) such as propionic acid, butyric acid, acetic acid and ethanol by the action of the acidogenic bacteria (Buyukkamaci & Filibeli, 2004; Cysneiros et al., 2012; Pham et al., 2012). They have characteristics of strong and fast growth with a minimum doubling time of 30 mins (Ramos-Suárez et al., 2015). Acidogenesis can be described by equations (2-5) (Abbasi et al., 2011; Gerardi, 2003; Krishna & Kalamdhad, 2014; Ostrem, 2004). The pH-conditions significantly influence VFA products. By stepwise shifting pH from 4 to 8, the main products changed from butyric and acetic acids to acetic and propionic acids (Fang & Liu, 2002; Horiuchi et al., 1999). Moreover, the VFAs formation was strongly inhibited with pH below 4.0 (Stronach et al., 2012). The pH in the range of 5.5-6.5 was often reported as the optimal range (Mao et al., 2015).
3 (2)
+ 2 → 2CH CH COO + 2H + 2 (3)
→ CH (CH ) COO + + 2CO + 2 (4)
→ 2CH CH + 2 (5) The third step (acetogenesis) transforms most products of acidogenesis into acetic acid (CH3COOH), hydrogen (H2), and carbon dioxide (CO2) as shown in reactions (6-9) (Chernicharo & Augusto, 2007; Deublein & Steinhauser, 2011; Gerardi, 2003; Ostrem, 2004).
The growth kinetic of acetogenesis is slower than which of acidogenesis, with a minimal doubling time in the range of 1.5-4 days (Ramos-Suárez et al., 2015). Acetogens are strict anaerobes, the present of oxidants like oxygen or nitrate is toxic (Krishna & Kalamdhad, 2014),
5
and they work better in acid-weak environment (pH from 6.0 to 6.2) (Ramos-Suárez et al., 2015). Remarkably, high partial pressure of hydrogen product (≥ 10-4 atm) inhibits reactions (6) and (7), hence hydrogen product should be released (Burton et al., 2014; Stronach et al., 2012).
CH CH CO + 2 → CH COO + + 3 (6)
CH (CH ) CO + 2 → 2CH COO + + 2 (7)
CH CH + → CH COO + + 2 (8)
2 + 4 → CH COO + + 2 (9) The fourth step (methanogenesis) plays the most important role in generating methane gas by methanogens. There are two basic mechanisms for methane generation including acetoclastic and hydrogenotrophic methanogenesis. The first way, acetotrophic bacteria ferment acetic acid to CH4 and CO2 as equation (10) (Krishna & Kalamdhad, 2014; J. B. van Lier et al., 2008). The second one, hydrogenotrophic methanogens use CO2 and H2 as a food source, as given in reactions (11) (Demirel & Scherer, 2008; Krishna & Kalamdhad, 2014; J. B. van Lier et al., 2008). While the minimum doubling time of hydrogenotrophic bacteria is in the range of 4-12 hours, acetotrophic bacteria have a much lower maximum growth rate with doubling times of 2-3 days (Ramos-Suárez et al., 2015; J. B. van Lier et al., 2008). Generally, methanogens are extremely sensitive to pH condition, the presence of oxygen, and other factors such as free ammonia (FAN), H2S, and VFAs (Gerardi, 2003). They cannot work at pH condition lower than 6.2, even die in the pH condition under 6.0 (Gerardi, 2003; Ostrem, 2004), and can be inhibited by releasing free ammonia (FAN) when pH-value is over > 7.8 (Ramos-Suárez et al., 2015). The optimal pH-value was often reported at neutral environment (7.0-7.2) (Mao et al., 2015; Nayono, 2010; Ostrem, 2004; L. Yu et al., 2013). Methanogenic process lost stable stage when FAN concentration reached 0.6-0.69 g/L (Duan et al., 2012; Gallert & Winter, 1997), reduced 50% performance when FAN concentration was 1.45 g/L (Nakakubo et al., 2008), and failed by FAN concentration of 1.7-1.8 g/L (Yenigün & Demirel, 2013). The optimum concentrations of sulfur for the growth of methanogens were reported in the literature to vary from 16 to 160 mg-S/L (Uemura, 2010). The methanogenesis was often stable with a low VFA concentration (< 200mg/l), and inhibition occurred when acetate concentration exceeded 3g/l (Burton et al., 2014). The oscillation of temperature in the reactor should be as small as possible, that is, < 1°C/day for thermophiles and 2 - 3°C/day for mesophiles (Gerardi, 2003).
6
+ (10)
+ 4 + 2 (11)
1.2.2. Anaerobic reactors
Anaerobic reactor (digester) is considered as the heart of digestion systems, which encourages anaerobic microorganisms to thrive inside for responding to the digestion steps.
While the success of the digester depends very much on pH condition as described in section 2.1, its digestion rate is significantly dependent on temperature condition. Temperature is not only one of the most important in the selection of microbial group inside reactors, but it also influences the state of substrates such as the solubility, metabolic rate, and ionization equilibria.
According to temperature conditions, there are three microorganism groups including psychrophiles, mesophiles and thermophiles respectively living in the temperature range of 4- 15oC, 20-40oC and 45-70oC (El-Mashad et al., 2004). The influence of temperature on the growth rate of each group is shown in Fig. S2. In general, the increase in temperature has benefits of enhancing reaction rates significantly (Appels et al., 2008). However, the mesophiles are less sensitive to environmental changes than the thermophiles, hence operation reactor at thermophilic temperature requires higher technic than mesophilic condition (Chernicharo &
Augusto, 2007; J. K. Kim et al., 2006).
The anaerobic digesters can be categorized in several different ways, but the main classification can be set between wet and dry types relied on total solid (TS) contents because solid concentration has a great impact on the cost, performance, and technique of the AD process (Angelonidi & Smith, 2015; Lissens et al., 2001). Categorization of anaerobic reactors is summarized in Fig. 1.1a. The dry digesters have been designed to serve the feedstock having TS ≥ 20%, hence solid concentration within the reactor is also high (TS ≥ 15%) (Lissens et al., 2001; Trzcinski & David, 2017; Vandevivere et al., 2003). In the dry digester, the substrate particles play the roles of nutrient source and also supporting media. Especially, the microorganisms not only attach to the surface but also penetrate through substrate particles (Pandey, 2003). The dry type can be classified into three groups including the horizontal plug- flow, vertical plug-flow, and non-flow (batch type). The brief descriptions of these digesters are shown in Table S1, and the discussion about them is presented in the next section. The wet digesters are defined to serve the feedstock having TS ≤ 15% and well known in the wastewater treatment field (De Wilde et al., 2014; Rapport et al., 2008). They can often be classified based on the growth of bacteria inside including suspended growth and attached growth (Metcalf et
7
al., 2003). In the suspended growth digester, the microorganisms are maintained in suspension within the liquid. Meanwhile, they attach and grow on the surface of supporting media in the attached growth reactor. Detail descriptions of their representatives are shown in Table S2.
The design and operation of the anaerobic reactor are characterized by two parameters including retention time (RT) and organic loading rate (OLR). In which, the RT is defined as the average time that the substrate maintained in a reactor and quantified by the equation: RT
= reactor volume/daily flow. The RT has to be long enough to ensure the completion of one or several digestion steps that the reactor is in charge. For the wet reactor, the substrate materials are often separated into liquid and solid materials thus the RT is divided into hydraulic retention time (HRT) and solid retention time (SRT). Meanwhile, the OLR gives a measure of the amount of daily organic matter treated by a certain volume of the reactor and calculated indirectly via RT by equation OLR = Organic-concentration/RT. Both RT and OLR depend on the process parameters that influence the anaerobic bacterial growth such as temperature, pH, and waste characteristics.
1.3.Anaerobic Digestion System
The simplest anaerobic digestion system contains one reactor which is responsible for doing all four digestion steps. It is called the single-stage digestion system. However, along with the development of science and biotechnology, scientists have found that each digestion step has different optimal thriving conditions (Mao et al., 2015; Ramos-Suárez et al., 2015; Trzcinski &
David, 2017). Therefore, the idea of the physical separation of the digestion steps (multi-stage digestion) has been given the aim to optimize each of them to reach the highest performance of transformation. Currently, the multi-stage digestion systems only include two-stage and three- stage systems. The two-stage system performs hydrolysis and methanogenesis in two different reactors. More complex, the three-stage system performs the hydrolysis, acidogenesis/acetogenesis, and methanogenesis in various reactors. This paper classifies the subcategories of the AD systems based on type (wet or dry) of reactor employed as shown in Fig. 1.1b.
8
Fig. 1.1. a) Classification of digesters; b) Classification of AD systems
1.3.1. The single-stage systems
In principle, the environmental conditions are not necessarily optimal for any digestion step, but they satisfy all four steps (Ostrem, 2004). However as shown in Section 2.1, the range of growth conditions for the methanogen is covered by the other process steps. Moreover, methanogens are the most sensitive to the environment and also have the slowest growth among microorganism consortium. Therefore, the environmental conditions in the single-stage digestion systems should be optimized for methanogenesis. Commonly, the single –stage system operates with some requirements: Carbon to nitrogen (C/N) of the substrate in the range of 15 - 30 (Kothari et al., 2014; Mao et al., 2015; C. Zhang et al., 2014); pH ranging between 6.8 and 7.4 (Kothari et al., 2014; Mao et al., 2015); HRT 30 days at mesophilic temperature, 20 days at thermophilic, and 50 days at psychrophilic.
1.3.1.1.The wet single-stage systems
They are the single-stage systems employing the wet reactor, and they can be classified into two groups including low-rate (OLR = 0.5 - 1.6 kg-VS/m3.day-1) and high-rate (OLR = 1.6 - 4.8 kg-VS/m3.day-1) (Ramos-Suárez et al., 2015). A number of studies have shown that they are sensitive to inhibitor such as FAN. According to the study of Duan et al. (2012), FAN level
> 0.6 mg/l was the key factor influencing system stability. Nakakubo et al. (2008) showed that methane yield was reduced 50% when FAN concentration was up to 1.45 g/L. And Yen and Brune (2007) reported that the system could fail when FAN increased within to the range of 1.7-1.8 g/L.
a. The wet low-rate system
a) b)
AD systems
Single-stage
Wet Dry
Two-stage
Wet - Wet Dry - Wet
Three-stage
Dry - Wet - Wet Wet - Wet - Wet
Anaerobic Reactor
Solid-state ( TS ≥ 20% )
Continuous (TS = 20-45%)
Horizontal plug- flow Vertical plug-flow Batch
(TS =30-40%)
Liquid-state (TS ≤ 15%)
Attached (TS ≤ 5%)
Fixed bed Expanded/Fluidized
bed Suspended
(TS ≤ 15%)
Mixed Non-Mixed
9
The wet low-rate system is the oldest and simplest type, has its key characteristics such as long RT (30-60 days), poor mixing process, and non-heating process (Nayono, 2010; Turovskiy
& Mathai, 2006). It is a very simple operation, but very low performance, hence the low-rate systems have only been used within household-scale and farm-scale in developing countries such as China, India, and Vietnam (Abbasi et al., 2011). The diagram principle of these systems is shown in Table S2.a. It doesn’t matter if it is small or large-scale, there is always a stratification inside reactors with four zones: (i) a scum layer, (ii) a liquid layer (or supernatant), (iii) a layer of digesting solids, and (iv) a layer of digested solids (Appels et al., 2008; Nayono, 2010). Among these systems, the household-scale one (Table S2.b) is also known as floating- dome digester or fixed dome digester. Although it has capacity in the range of 1 - 8 m3, the 1 – 3 m3 one is the most commonly used. In this system, the daily feedstock is about 1/40 - 1/50 of the reactor volume (Abbasi et al., 2011). The farm-scale one (lagoon digester or anaerobic pond, see Table S2.c) is operated with an HRT in the range of 30 - 60 days, SRT of 50 - 100 days, and TS of the feedstock of 0.5 to 5% (Metcalf et al., 2003).
b. The wet high-rate systems
The wet high-rate systems have been developed from the low-rate digestion for improving performance. The feedstock can be heated and mixed to make a uniform environment, which leads to the fact that the reactor is less volume, more stable and more efficient (Turovskiy &
Mathai, 2006). The first generation of the wet high-rate systems uses the wet plug flow (WPF) reactor (see Table S2.d), which is supported by a heat source. This system has been applied the most for manure with solid content in the range of 11-14% and HRT of 15 - 20 days (Abbasi et al., 2011; Roos et al., 2004). A more complicated reactor called completely mixed reactor (CMR) or continuous stirred tank reactor (CSTR) requires internal mixing activities, see Table S2.e. This system often operates at mesophilic temperature with OLR in the range of 1.5 - 5 kg- VS/m3.day-1 and RT from 15 to 20 days (Abbasi et al., 2011). In the CSTR, the bacteria get washed away together with the effluent out of reactor (Abbasi et al., 2011). Meanwhile, to reach higher OLR, the reactor need a higher concentration of bacteria maintained inside. Therefore, the biomass of the effluent is separated in a settling tank and pumped back to the reactor where the biomass concentration is maintained in the range of 5 - 10% VS (Abbasi et al., 2011; Burton et al., 2014). It is called anaerobic contact (AC) system as shown in Table S2.f. Waasa, a famous brand name of AC system, is used for treating OFMSW. In Waasa system, fresh materials are mixed with effluent water to attain 10-15% TS. The OLR could reach 4 - 8 kg-
10
VS/m3.day-1 with the efficiency of 100 - 150 m3-biogas/ton-waste and TS reduction of 50 - 60%
(Rapport et al., 2008).
When the substrate of the feedstock is mainly in the soluble state (or TS < 3-5%), the wet reactors with high biomass concentrations such as upflow anaerobic sludge blanket (UASB), expanded granular sludge bed (ESGB), expanded bed (EB), fluidized bed (FB), internal circulation (IC), and anaerobic fixed bed (AFB) can be employed. The principles and application range of these reactors are presented in Table S2. They are well known in the industrial wastewater treatment sector. In the United States, application allocation of anaerobic technologies in the industrial wastewater treatment for period 2002-2007 included 34% UASB, 33% IC, 22% EGSB, 1% AFB, and 10% others (J. B. van Lier et al., 2008).
1.3.1.2.The dry single-stage systems
The high solid waste can be treated by the wet digestion systems, but it needs to be added a large amount of water. Unfortunately, dilution of the waste stream not only demands higher costs of water and energy consumption but also requires a reactor with higher volume.
Moreover, dilution of waste can drag on reducing biogas yield and make more wastewater (Lissens et al., 2001). Therefore, the dry digesters have been developed to deal with high solid waste (see Table S1). The main issues with the operation of dry systems compared to which of wet systems are the mixing and pumping of the substrate with high viscosity (De Wilde et al., 2014). Along with the evolution of technologies, these issues gradually reduced. Nowadays Dranco, Valorga, Kompogas, and Biocell are the most commonly applied systems of pilot scale plans in Europe (De Wilde et al., 2014; Rapport et al., 2008). Generally, the dry systems are stronger than the wet ones because of stability even with ammonia concentration up to 2.5 - 3 g/L and VFAs in the range of 23 - 24 g/L (D'Addario et al., 1993; Trzcinski & David, 2017).
The Dranco system is such a vertical plug-flow digester (see Table S1.a). In this system, a part of the digestate is taken back to the mixing pump where it is blended with fresh materials (separated sources, particle size < 4 cm) for inoculation with a ratio of 6-8:1. After that, the mixture is introduced into the top of the reactor and moves downward to the conical bottom where a screw conveyor removes the digestate. The rest of digestate is dewatered before being composted. There is no active mixing within the reactor, hence 20 - 30% of biogas can be lost because of the incomplete digestion (Trzcinski & David, 2017). The system has been proved successful to treat solid wastes with TS ranging from 20 to 50% (Lissens et al., 2001). When OFMSW (TS of 30-45%) is processed in the mesophilic condition with HRT 20 days, VS
11
decreases 55% and 5-8 kg-VS/m3.day-1 OLR is produced (Kayhanian et al., 2007; Trzcinski &
David, 2017). In the thermophilic temperature with RT 14 days, the amount of OLR could be up to 15 kg-VS/m3.day-1 and 65% of VS could be destroyed (Rapport et al., 2008). For digestion of OFMSW, alkali additive is often unnecessary, and pH inside the reactor is nearly 8. Each ton of waste can produce 120 - 170 m3-biogas (equivalent to 200 kWh) and the plant consumes 30 - 40% of it and exports the rest (Trzcinski & David, 2017).
The Kompogas system employs a horizontal plug-flow digester with internal rotors to assist in degassing and homogenizing waste (See Table S1.b). The incoming waste stream (particle size < 50mm) is mixed with the liquid of the digestate to attain TS in the range of 23 - 28% for the system to flow properly. At higher TS values, the mixture is hard to flow because of too high viscosity while lower TS values lead to accumulating sand and glass inside the reactor (Lissens et al., 2001; Rapport et al., 2008). The system often operates in the thermophilic condition (55 – 60oC) with HRT of 14 - 20 days. The digestate is dewatered by using a screw press then the solid part is composted by aeration within 2 - 3 weeks (Rapport et al., 2008;
Trzcinski & David, 2017). For one ton of waste, the system can produce 130 - 150 m3-biogas, 500 kg-compost, and 300 L liquid fertilizer.
The Valorga system uses a vertical plug-flow reactor (see Table S1.a). The feedstock is the mixture of the incoming waste stream (size< 30mm) and the digestate with TS adjusted in the range of 25-30%. If TS concentration is less than 20%, the grit particles will quickly settle down to the bottom and clog the recirculated-gas pores (Rapport et al., 2008). The system produces about 140 m3-biogas/ton-waste with VS removal rate of 50% (Kayhanian et al., 2007). For the substrate of OFMSW, the pH inside is often in the range of 7.8-8, hence alkali additive is not required. When pH drops, the feeding pump should stop until process regulates itself (Trzcinski
& David, 2017). A part of the biogas product is injected back at the bottom of the reactor with high pressure (5 bar) for mixing purpose and keeping materials suspended (Abbasi et al., 2011;
Trzcinski & David, 2017). The system is often operated in the mesophilic temperature with RT of 18 - 23 days and produces biogas yield of 220-270 L/kg-VS. After digestion, the digestate is composted within 2 - 3 weeks (Rapport et al., 2008).
The dry-batch digestion system (see Table S1.c): This system originates to mimic the landfill process. However, unlike natural biodegradation in the landfill, the reaction in the dry- batch system is accelerated by two basic factors. The first one is the continuous recirculation of the leachate. It permits formation of a high humidity environment and diffuseness of the
12
inoculum and the substrates. The second one is that temperature in the systems is controlled at the optimum range. This resulted in many fold higher biogas production rates and lower RT than observed in landfills (Vandevivere et al., 2003). The digester is loaded with fresh materials (TS of 30 - 40%), discharged, and then filled with a new batch. The digestion time finishes when biogas production ceases. After more than 20 days digesting at the mesophilic temperature, the digestate is aerated for 1 - 3 weeks for composting (De Wilde et al., 2014;
Rapport et al., 2008). For each ton of waste, the system produces 90 kg of biogas (58% CH4), 455 kg wastewater, and 310 kg of compost (Nayono, 2010). Despite saving 40% equipment cost compared to continuous-dry systems, the batch-dry systems have much lower applied ratio because they need much more space for construction (Rapport et al., 2008).
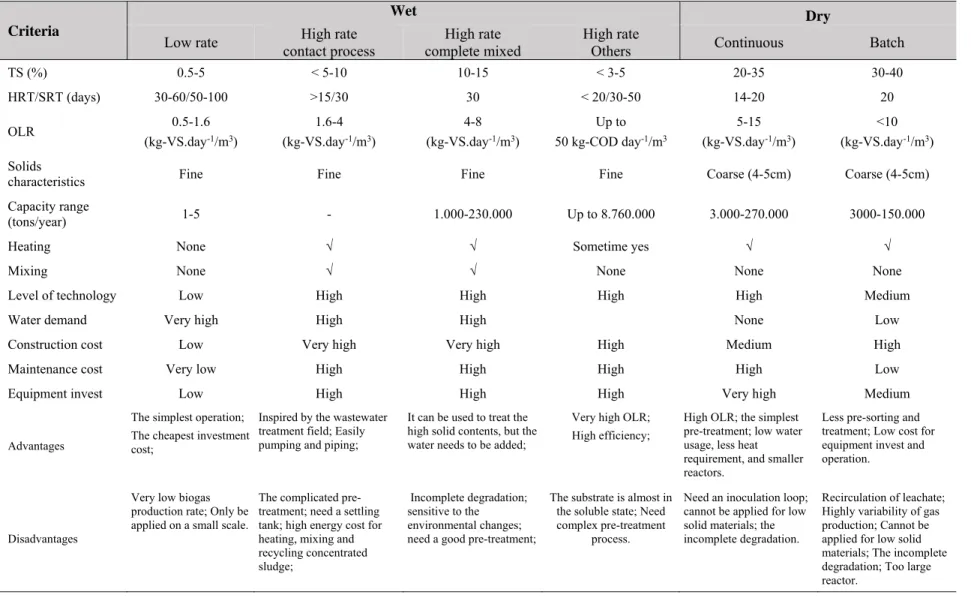
1.3.1.3.Assessments
The single-stage digestion systems have a wide application range and can cover the most type of biodegradable waste. The evaluation of the systems based on some technical targets is shown in Table 1.1; it also includes their advantages and disadvantages. In the single-stage digestion systems, the strong group bacteria (facultative microorganisms) can easily repulse the weak groups (methanogens) when living in the same reactor. Thus, the fluctuations of the load, pH, and solid concentration of the feedstock could harm the stability of the system. If the rate of acid formation is more than the rate of methane formation, it means there is an accumulation of VFAs, the system must be stopped and waited for turning stable status. Therefore, the two- stage system can be considered as an optimal solution to deal with the mentioned issues above.
13
Table 1.1. Comparison between wet and dry single-state digestion systems (Abbasi et al., 2011; Rapport et al., 2008; Roos et al., 2004).
Criteria
Wet Dry
Low rate High rate
contact process High rate
complete mixed High rate
Others Continuous Batch
TS (%) 0.5-5 < 5-10 10-15 < 3-5 20-35 30-40
HRT/SRT (days) 30-60/50-100 >15/30 30 < 20/30-50 14-20 20
OLR 0.5-1.6
(kg-VS.day-1/m3)
1.6-4 (kg-VS.day-1/m3)
4-8 (kg-VS.day-1/m3)
Up to 50 kg-COD day-1/m3
5-15 (kg-VS.day-1/m3)
<10 (kg-VS.day-1/m3) Solids
characteristics Fine Fine Fine Fine Coarse (4-5cm) Coarse (4-5cm)
Capacity range
(tons/year) 1-5 - 1.000-230.000 Up to 8.760.000 3.000-270.000 3000-150.000
Heating None √ √ Sometime yes √ √
Mixing None √ √ None None None
Level of technology Low High High High High Medium
Water demand Very high High High None Low
Construction cost Low Very high Very high High Medium High
Maintenance cost Very low High High High High Low
Equipment invest Low High High High Very high Medium
Advantages
The simplest operation;
The cheapest investment cost;
Inspired by the wastewater treatment field; Easily pumping and piping;
It can be used to treat the high solid contents, but the water needs to be added;
Very high OLR;
High efficiency;
High OLR; the simplest pre-treatment; low water usage, less heat requirement, and smaller reactors.
Less pre-sorting and treatment; Low cost for equipment invest and operation.
Disadvantages
Very low biogas production rate; Only be applied on a small scale.
The complicated pre- treatment; need a settling tank; high energy cost for heating, mixing and recycling concentrated sludge;
Incomplete degradation;
sensitive to the environmental changes;
need a good pre-treatment;
The substrate is almost in the soluble state; Need complex pre-treatment
process.
Need an inoculation loop;
cannot be applied for low solid materials; the incomplete degradation.
Recirculation of leachate;
Highly variability of gas production; Cannot be applied for low solid materials; The incomplete degradation; Too large reactor.
14
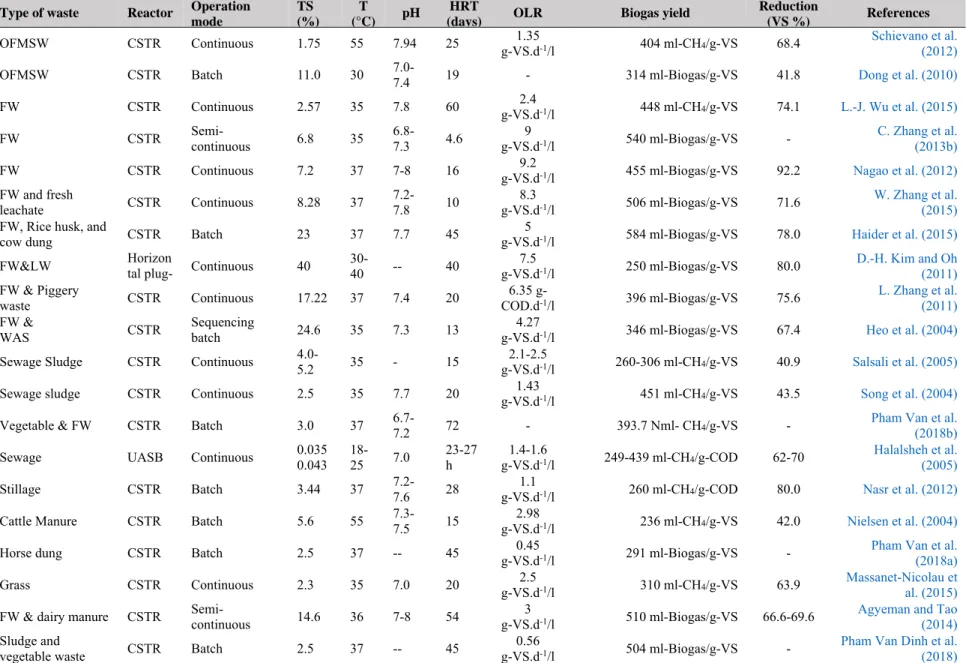
Table 1.2. Illustrative examples of the applications of the single-stage anaerobic digestion
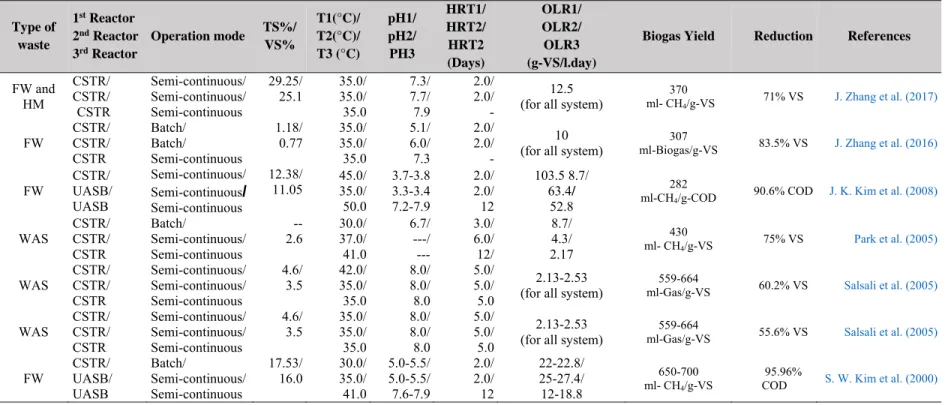
Type of waste Reactor Operation mode
TS (%)
T
(°C) pH HRT
(days) OLR Biogas yield Reduction
(VS %) References OFMSW CSTR Continuous 1.75 55 7.94 25 1.35
g-VS.d-1/l 404 ml-CH4/g-VS 68.4 Schievano et al.
(2012)
OFMSW CSTR Batch 11.0 30 7.0-
7.4 19 - 314 ml-Biogas/g-VS 41.8 Dong et al. (2010)
FW CSTR Continuous 2.57 35 7.8 60 2.4
g-VS.d-1/l 448 ml-CH4/g-VS 74.1 L.-J. Wu et al. (2015)
FW CSTR Semi-
continuous 6.8 35 6.8-
7.3 4.6 9
g-VS.d-1/l 540 ml-Biogas/g-VS - C. Zhang et al.
(2013b)
FW CSTR Continuous 7.2 37 7-8 16 9.2
g-VS.d-1/l 455 ml-Biogas/g-VS 92.2 Nagao et al. (2012) FW and fresh
leachate CSTR Continuous 8.28 37 7.2-
7.8 10 8.3
g-VS.d-1/l 506 ml-Biogas/g-VS 71.6 W. Zhang et al.
(2015) FW, Rice husk, and
cow dung CSTR Batch 23 37 7.7 45 5
g-VS.d-1/l 584 ml-Biogas/g-VS 78.0 Haider et al. (2015) FW&LW Horizon
tal plug- Continuous 40 30-
40 -- 40 7.5
g-VS.d-1/l 250 ml-Biogas/g-VS 80.0 D.-H. Kim and Oh (2011) FW & Piggery
waste CSTR Continuous 17.22 37 7.4 20 6.35 g-
COD.d-1/l 396 ml-Biogas/g-VS 75.6 L. Zhang et al.
(2011) FW &
WAS CSTR Sequencing
batch 24.6 35 7.3 13 4.27
g-VS.d-1/l 346 ml-Biogas/g-VS 67.4 Heo et al. (2004) Sewage Sludge CSTR Continuous 4.0-
5.2 35 - 15 2.1-2.5
g-VS.d-1/l 260-306 ml-CH4/g-VS 40.9 Salsali et al. (2005) Sewage sludge CSTR Continuous 2.5 35 7.7 20 1.43
g-VS.d-1/l 451 ml-CH4/g-VS 43.5 Song et al. (2004) Vegetable & FW CSTR Batch 3.0 37 6.7-
7.2 72 - 393.7 Nml- CH4/g-VS - Pham Van et al.
(2018b) Sewage UASB Continuous 0.035
0.043 18-
25 7.0 23-27
h 1.4-1.6
g-VS.d-1/l 249-439 ml-CH4/g-COD 62-70 Halalsheh et al.
(2005)
Stillage CSTR Batch 3.44 37 7.2-
7.6 28 1.1
g-VS.d-1/l 260 ml-CH4/g-COD 80.0 Nasr et al. (2012) Cattle Manure CSTR Batch 5.6 55 7.3-
7.5 15 2.98
g-VS.d-1/l 236 ml-CH4/g-VS 42.0 Nielsen et al. (2004)
Horse dung CSTR Batch 2.5 37 -- 45 0.45
g-VS.d-1/l 291 ml-Biogas/g-VS - Pham Van et al.
(2018a)
Grass CSTR Continuous 2.3 35 7.0 20 2.5
g-VS.d-1/l 310 ml-CH4/g-VS 63.9 Massanet-Nicolau et al. (2015) FW & dairy manure CSTR Semi-
continuous 14.6 36 7-8 54 3
g-VS.d-1/l 510 ml-Biogas/g-VS 66.6-69.6 Agyeman and Tao (2014) Sludge and
vegetable waste CSTR Batch 2.5 37 -- 45 0.56
g-VS.d-1/l 504 ml-Biogas/g-VS - Pham Van Dinh et al.
(2018)
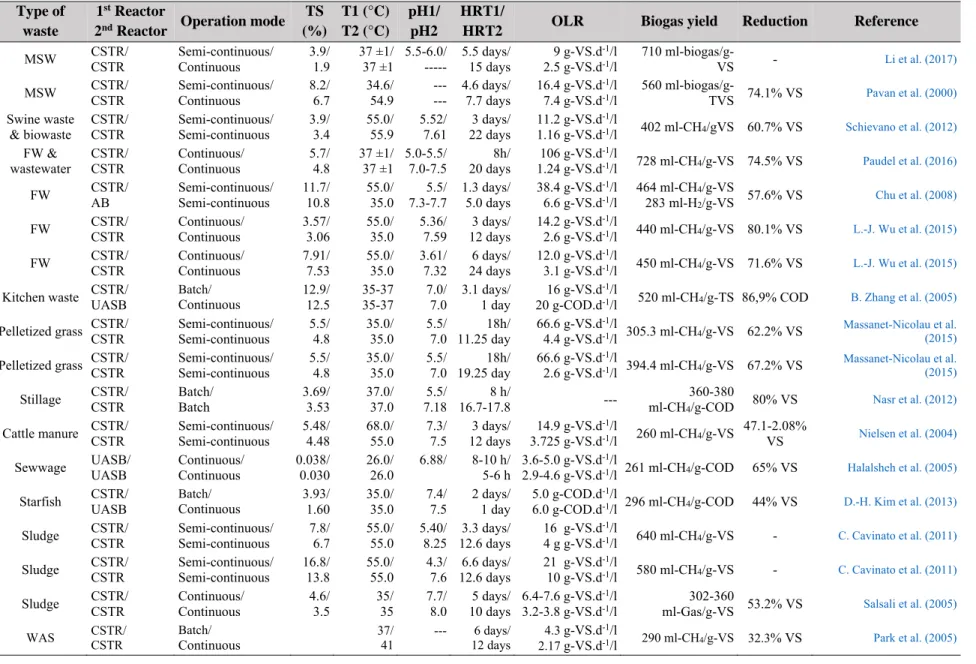
15 1.3.2. The two-stage systems
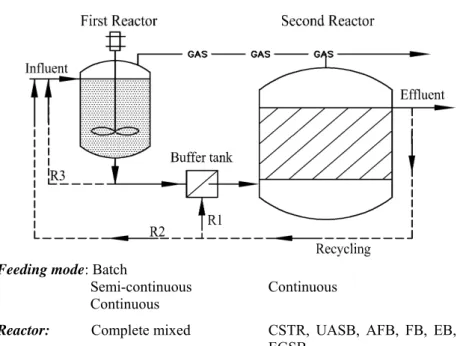
1.3.2.1.Configuration of two-stage systems
The growth characteristics of the hydrolysis/acidogenesis and the methanogenesis are very different. Therefore, the idea for two-stage digestion is given to optimizing every digestion step.
In the present, there are two different viewpoints about separating digestion-steps into two reactors. The first perspective supposes that the first tank allows the hydrolysis/acidogenesis to occur, and the second tank optimizes the acetogenesis/methanogenesis (Aslanzadeh et al., 2013b; Vandevivere et al., 2003). Meanwhile, the second perspective proposes that the acetogenesis should be in the first reactor and the second reactor only optimizes methanogenesis (Ostrem, 2004; Turovskiy & Mathai, 2006). The second point of view might like to maximize hydrogen product from acetogenesis. However, there are several reasons why this idea is not reasonable. Firstly, hydrogen production from AD is currently not economically viable because of the high cost required to enrich the hydrogen gas to meet the commercial quality standards (L. Yu et al., 2013). Secondly, as described in section 2.1, methanogens (hydrogen consumer) and acetogens (hydrogen producer) should work in close cooperation. Thirdly, acetogens are also sensitive and strict anaerobes; they should not work together with facultative bacteria (hydrolytic/acidogenic microorganism). In fact, the true separation of the digestion-steps is very difficult to achieve (Abbasi et al., 2011), hence the acetogenesis can occur in both reactors but mostly in the second one. Diagram of two-stage systems is shown in Fig. 1.2.
Feeding mode: Batch
Semi-continuous
Continuous Continuous
Reactor: Complete mixed CSTR, UASB, AFB, FB, EB, IC, EGSB
Fig. 1.2. The configuration of the two-stage digestion system
16
Because of the different environmental conditions between two reactors, a buffer tank is often set between two reactors as shown in Fig. 1.2 for many purposes such as removing non- hydrolysable materials, controlling pH, and even controlling the organic concentration (D.-H.
Kim et al., 2013; L. Yu et al., 2013). The two-stage system can use one, two, or all three water recirculation loops (R1, R2, and R3, shown in Fig. 1.2) in case of need. Using these recirculation loops brings many advantages, such as further controlling of pH (reduction of acidity due to using the high alkalinity effluent from the second reactor); mixing/diluting of the high solid feedstock; and improving activities of bacteria (Aslanzadeh et al., 2013b; L. Yu et al., 2013). However, if the inhibitors are accumulated inside reactors and cause the unstable condition of the system due to long time being used, the incoming substrate should be diluted by fresh water. After hydrolysis, the solid content of feedstock decreases significantly.
Therefore, the two-stage system may be a dry-wet configuration (high solid in the first digester and low solid in the second digester) or wet-wet configuration (both stages are low solid) (Rapport et al., 2008; Vandevivere et al., 2003). The hydrolysis/acidogenesis usually employs a CSTR (J. B. van Lier et al., 2008). Meanwhile, the methanogenesis uses the wet high-rate reactors including CSTR, UASB, AFB, FB, EB, IC, and EGSB (Burton et al., 2014;
Chernicharo & Augusto, 2007).
1.3.2.2.The hydrolytic/acidogenic reactor
The mission of this reactor is to convert the substrate to the VFAs as fast as possible while avoiding being inhibited and overloaded. Therefore, a series of operating conditions including pH, temperature, acid concentration, nutrients, and substrate concentration (TS) must be controlled. For the high-solid waste such as OFMSW, the waste stream should be shredded to reduce particle size (< 15 mm) before being fed to the reactor (Trzcinski & David, 2017). The hydrolysis/acetogenesis generally proceeds sufficiently fast in the mixing tanks, hence no further reactor has been developed for the hydrolysis/acetogenesis (J. B. van Lier et al., 2008).
Among mixing tanks, the CSTR is used the most, the wet plug-flow reactor sometimes (Trzcinski & David, 2017; Vandevivere et al., 2003).
Total solids: Hydrolyzing the high-solids feedstock allows the reactor to operate larger capacity, requires less energy for heating and less water consumption. However, a too high solid content can cause high viscosity of the mixtures, which leads to the fact that insufficient mixing or mixing can be too energy-consuming (Kristensen et al., 2009; Ostrem, 2004;
Rosgaard et al., 2007). Moreover, the increase of solid content (in the range of 5-40%) causes
17
the increase of inhibitors and insoluble solids content, which leads to the decrease of the hydrolytic conversion rate (Kristensen et al., 2009). Also, a high solid concentration (TS > 15%) of feedstock requires much longer RT (10 - 15 days) than usual (Ostrem, 2004). Thus, TS of 15-20% in the feedstock is often considered as the upper limit for hydrolysis/acidogenesis when using the mixed reactor (Rosgaard et al., 2007).
pH value: Moestedt et al. (2016) reported that the pH below 4.5 led to requiring HRT up to 15 days in the hydrolytic/acidogenic reactor. H. Yu, Q and Fang (2002) lifted up pH from 4 to 5.5, which resulted solubility and acidification of substrates increased significantly (H. Yu, Q
& Fang, 2002). Whereas under alkaline conditions, B. Zhang et al. (2005) reported that VFAs formation was significantly decreased when pH increased from 7 to 11. Deublein and Steinhauser (2011) showed that pH > 10 caused an irreversible loss of the activity of the microorganisms. The pH values between 5.5 and 6.5 were often reported as an optimal range and the best pH values was 6.0 (Chu et al., 2008; J. Jiang et al., 2013a; Lindner et al., 2015;
Turovskiy & Mathai, 2006). These results are reasonable for each condition of hydrolysis and acidogenesis as presented in section 2.1.
Temperature: Most studies have agreed that the hydrolytic/acidogenic rate is proportional to the increase of temperature (He et al., 2012; Mata-Alvarez, 2003; P. Zhang et al., 2009). In addition, compared to the mesophilic conditions, the thermophilic regimes have been increased destruction of pathogens which might have a severe impact on reactor and environment (M.
Kim et al., 2003). Therefore, thermophilic temperature seems better than mesophilic one.
However, Kozuchowska and Evison (1995) reported that the mesophilic operations provided a more stable condition than the thermophilic operation in acidification of coffee waste.
Komemoto et al. (2009) even notified that the solubilization rate of food waste was significantly higher in mesophilic conditions than others. Thus, regarding energy and efficiency, the mesophilic temperature in the range of 35-37oC is still preferred to use for the hydrolysis/acidogenesis of organic waste, see Table 1.3.
Retention time: RT of this reactor depends on not only the environmental conditions but also waste characteristics. For hydrolysis/acidogenesis of the source-sorted OFMSW (TS 8.2%), Pavan et al. (2000) recommended that RT would be safe in the range of 2 - 3 days at the mesophilic temperature. At the same temperature above but for food waste, Paudel et al. (2016) optimized RTs and reported that one day was the best. Meanwhile, for agro-industrial wastewater, Dareioti and Kornaros (2014) even got the highest efficiency of acidogenesis
18
achieved at lower RT (0.75 days). In general, RT in the range of 1 to 3 days is preferred to use to deal with high-solid waste in the mesophilic condition (Turovskiy & Mathai, 2006;
Vandevivere et al., 2003). In case the reactor is operated in batch mode, RT should be maintained within 7 - 12 days (L. Yu et al., 2013).
Inhibitions: Despite strong and resilient characteristics the hydrolytic/acidogenic microorganism can still be inhibited by such high concentrations of organic acids (VFAs) and free ammonia. It has been reported that VFA up to 30 g-COD/L did not inhibit the hydrolysis process at neutral pH (6 - 7) (Adrie Veeken et al., 2000), but VFA levels of 40 - 50 g-COD/L at low pHs (5.0 - 5.5) caused stopping the hydrolysis (AHM Veeken & Hamelers, 2000). Koster and Lettinga (1988) reported that acidogenesis were severely affected by ammonia concentration in the range of 4051 - 5734 mg NH3-N/L.
Nutrients: Deublein and Steinhauser (2011) are two of the few authors who mentioned about nutrient demands for hydrolysis/acidogenesis and noted that C/N ratio should be in the range of 10 – 40 while trace elements are not a special requirement.
1.3.3. The methanogenic/acetogenesis reactor
This phase often employs wet high-rate reactors such as CSTR, UASB, AFB, FB, EB, IC, and EGSB (Burton et al., 2014; Chernicharo & Augusto, 2007). These reactors have to be maintained with the methanogen-rich anaerobic environment which is obligate anaerobic and sensitive to the variation of temperature, pH, and also RT (Gerardi, 2003; Mao et al., 2015).
Therefore, operating conditions in the second reactor have to be complied strictly.
Solid concentrations: TS of the substrate coming to the methane reactor depends on the type of reactor employed. In case of using CSTR or CMR, TS of the substrate is allowed up to 10%. Meanwhile, AFB reactor requires lower solid content of the influent (TS ≤ 5%) (Abbasi et al., 2011; Roos et al., 2004). UASB, EB, FB, EGSB, and IC reactors even require lower solid content of the influent (TS ≤ 3%) with biomass concentration inside be maintained in the range of 3.5-4% (Abbasi et al., 2011; Burton et al., 2014).
The pH value: As shown in Section 2.1, the optimal range of pH condition for methanogens and acetogens are very close to each other. Moreover, acetogens are stronger than methanogens.
Therefore, optimizing pH condition for methanogens does not affect the growth of acetogens.
In fact, pH in the range of 7.0 - 8.0 was often used (see Table 1.3). Moreover, this phase is an alkalinization process (converting acids to biogas), hence pH of the substrate to this reactor