Physiological and Molecular Characterization of Zinc Uptake in Rice
2020.9
Sheng HUANG
Graduate School of Environmental and Life Science
Okayama University
Table of contents
Chapter 1 Introduction ... 1
1. Overview of Zn in plants ... 1
2. Function of Zn in plants ... 2
2.1 Role of Zn in enzyme component ... 3
2.2 Role of Zn in stabilizing the molecular structure... 4
2.3 Role of Zn in the process of genetic expression ... 5
3. Zn deficiency and toxicity ... 7
4. ZIP family ... 10
5. Factors affecting Zn uptake ... 12
6. Root structure and uptake system of mineral elements in rice ... 14
Chapter 2 Identification of transporter genes involved in Zn uptake in rice ... 16
1. Introduction ... 16
2. Materials and methods ... 18
3. Results ... 28
4. Discussion ... 57
Chapter 3 Effect of silicon on zinc uptake in rice ... 61
1. Introduction ... 61
2.Materials and methods ... 63
3. Results ... 67
4. Discussion ... 82
Chapter 4 General discussion ... 87
Summary ... 91
Reference ... 94
Acknowledgements ... 115
Chapter 1 Introduction
Zinc (Zn) is an essential micronutrient for plant growth and development (Marschner, 2012). It plays structural and catalytic roles in large number of proteins. However, Zn deficiency is the most widely occurring micronutrient deficiency in crops worldwide, which has been a limiting factor of crop production on millions of hectares of arable land, especially in alkaline soil (Barker and Pilbeam, 2015). Furthermore, this deficiency also results in Zn deficiency in humans because Zn in edible parts of crops is our primary source of Zn intake. Therefore, it is important to understand the molecular mechanisms of Zn transport and regulation in crops for preserving Zn accumulation in edible parts.
1. Overview of Zn in plants
Zn is the second most abundant transition metal in living organisms after Fe (Marschner, 2012). Zn is involved in a wide variety of physiological processes (Broadley et al., 2007). Zn is taken up predominantly as a divalent cation (Zn2+). When the pH increases in the soil, it is also taken up as a monovalent cation (ZnOH+) (Marschner, 2012). It is reported that the average total Zn concentration in cultivated soils is around 65 mg/kg (Alloway, 2009), while the Zn concentration in most agricultural soil ranges from 10 to 300 mg/kg (Alloway, 1995; Barber, 1995; Broadley et al., 2007). The phytoavailability of Zn in soil depends on rhizosphere microbial community composition, pH value,
redox potential, bioavailability and concentration in soil (Alloway, 2008, 2009; Hafeez et al., 2013).
Zn can be transported from soil solution to the root stele through the apoplastic pathway in the regions where the Casparian band is not fully formed (White, 2001;
White et al., 2002). However, most Zn is taken up from the soil to the stele though symplastic pathway (Lasat and Kochian, 2000), which is mediated by various transporters. When Zn enters into the xylem, it will be translocated to the shoots in the form of complex with organic compounds or free divalent cation. Finally, Zn will be delivered to different leaves and grains through phloem, in which Zn is present in the form of Zn-organic compound complex. All these processes require various different transporters.
2. Function of Zn in plants
Zn plays very important roles in many physiological and biochemical process. Firstly, Zn is an essential component of many enzymes which participates in the synthesis and degradation of carbohydrates, lipids, proteins, and nucleic acids. Secondly, Zn can stabilize the molecular structure of cellular components and membranes. Thirdly, Zn plays an essential role in polynucleotide transcription and thus in the process of genetic expression (Cakmak, 2000; Marschner, 2012; Hafeez et al., 2013). Therefore, when the plants suffer from Zn deficiency, it will cause chlorosis and stunting, and finally results in low yields and death (Broadley et al., 2011). On the other hand, when Zn
concentration is present in excess, it will show toxicity to plants although the tolerance to high Zn differs with plant species (Van Assche and Clijsters, 1986; Clemens and Peršoh, 2009; Tennstedt et al., 2009). Zn toxicity can result in the inhibition of root elongation in non-tolerant plants and also lead to chlorosis and inhibition of photosynthesis (Godbold et al., 1983; Van Assche and Clijsters, 1986; Ruano et al., 1988; Sagardoy et al., 2009).
2.1 Role of Zn in enzyme component
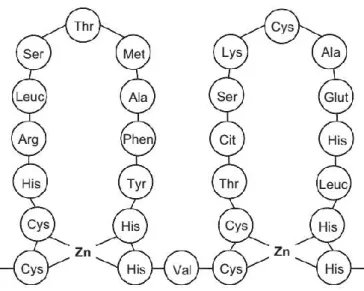
In higher plants, Zn is required for mediating the activity of various enzymes. Zn is an important cofactor for the activity of six enzyme classes including oxidoreductases, hydrolases, lyases, ligases, transferases, and isomerases (Sousa et al., 2009). In these enzyme classes, Zn-binding sites have identified as four types, including catalytic, co- catalytic, structural, and protein interface sites. These Zn-binding sites determine the biological activity of these enzymes. For example, carbonic anhydrase is a kind of enzymes with catalytic type Zn sites. It contains a single Zn atom that can catalyze the hydration of CO2. Zn ion in carbonic anhydrase is coordinated to three protein ligands and one water molecule (Fig. 1.1A, Sandmann and Böger, 1983; Badger and Price, 1994). Co-catalytic type Zn sites are usually present in enzymes including two or more Zn atoms. Aspartic acid and histidine are the most common ligands in these co-catalytic sites. On the other hand, structural Zn sites contribute to maintenance of the structure of enzymes such as alcohol dehydrogenase and proteins involved in DNA replication
and gene expression. In these proteins, Zn ions are mostly bound to four cysteine residues. As for alcohol dehydrogenase, different from most of other enzyme, it contains two Zn atoms for each molecule; one of them with catalytic and the other with structural functions. The catalytic one usually binds to histidine and water molecule, and the structural one usually binds to four cysteine (Fig. 1.1B, Coleman, 1992; Auld and Bergman, 2008). Furthermore, Zn which bridges subunits at the protein interface is able to affect the protein-protein interaction (Auld and Bergman, 2008; Auld, 2009).
Fig 1.1 Diagram of binding of zinc and amino acid ligands in protein (Marschner, 2012).
2.2 Role of Zn in stabilizing the molecular structure
Zn plays an important role in stabilizing the molecular structure of cellular components and membranes. It is required for maintaining the integrity of bio-membranes. Zn is able to bind to phospholipid and sulphur-containing substance of membrane components, and form tetrahedral complexes with cysteine residues of polypeptide chains to protect membrane lipids and proteins from oxidative damage (Cakmak and
Marschner, 1988a; Cakmak, 2000; Maschner, 2012). It was reported that under Zn deficiency condition, the phospholipid concentration and the degree of unsaturation of fatty acids in membrane lipids were significantly decreased in root cells, resulting in increase of plasma membrane permeability (Cakmak and Marschner, 1988c). In addition, upon resupply Zn to the roots, the restoration of membrane lipids was detected, indicating the importance of Zn in stabilizing of membranes (Welch et al., 1982).
2.3 Role of Zn in the process of genetic expression
It has been reported that Zn plays an important role in DNA and RNA metabolism in humans, animals and plants. A lot of studies have revealed the function of Zn-dependent proteins or Zn containing proteins in DNA replication, transcription and the regulation of gene expression (Coleman, 1992; Vallee and Falchuk, 1993; Andreini et al., 2009).
In the transcriptional regulation, Zn is an indispensable factor in these proteins to recognize and bind downstream nucleic acid sequences. Various Zn dependent proteins are involved in the regulation of DNA transcription process (Andreini et al., 2009). The Zn finger transcription factor family such as Cys2His2 (C2H2) is the most known transcription factor. Fig. 1.2 shows a schematic diagram of the role of Zn in the structure of a C2H2 zinc finger in protein (Marschner, 2012). In eukaryotic cell, a lot of proteins contain zinc finger domains, which play an important role in the recognition and binding to DNA, protein and RNA. Many Zn finger proteins contain DNA-binding domains and function as transcriptional factors to regulate the target gene transcription
(Fig. 1.3). Some Zn finger proteins function as protein adaptors to mediate the protein- protein interaction. Additionally, some of Zn finger proteins can interact with RNAs and regulate gene expression at the post-transcriptional levels (Miller et al., 1985; Choo et al., 1994; Dai et al., 1998).
Figure 1.2 Schematic diagram of the role of Zn in the structure of a C2H2 zinc finger in protein (Marschner, 2012).
Figure 1.3 Structure of C2H2 zinc finger and DNA banding pattern. (A) Structure
of Zinc finger, (B) Interaction of zinc finger protein with a DNA sequence (Hossain et al., 2015 ).
3 Zn deficiency and toxicity
Zinc deficiency of crops is widespread all over the world (Welch et al., 2002).
According to the Food and Agriculture Organization (FAO), about 30% of the cultivable soils of the world contain low levels of plant available Zn (Sillanpaa, 1990).
In normal soils, the microelements such as Zn inherit primarily from the rocks through geochemical and pedochemical weathering processes. The total amount of Zn present in the soil is also dependent on the rock type, intensity of weathering, climate and numerous other predominating factors during the process of soil formation (Saeed et al., 1997). At the same time, high pH and high contents of CaCO3, organic matter, clay and phosphate can fix Zn and result in the reduction of available Zn in the soil (Trehan and Sekhon, 1977). Generally, Zn deficiency occurs in calcareous soils, sandy soils, peat soils and soil with high P and Si (Alloway, 2004; 2008). Flooding also results in low Zn availability to plants, because of the changes in pH in the soil and the formation of insoluble Zn compounds such as reaction of Zn with sulfide (Mikkelsen et al., 1977).
When plants suffer from Zn deficiency, it will cause their abnormal growth and development. Visible symptoms of Zn-deficiency appear as stunted growth, chlorosis and smaller leaves, spikelet sterility (Fig. 1.4). For example, in cereals such as wheat, typical symptoms are reduction of shoot elongation and development of whitish-brown
necrotic patches on middle-aged leaves, but young leaves remain yellowish green in color that show no necrotic lesions (Cakmak et al., 1996).
Fig 1.4 Zn deficiency symptoms in crops (Photo credits: South Dakota State University; IPNI; Howard F. Schwartz, Colorado State University, Bugwood.org; IRRI).
On the other hand, Zn deficiency can also affect the quality of harvested products.
Furthermore, it will increase the susceptibility of plants to be injured by high light or high temperature and increase the risk by fungal diseases (Marschner, 1995; Cakmak et al., 2000). Different plant species show different sensitivity to Zn deficiency. For example, maize and rice are more sensitive to Zn-deficiency than rye, oats and pea (Cakmak et al., 1997). In cereal, rye shows the highest tolerance to Zn deficiency, followed by triticale, barley and bread wheat (Cakmak et al., 1997).
Zn shows toxicity to plants when it is present in excess (Clemens, 2001; Haydon et., al 2007). An excess supply of Zn affects the growth of both roots and shoots. The root elongation, which is a sensitive parameter for heavy metal toxicity, is rapidly inhibited
by high Zn and the shoots become stunted and chlorotic. Furthermore, the root epidermis may be lignified by Zn toxicity (Påhlsson et al., 1989). The precise cause of Zn toxicity is unknown, but excess Zn may bind to inappropriate intracellular ligands or compete with other metal ions for enzyme active sites or transporters (Ishimaru et al., 2011). The symptoms of Zn toxicity in plants are usually similar to those of Zn deficiency. On the other hand, high concentration of Zn supply will cause the deficiency of other mineral elements such as Fe because they show similar ion features (Woolhouse, 1983; Sagardoy et al., 2009). The photosynthesis is strongly inhibited in plants exposed to excess Zn (Garty et al. 1992)). This inhibition is attributed to high Zn-induced deficiency of Mg and Mn, which play important roles in the photosynthesis systems (Ruano et al., 1987; Boardman and McGuire, 1990; Sagardoy et al., 2009).
On the other hand, Zn is also an essential element for humans. However, dietary deficiency of Zn in humans has been estimated as the 40th leading risk factor underlying global burden of disease (GBD, 2016). Over 30% of the world’s population is Zn deficient (WHO, 2002; White and Broadly, 2005). Zn deficiency causes various diseases, such as dyspepsia. Zn in edible parts is the primary sources of Zn intake for humans, therefore, boosting Zn density in edible part is very important for human health.
This is especially important for rice because rice is a staple food for half of the world’s population, which provides an important source of our dietary intake of Zn.
4. ZIP family
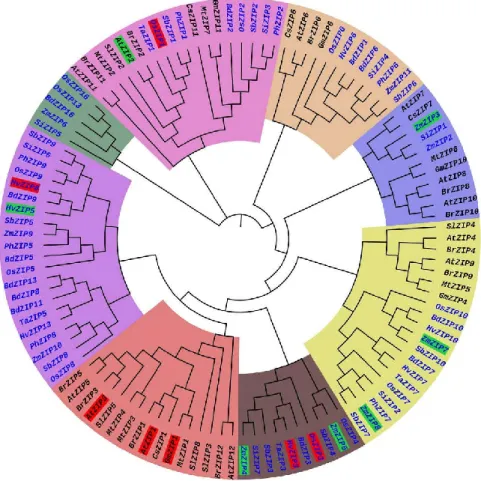
The transport of metals including Zn from soil to different organs and tissues have been proposed to be mediated by different transporters such as members of the Zn-regulated transporter, iron-regulated transporter-like proteins (ZIP; ZRT-IRT-related protein), yellow stripe1-like (YSL) family, heavy metal ATPases (HMA), cation diffusion facilitator (CDF) (Grotz et al., 1998; Guerinot, 2000; Sinclair and Krämer, 2012). ZIP family transporters were first identified in yeast (ZRT1) and Arabidopsis (IRT) (Zhao and Eide, 1996; Eide et al., 1996). Homologous ZIP proteins are present in many plant species. For example, there are 15 members in Arabidopsis (Milner et al., 2013), 17 in rice (Oryza sativa) (Chen et al., 2008 ), 14 in wheat (Triticum aestivum) (Evens et al., 2017), 12 in barley (Hordeum vulgare) (Tiong et al., 2014), and 23 in common bean (Phaseolus vulgaris L.) (Astudillo et al., 2013). A phylogenetic tree of ZIP family members from different plant species is shown in Fig. 1.5. Most ZIP proteins have 309–
470 amino acids and are predicted to have eight trans-membrane domains and a similar membrane topology in which the amino- and carboxyl-terminal ends of the proteins are located on the outside surface of the plasma membrane (Guerinot, 2000). The overall length of ZIP proteins varies considerably because of the variation between the transmembrane domains (TM) TM3 and TM4, which is predicted to contain a potential metal binding domain rich in histidine residues and on the cytoplasmic side (Guerinot, 2000). Based on the affinity, there are both low-affinity and high-affinity ZIP transporters. Many of the ZIP family members have been characterized to be involved in uptake and transport of metals including Zn in plants (Eide et al., 1996; Korshunova
et al., 1999; Guerinot, 2000; Vert et al., 2001, 2002; Connolly et al., 2002), however, their exact role in plants is still poorly understood.
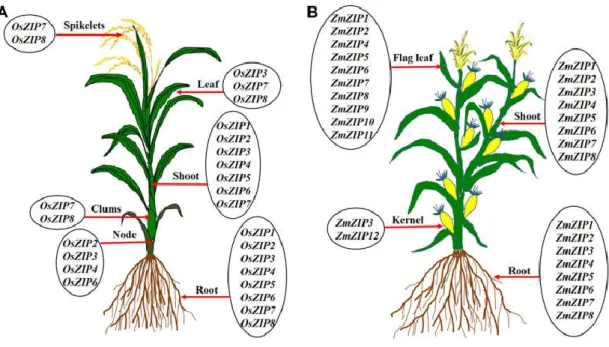
Based on transport assays mainly in yeast mutants, ZIP transporters show broad substrate transport activity; they transport Fe, Zn, Mn, Cd, and Co (Korshunova et al., 1999; Waters and Sankaran, 2011; Milner et al., 2013). The ZIP genes also show different expression patterns; some are only expressed in the roots (Bughio et al., 2002;
Ishimaru et al., 2006), whereas others are expressed in different tissues (Fig. 1.6, Ishimaru, et al., 2005; Yang et al. 2009; Lee et al., 2010a; Lee et al., 2010b; Kavitha et al., 2015; Sasaki et al., 2015).
Figure 1.5 Phylogenetic tree of ZIP transporter family proteins of plants. The phylogenetic tree was constructed from 113 ZIP transporter protein sequences collected
from 14 plant species including 8 monocot (Blue) and 6 dicot plants (Black). Each major cluster is highlighted with different color. The low-affinity and high-affinity ZIP transporters are highlighted in red and green, respectively (Krishna et al., 2020).
Fig. 1.6 Expression of ZIP transporter genes in different organs of rice (A), and maize (B) (Krishna et al., 2020).
5. Factors affecting Zn uptake
The uptake of Zn has been reported to be affected by many factors. For example, it was reported that Zn uptake is affected by presence of high Fe concentration. In a study with wheat seedlings, low Fe2+ concentration (10 µM) did not affect the Zn uptake from solutions containing 1 or 10 µM Zn (Adriano et al., 1971). However, at a higher Fe2+
concentration (100 µM), Fe completely suppressed the Zn uptake by rice seedlings from a solution of 0.05 µM ZnCl2 (Giordano et al., 1974).
On the other hand, Zn uptake is also affected by phosphorus (P). High concentrations
of P have been detected in Zn-deficient plants (Cakmak and Marschner, 1986). Akhtar et al. (2010) reported that an increase in P supply resulted in a significant reduction of Zn uptake per unit of root dry weight and tissue Zn concentration in oilseed rape (Brassica napus L.). Zn concentrations and uptake by a P-efficient cultivar were significantly lower and more sensitive to P uptake than P-inefficient cultivar, indicating that high P-use efficiency may inhibit Zn uptake in plant. Similar results were found in wheat. An increase in P availability also caused a significant suppression of Zn uptake and tissue Zn concentration in wheat (Zhu et al., 2001). High P uptake efficiency may depress Zn uptake and limit the concentration of Zn in grains of wheat grown in low-P or low-Zn soils. With increasing P concentration in the shoot, Zn deficiency symptoms become more severe, which was associated with physiological availability of Zn in plants, but not the total Zn concentration (Cakmak and Marschner, 1987; Broadley et al., 2011).
Other elements have also been reported to affect Zn uptake. Grewal et al. (1998) reported that Zn uptake in a Zn efficient cultivar was enhanced with the increased rate of B supply under high Zn condition but not in a Zn inefficient cultivar. However, Hosseini et al., (2007) reported that high concentration application of boron (B, 20-80 mg/kg) depressed Zn accumulation, whereas low concentration application of B (2.5- 10 mg/kg) did not affect Zn accumulation. Furthermore, copper (Cu) treatment in leaves was found to decrease the Zn content in soybean, whereas Cu treatment though roots enhanced Zn accumulation (Bernal et al., 2007).
Silicon (Si), the most abundant mineral element in soil, was also reported to affect
Zn accumulation in plants. In maize, Si supply increased the growth, but decreased Zn concentration in leaves under high Zn condition (Kaya et al., 2009). In rice, which is a typical Si accumulating species, Si supply increased shoot biomass and increased Zn concentration under Zn limited condition. However, the mechanisms underlying Si- affected Zn accumulation are unknown.
6. Root structure and uptake system of mineral elements in rice
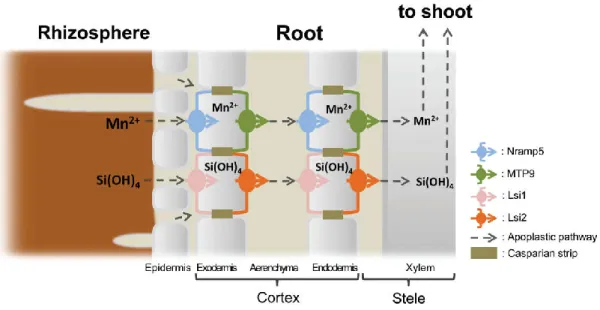
In this study, rice (Oryza sativa) was used as an experimental material. Rice roots have a distinct anatomy, which is characterized by two Casparian strips at both the exodermis and endodermis (Enstone et al., 2002) and a highly developed aerenchyma in mature roots in which almost all of the cortex cells between the exodermis and endodermis are destroyed. Therefore, movement of an element from the soil solution to the stele requires two steps; from the soil solution to the aerenchyma across the exodermal cells, and from apoplastic solution in aerenchyma to stele across the endodermal cells (Ma and Yamaji, 2015; Che et al., 2018). Both influx and efflux transporters are required for this movement at the exodermis and endodermis of the roots (Ma and Yamaji, 2008;
Sasaki et al., 2016); Recently, great progress has been made in understanding the uptake system of some mineral elements in rice. For example, Si uptake is mediated by OsLsi1 (influx) and OsLsi2 (efflux) (Ma et al., 2006; Ma et al., 2007), while Mn uptake is mediated by OsNramp5 (influx) and OsMTP9 (efflux) (Sasaki et al., 2012; Ueno et al., 2015). OsLsi1 and OsNramp5 are polarly localized at the distal side of the exodermis
and endodermis of mature root zones of rice, while OsLsi2 and OsMTP9 are localized at the proximal side of the same cells (Fig. 1.7, Ma et al., 2006; Ma et al., 2007; Sasaki et al., 2012; Ueno et al., 2015). Knockout either of them results in significant decrease of root Si or Mn uptake. However, most transporters involved in uptake of mineral elements including Zn have not been identified.
Figure 1.7 Schematic presentation for efficient uptake systems for manganese (Mn) and silicon (Si) in rice roots (Sasaki et al., 2016).
Chapter 2 Identification of transporter genes involved in Zn uptake in rice
1. Introduction
Transport of Zn has been proposed to be mediated by ZIP family transporters in different plant species. In Arabidopsis, AtZIP1, AtZIP3 and AtZIP4 showed Zn transport activity in yeast (Saccharomyces cerevisiae) mutant, ∆zrt1∆zrt2 and have been proposed to be involved in Zn transport. AtZIP1 and AtZIP3 are mainly expressed in the roots, but AtZIP4 is expressed in both roots and shoots (Grotz et al. 1998;
Guerinot 2000). Over-expression of AtZIP1 increases the Zn accumulation in Arabidopsis (Gaitán-Solís et al., 2015). In barley, HvZIP7 has been reported to be induced by Zn deficiency and localized at the vascular tissues of roots and leaves. Over- expression of HvZIP7 increased Zn uptake (Tiong et al., 2014). Besides HvZIP7, several other ZIP family genes including HvZIP3, HvZIP5, HvZIP8, HvZIP10, HvZIP13 were also reported to be induced by Zn deficiency and the increased expression of these six genes is associated with enhanced uptake and root‐to‐shoot translocation of Zn in barley (Tiong et al., 2015).
In maize, ZmIRT1 showed transport activity in yeast. Expressing of ZmIRT1, ZmZIP3 and ZmZIP7 altered Zn homeostasis and increased the Zn accumulation, revealed that these ZIP transporters may be involved in Zn transport in maize (Li et al.,
2013; Mondal et al., 2013). On the other hand, in rice, several ZIP members have been functionally characterized in terms of transport activity, expression patterns, and ectopic expression analysis. OsZIP1, OsZIP3, OsZIP4, OsZIP5, OsZIP7a, and OsZIP8 showed influx transport activity for Zn in yeast (Ramesh et al., 2003, Ishimaru et al., 2005; Yang et al., 2009; Lee et al., 2010a; Lee et al., 2010b; Tan et al., 2019). However, OsZIP2 in yeast and OsZIP6 in Xenopus oocytes did not show transport activity for Zn (Ramesh et al. 2003; Kavita et al., 2015). Rice ZIP genes also show different expression patterns; OsZIP1, OsZIP4, OsZIP5, OsZIP6, OsZIP7a, and OsZIP8 are expressed in both the roots and shoots (Ramesh et al., 2003; Ishimaru et al., 2005; Kavitha et al., 2015; Yang et al., 2009; Lee et al., 2010a; Lee et al., 2010b; Krishna et al., 2020), whereas OsZIP3 is mainly expressed in the nodes (Sasaki et al., 2015). Furthermore, the expression of OsZIP4, OsZIP5, OsZIP6, OsZIP7a, and OsZIP8 is up-regulated by Zn-deficiency, whereas OsZIP1 and OsZIP3 are constitutively expressed (Suzuki et al., 2012; Sasaki et al., 2015). On the other hand, overexpression of OsZIP4 and OsZIP5 causes decreased Zn accumulation in the shoots, but increased Zn accumulation in the roots (Ishimaru et al., 2007; Lee et al., 2010a). Based on these findings, OsZIP1 has been proposed to function in Zn uptake from soil (Ramesh et al. 2003, Bashir et al.
2012), whereas OsZIP4, OsZIP5, OsZIP7, and OsZIP8 are involved in Zn translocation/distribution in the shoots (Ishimaru et al., 2005; Lee et al., 2010a; Lee et al., 2010b; Sasaki et al., 2015; Tan et al., 2019). However, except for OsZIP3, which is responsible for the preferential distribution of Zn to developing tissues in the nodes (Sasaki et al. 2015), the exact physiological roles of most ZIP genes in planta remain
poorly understood.
In the present chapter, in order to identify transporter genes involved in Zn uptake in rice, I performed RNA-seq using the roots treated with or without Zn for three days. I selected two genes for further functional characterization, OsZIP1 and OsZIP9. OsZIP1 showed the highest expression in the roots among ZIP genes, while OsZIP9 showed the strongest induction by Zn-deficiency.
2. Materials and methods
2.1 Plant materials and growth conditions
Seeds of the wild-type rice (cv. Nipponbare), two independent CRISPR/Cas9 OsZIP9 knockout lines (T2), one RNAi line, and transgenic lines (T2) carrying the promoter of ZIP9 fused with GFP were soaked in water in dark at 30°C. After 2 days, the germinated seeds were placed on a plastic net floating on a 0.5 mM CaCl2 solution in a 1.2-L plastic pot. The seedlings (7-d-old) were transferred to a 3.5-L plastic pot containing 1/2 Kimura B solution (0.4 µM Zn, pH 5.6) (Ma et al., 2002). The nutrient solution was exchanged every 2 days. All plants were grown in a controlled greenhouse at 25–30°C, under natural light.
2.2 RNA sequence analysis
To perform the RNA-seq analysis, 20-day-old seedlings (cv. Nipponbare) were treated with or without 0.4 µM Zn for 1 day and then the roots were sampled for RNA
extraction with three replicates as described below. The RNA extracted was subjected to RNA-sequencing using Illumina HiSeq4000. A total of 16~21 M stranded paired- end (2×100 bp) sequences was obtained for each sample. All data analysis was
performed on the Galaxy/NAAC server
(https://galaxy.dna.affrc.go.jp/nias/static/register_en.html). After quality control by Trimmomatic (Bolger et al., 2014), sequences were mapped to Oryza sativa cv.
Nipponbare reference genome (IRGSP-1.0) by TopHat2 (Kim et al., 2013). Transcript assembly, calculation of normalized transcript abundance (RPKM), and statistics of differential expression (Q-value of False Discovery Rate > 0.05) was performed using Cufflinks (Trapnell et al., 2010).
2.3 Cloning of full-length cDNA of OsZIP1 and OsZIP9
The full-length ORF of OsZIP1 and OsZIP9 was amplified by PCR using primers 5′-
ATGGCCAGGACGATGACGAT-3′ (forward), 5′-
TCAGTCCCAGATCATGACGACAG-3′ (reverse) for OsZIP1 and 5′-
ATGGCTTTCGATCTCAAGCTAAC -3′ (forward) and 5′-
TCAAGCCCAAATACCAAGCAAG-3′ (reverse) for OsZIP9, which were designed based on a putative cDNA clone (Os01g0972200 for OsZIP1 and Os05g0472400 for OsZIP9, respectively) in the Rice Annotation Project Database (http://rapdb.dna.affrc.go.jp/) with a putative translational start and stop site. Total RNA was extracted from rice roots (cv. Nipponbare) using a RNeasy Plant Mini Kit (Qiagen, http://www.qiagen.com) and then converted to cDNA using the protocol
supplied by the manufacturer of ReverTra Ace qPCR RT Master Mix with gDNA remover (TOYOBO). The amplified cDNA was cloned into pGEM®-T vector (Promega, https://www.promega.com/) and the sequence was confirmed by a sequence analyzer (ABI Prism 3130; Applied Biosystems, http://www.appliedbiosystems.com/).
2.4 Phylogenetic analysis
The alignment was performed with ClustalW using default settings (http://clustalw.ddbj.nig.ac.jp/), and the phylogenetic tree was constructed using the neighbor-joining algorithm with MEGA version 6.0 (Tamura et al., 2013). Bootstrap support was calculated (1000 replications).
2.5 Transport activity assay of OsZIP1 and OsZIP9
To investigated the transport activity, the full-length ORF of OsZIP1 and OsZIP9 was
amplified by PCR using primers 5′-
ATCGAGCTCAAAAAAATGGCCAGGACGATGACGAT-3′ (forward) and 5′- GTCAGATCTGTCCCAGATCATGACGACAGCC-3′ (reverse) for OsZIP1, 5′- AGGATCCAAGATGGCTTTCGATCTCAAGCTAAC-3′ (forward) and 5′- TCTCGAGTCAAGCCCAAATACCAAGCAAG-3′ (reverse) for OsZIP9. The resultant constructs were introduced into pYES2 vector (Invitrogen) through restriction sites of SacI and BglII for OsZIP1, BamHI and XhoI for OsZIP9 under the control of galactose-inducible promoter, followed by introducing into a wild-type yeast strain (BY4741; MATa his2Δ0 met15Δ0 ura3Δ0) or the Zn uptake defective double mutant
(ZHY3; MATa ade6 can1 his3 leu2 trp1 ura3 zrt1∷LEU2 zrt2∷HIS3).
Growth of yeast strain ZHY3 expressing empty vector, OsZIP1 or OsHMA2 (positive control) were tested on a synthetic medium containing 2% (w/v) Glu or Gal, 0.67%
(w/v) yeast nitrogen base without metals (BIO 101 Systems), 0.2% (w/v) appropriate amino acids, and 2% (w/v) agar buffered at pH 6 with 50 mM MES and supplemented with 0, 5, 10, 50 or 100 µM ZnSO4. After spotting at five yeast cell dilutions (optical densities at 600 nm of 0.2, 0.02, 0.002, 0.0002 and 0.00002), plates were incubated at 30°C. After 3 days, the plates were photographed.
For OsZIP9 transport activity assay, ZHY3 expressing OsZIP9 or empty vector were grown in the Sc(-Uracil) medium containing 0.67% (w/v) yeast nitrogen base without amino acids (Difco), 2% (w/v) glucose, 0.2% (w/v) appropriate amino acid, and 2%
(w/v) agar at pH 6.0 for selection. The yeast cells were first incubated in Sc(-Uracil) liquid medium with 50 mM MES containing 2% (w/v) galactose or 2% (w/v) glucose (as a negative control) for two hours, followed by washing three times with the sterilized milli-Q water. The yeast cells were then exposed to a solution containing 5 µM of stable isotope 67ZnCl2 (97% enrichment, Taiyo Nippon Sanso, Tokyo, Japan).
At 0, 20, 40, 60, and 120 minutes of incubation with shaking at 30°C, the yeast cells were harvested by centrifugation (2300 g, 5 min). Yeast pellet was washed three times with 5 mM CaCl2 solution and then digested by 2 N HCl for the determination of metals as described below.
To examine the transport activity for Zn, Fe, and Cu, the wild-type yeast cells (BY4741) expressing OsZIP9 or empty vector were prepared as above and then
cultured for 4 hours in the presence of 2% (w/v) galactose for gene induction, followed by exposure to a solution containing 5 µM of each stable isotope including 67ZnCl2 (97%
enrichment), 65CuCl2 (99.7% enrichment), or 57FeCl2 (96.1% 57Fe). 57FeCl2 was prepared from 57FeCl3 by reduction with ascorbic acid. These stable isotopes were purchased from Taiyo Nippon Sanso (Tokyo, Japan). After incubation with shaking for 2 hours at 30°C, the yeast cells were harvested by centrifugation (2300 g, 5 min) and subjected to determination of metals as described below.
2.6 Expression analysis of OsZIP1 and OsZIP9
To investigate the expression pattern of OsZIP1 and OsZIP9 in different organs at different growth stages, we used the same cDNA samples collected in the field as described in Sasaki et al. (2015).
To investigate the response of OsZIP1 and OsZIP9 expression in roots to metal deficiency, 20-d-old seedlings (cv. Nipponbare) were grown in the 1/2 Kimura B solution with or without Mn, Fe, Cu, or Zn for three days. To further examine the time- dependent response, seedlings (20-d-old) were exposed to -Fe or -Zn for 1 and 3 days and root samples were taken for expression analysis as described below.
For spatial expression analysis, different root segments (0–0.5, 0.5–1.0, 1.0–1.5, 1.5–
2.0, 2.0–2.5, and 2.5–3.0 cm from the root tip) were excised from the roots of 5-d-old seedlings.
Samples taken were immediately frozen in liquid nitrogen and then subjected to total RNA extraction using a RNeasy Plant Mini Kit (Qiagen). cDNA was synthesized by
ReverTra Ace qPCR RT Kit (TOYOBO) or SuperScript II (Invitrogen) according to the manufacturer’s instruction. The expression analysis of OsZIP1 and OsZIP9 was determined with SsoFast EvaGreen Supermix (Bio Rad) or KOD SYBR qPCR Mix (TOYOBO) on a real-time PCR machine (CFX384 or CFX96 (Bio-Rad)). Histone H3 and Actin were used as internal controls. Relative gene expression was calculated by the ΔΔCt method. The primer sequences used were 5′-
CGTCATGGCTGTCGTCATGATCTG-3′ (forward), 5′-
AATGGGGTGATAGAAATCGAACATG-3′ (reverse) for OsZIP1, 5′-
ATCTTCTTCTCGCTAACCACAC-3′ (forward), 5′-
GCAGCCGCTGCGTCGAGAAT-3′ (reverse) and 5′-
GTTCTTCGAAGGGATAGGGCT-3′ (forward), 5′-
ATACCGATCATAATCCCAACCG-3′ (reverse) for OsZIP9; 5′-
GGTCAACTTGTTGATTCCCCTCT-3′ (forward), 5′-
AACCGCAAAATCCAAAGAACG-3′ (reverse) for HistoneH3; 5′-
GACTCTGGTGATGGTGTCAGC-3′ (forward), 5′-
GGCTGGAAGAGGACCTCAGG-3′ (reverse) for Actin.
2.7 Generation of transgenic rice lines
For generation of the transgenic lines carrying the promoter of ZIP1 or ZIP9 fused with GFP, the promoter regions of OsZIP1 (2117 bp) and OsZIP9 (3001 bp) were first
amplified with PCR using the primers 5′-
CGGGGTACCTTTAGATGGTATGCAAACAACGAGG-3′ (forward) and 5′-
CGCGGATCCGGTCGTGGCTCGCGCC-3′ (reverse) for pOsZIP1 5′-
TGGTACCCATAAGTTGGGCTGATATTTCAG-3′ (forward) and 5′-
TGGATCCCTTTTTAGCCTGTGGCCAAAGAT-3′ (reverse) for pOsZIP9. The amplified region was introduced into the pGEM®-T easy vector. After confirmation of the sequence, the plasmid was introduced into pPZP2H-lac vector including GFP by KpnI and BamHI, followed by vector transfer to calluses (cv Nipponbare) via A.
tumefaciens-mediated transformation (Hiei et al., 1994).
OsZIP9 knockout lines were generated by using CRISPR/Cas9 using the plant expression vector of Cas9 (pU6gRNA) and single guide RNA expression vector (pZDgRNA_Cas9ver.2_HPT) as described before (Che et al., 2019). Twenty bases upstream of the PAM motif were selected as candidate target sequences (Fig. 2.6A).
Two targets of OsZIP9 were selected. The primers for target sequences in the ORF region of OsZIP9 are 5′-GTTGACCCCGCTGAGCTGCCCACG-3′ (forward) and 5′- AAACCGTGGGCAGCTCAGCGGGGT-3′ (reverse) for oszip9-1; 5′-
GTTGCGAGCGGTCTGATCGTGCTT-3′ (forward) and 5′-
AAACAAGCACGATCAGACCGCTCG-3′ (reverse) for oszip9-2. The derived constructs were transformed into calluses as described above.
To genotype the resultant mutants, genomic DNA was extracted from leaves of transgenic rice plants. PCR amplifications were carried out using primer pairs flanking the designed target sites. The PCR products (about 500 bp) were sequenced directly using internal specific primers, of which the binding positions are desirably at about
200 bp upstream of the target sites. Two homologous knockout lines without Cas9 were selected and the T2 generation was used in the following phenotypic analysis.
An RNAi line was generated according to Miki and Shimamoto (2004). The expression level of OsZIP9 in the RNAi line was investigated as described above.
2.8 Immunostaining analysis for transgenic lines carrying OsZIP1 or OsZIP9 promoter-GFP
To investigate the tissue-specificity of OsZIP1 and OsZIP9 expression, immunostaining was performed in the transgenic lines carrying OsZIP1 promoter-GFP (T0) and OsZIP9 promoter-GFP (T2) by using an antibody against GFP (Thermo Fisher Scientific). For pZIP1-GFP, 3-week-old plants grown in 1/2 Kimura B were used. Cross sections from the root tip (0-1 cm from the tip) and mature region (1-2 cm and 2-3 cm from the root tip) were prepared. For pZIP9-GFP, two-week-old plants grown in 1/2 Kimura B solution were exposed to a solution containing 0.4 µM Zn or not for 5 days. Cross sections from the root tip (0.2 cm from the tip) and mature region (1.5 cm from the root tip) were prepared and the method for immunostaining was the same as described previously (Yamaji et al., 2007). The signal of fluorescence was observed with a confocal laser scanning microscopy (TCS SP8x, Leica Microsystems).
2.9 Subcellular localization of OsZIP9
Subcellular localization of OsZIP9 was investigated by transiently expressing GFP- OsZIP9 fusion into rice protoplasts and onion epidermal cells. The ORF of OsZIP9 was
amplified by PCR from rice (cv Nipponbare) root cDNA using primers with the BsrGI
and NotI site 5′-
ATGTACAAGTTCAGGTTCAGGTGGAATGGCTTTCGATCTCAAGCTAAC-3′
(forward) and 5′-TGCGGCCGCTCAAGCCCAAATACCAAGCAAGG-3′ (reverse).
The ORF was fused with a linker (SSGSGG) and then inserted into the cauliflower mosaic virus 35S GFP vector at the N terminus according to Sasaki et al. (2012). Rice protoplast transformation was performed by the polyethylene glycol method as described previously (Chen et al., 2006). The same plasmid with DsRed was transformed into onion epidermal cells as per the method described previously (Yokosho et al., 2016). The GFP signal was observed with a confocal laser scanning microscope (TCS SP8x, Leica Microsystems).
The subcellular localization of OsZIP9 was also investigated using double staining with 4’,6-diamidino-2-phenylindole (DAPI) as a nuclei marker and an OsZIP9 antibody.
The synthetic peptide (DASSSHDHERGN) was used to immunize rabbits to obtain antibodies against OsZIP9. The antiserum was purified through a peptide affinity column. The roots of WT and the knockout line exposed to -Zn for 4 days were used for the immunostaining. The method for immunostaining and secondary antibody incubation were the same as described previously (Yamaji and Ma, 2007). The fluorescence signal was observed through confocal laser scanning microscopy (TCS SP8x, Leica Microsystems).
2.10 Phenotypic analysis of OsZIP9 knockout lines
The wild-type rice and two independent OsZIP9 knockout lines (T2, oszip9-1, oszip9- 2) generated by CRISPR/Cas9 were used for phenotypic analysis. In a hydroponic solution, seedlings (19-d-old) grown in a 3.5-L plastic pot were transferred to a 1.2-L plastic pot (one plant for each line) with a nutrient solution containing different Zn concentrations; 0.02, 0.2, and 2 µM. The treatment solution was renewed every two days. After 17 days, the plants were photographed. The roots were washed with 5 mM CaCl2 three times and separated from the shoots. The fresh weight of the roots and shoots were recorded. The concentrations of mineral elements in the roots and shoots were determined as described below.
For soil culture, both wild-type rice and two independent knockout lines were grown in a pot containing 3.5 kg soil collected from a field of the Institute of Plant Science and Resources, Okayama University, under flooded conditions. Tap water was supplied daily and a 2-cm water layer was maintained on the top soil. Plants were grown in a temperature-controlled glasshouse (around 22–30°C) under natural light. At the ripening stage, the plant was harvested and separated into straw and brown rice. The concentrations of mineral elements were determined as described below.
2.11 Short-term uptake experiment with stable isotope 67Zn
Seedlings (WT, knockout lines, RNAi line) grown in 0.02 µM Zn for 17 days were exposed to a solution containing 0.4 µM 67Zn. After 24 hours, the roots were washed and separated from the shoots as described above.
A kinetic study of Zn uptake was performed by exposing the seedlings (WT, knockout
lines, RNAi line) grown in -Zn solution for 7 days to different 67Zn concentrations in the range of 0–2 µM at 25°C and 4°C. After 30 min, the roots were washed three times with 5 mM CaCl2 and harvested for element determination as described below.
2.12 Determination of metals in plant and yeast samples
The roots and shoots were dried at 70°C for at least three days before being digested by HNO3 (60%[w/v]) as described previously (Sasaki et al., 2012). The concentrations of mineral elements in digestion solutions derived from plants and yeast were determined by Inductively Coupled Plasma-Mass Spectrometry (ICP-MS, 7700X; Agilent Technologies). The concentrations of 67Zn, 65Cu, and 57Fe were determined with isotope mode. ΔZn, ΔFe, and ΔCu (net Zn, Fe, or Cu increase) were calculated according to Yamaji et al. (2013).
3. Results
3.1 Expression profiles of ZIP family genes in rice roots
Since ZIP family members have been proposed to be involved in Zn transport, in order to identify exact transporter genes involved in Zn uptake, I investigated the expression profile of ZIP family transporter genes in rice roots by using RNA-seq. As a result, among 12 ZIP genes expressed in the roots, OsZIP1 showed the highest expression (Table 2.1). On the other hand, OsZIP9 showed the highest induction by Zn-deficiency, although its expression was very low under normal Zn condition. Therefore, I selected OsZIP1 and OsZIP9 for further functional characterizations.
Table 2.1 Transcription abundance of ZIP transporter family genes in rice roots form RNA-seq results. (FPKM values were shown).
3.2 Results of OsZIP1 3.2.1 Cloning of OsZIP1
We amplified the full-length coding region of OsZIP1 (Os01g0972200) by PCR from complementary DNA (cDNA) of rice roots (cv Nipponbare). OsZIP1 is composed of 2 exons and 1 intron and encodes a protein of 353 amino acids (Fig. 2.1A). OsZIP1 shares 25% identity with OsZIP9 and 10-55% identity with other ZIP members (Fig. 2.2B).
Similar to other rice ZIP members, OsZIP1 protein was predicted to have eight
transmembrane domains (TMHMM Server v. 2.0;
http://www.cbs.dtu.dk/services/TMHMM/) (Fig. 2.1B).
Figure 2.1 Structure diagram of OsZIP1 (A) and trans-membrane domains predicted by TMHMM (B).
Figure 2.2 Sequence analysis of OsZIPs. (A) Phylogenetic analysis of OsZIP9 homologues in rice. OsIRT1, LOC_Os03g46470; OsIRT2, LOC_Os03g46454; OsZIP1, LOC_Os01g74110; OsZIP2, LOC_Os03g29850; OsZIP3, LOC_Os04g52310; OsZIP4,
LOC_Os08g10630; OsZIP5, LOC_Os05g39560; OsZIP6, LOC_Os05g07210;
OsZIP7, LOC_Os05g10940; OsZIP8, LOC_Os07g12890; OsZIP9, LOC_Os05g39540;
OsZIP10, LOC_Os06g37010; LOC_Os01g39540; LOC_Os08g42150; Os02g0702700.
(B) Identity matrix for ZIP proteins in rice. Values show identity of each protein. (C) Alignment of amino acid sequences of OsZIP proteins. Boxes with red line show transmembrane domains.
3.2.2 Transport activity test of OsZIP1
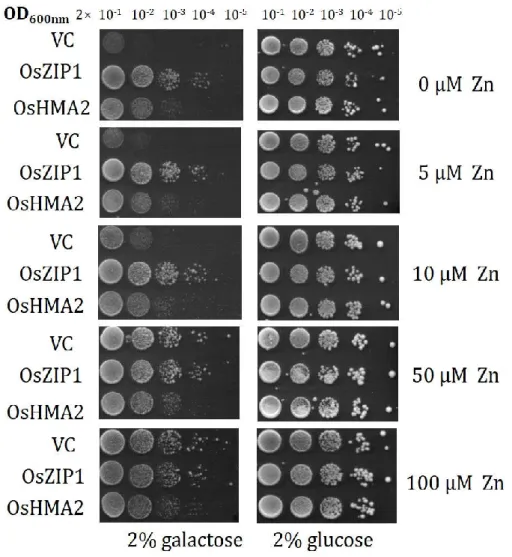
To examine whether OsZIP1 is able to transport Zn, we expressed it in Zn uptake- defective yeast cells (ZHY3) under control of the galactose-inducible promoter. In the presence of galactose (gene induction), similar to OsHMA2 as a positive control (Yamaji et al., 2013), the yeast expressing full-length of OsZIP1 was able to complement the growth at low Zn concentration (0, 5, 10 µM). However, at higher Zn concentrations (50 and 100 µM), the growth did not differ between yeast expressing OsZIP1 and vector control (Fig. 2.3). By contrast, in the presence of glucose (no gene induction), the growth was similar between yeast carrying OsZIP1 or an empty vector (Fig. 2.3). These results indicate that OsZIP1 functions as an influx transporter for Zn in yeast.
Figure 2.3 Transport activity of OsZIP1 for Zn. Growth of ZHY3 (zinc uptake defective yeast strain) expressing empty vector (VC), OsZIP1 or OsHMA2 (positive control). The yeast was incubated on a plate containing 0, 5, 10, 50 and 100 µM Zn in the presence of 2% glucose or galactose for 3 d.
3.2.3 Expression pattern of OsZIP1
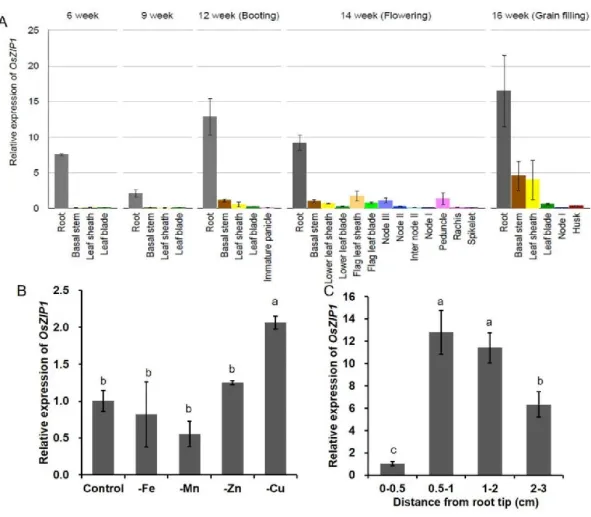
The expression pattern of OsZIP1 was investigated in rice plants grown in either soil or nutrient solution by quantitative reverse transcription PCR (RT-qPCR). In samples derived from rice grown in the field, OsZIP1 was found to be mainly expressed in the roots at all growth stages (Fig. 2.4A). In samples from hydroponically cultivated rice,
the expression of OsZIP1 in the roots was slightly induced by Cu-deficiency, but not by Zn-, Fe- or Mn-deficiency (Fig. 2.4B).
I also investigated the spatial expression pattern of OsZIP1 in different root regions.
The expression of OsZIP1 was very low in the root tip region (0–0.5 cm from the root tip) (Figs. 2.4C). However, higher expression was detected in root mature regions (>1.0 cm, Figs. 2.4C).
Figure 2.4 Expression pattern of OsZIP1. (A) Growth stage- and organ-dependent expression of OsZIP1. Samples of various organs were taken from rice grown in the field at different growth stages. (B) Response of OsZIP1 expression to metal deficiency.
Rice seedlings were grown in the 1/2 Kimura B solution with or without Cu, Zn, Fe, or
segments (0–0.5, 0.5–1.0, 1.0–2.0, and 2.0–3.0 cm from the root tip) were collected from roots of 5-d-old seedlings. The expression level of OsZIP1 was determined by RT- qPCR. Histone H3 was used as internal control. The expression relative to root at 6 weeks (A), control condition (B), and the root segment of 0–0.5 cm (C) are shown. Data are means ±SD of three biological replicates. Statistical comparison was performed by ANOVA followed by Tukey-Kramer’s test. Different letters indicate significant difference (p<0.01).
3.2.4 Tissue specificity of OsZIP1 expression
To investigate the tissue specificity of OsZIP1 expression, we generated transgenic lines carrying the promoter of OsZIP1 fused with GFP. Immunostaining using GFP antibody in pOsZIP1-GFP plants showed that the signal was detected in both root tip (0-1 cm from the tip) and mature regions (1-2 and 2-3 cm from root tip). Furthermore, the GFP signal was detected at exodermis, cortex, endodermis, pericycle and stele in both root tip and mature regions (Fig. 2.5), but not in the epidermis.
Figure 2.5 Tissue specificity of OsZIP1 expression. Immunostaining with a GFP antibody was performed in transgenic rice carrying the OsZIP1 promoter fused with GFP in the root tips (A, 0-1 cm from root tip), mature root regions (B, 1-2 cm) and (C, 2-3 cm from root tip). Wild-type rice was used as a negative control (D). Red color indicates the GFP antibody-specific signal. Blue color indicates cell wall autofluorescence. ex, exodermis; en, endodermis, Scale bars, 100 µm.
3.3 Results of OsZIP9 3.3.1 Cloning of OsZIP9
The full-length coding region of OsZIP9 (LOC_Os05g39540/Os05g0472400) was amplified by PCR from complementary DNA (cDNA) of rice roots (cv Nipponbare).
OsZIP9 is composed of three exons and two introns (Fig. 2.6) and encodes a protein of 363 amino acids. OsZIP9 shares 23–52% identify with other ZIP members (Fig. 2.2B) and forms a separate clade from other ZIP members (Fig. 2.2A). Similar to other rice ZIP members, OsZIP9 protein was predicted to have eight trans-membrane domains (TMHMM Server v. 2.0; http://www.cbs.dtu.dk/services/TMHMM/) (Figs. 2.2C and 2.6C).
Figure 2.6 Mutated sequences of OsZIP9 gene in CRISPR/Cas9 mutants. (A) Two target sites of OsZIP9 by using CRISPR/Cas9 system. White boxes represent UTR regions, black boxes represent exons, the lines between boxes represent introns. The triangles represent the target sites in CRISPR/Cas9 system. (B) Comparison of sequence between wild-type rice (WT) and two CRISPR/Cas9 lines. Oszip9-1 with a 1-bp deletion, oszip9-2 with a 1-bp insertion. (C) Trans-membrane domains predicted by TMHMM.
3.2 Transport activity test of OsZIP9.
To examine whether OsZIP9 is able to transport Zn, we expressed it in Zn uptake–
defective yeast cells (ZHY3) under control of the galactose-inducible promoter. A time- course experiment with stable isotope 67Zn showed that in the presence of glucose (no OsZIP9 expression) there was no difference in Zn accumulation (Δ67Zn) between vector control and yeast expressing OsZIP9 (Fig. 2.7A). However, when the expression of OsZIP9 was induced by the presence of galactose, yeast expressing OsZIP9 showed much higher Δ67Zn compared with the empty vector control (Fig. 2.7B).
To examine the transport specificity of OsZIP9 for metals, the transport activity for Fe, Cu, and Zn was compared by using respective stable isotopes, specifically 67Zn,
65Cu, or 57Fe, in wild-type yeast cells (BY4741). In the presence of galactose, OsZIP9 transported only Zn and not Fe or Cu (Fig. 2.7C).
Figure 2.7 Transport activity of OsZIP9 for metals in yeast cells. (A-B) Time- dependent uptake of OsZIP9 for 67Zn in the presence of glucose (A) and galactose (B).
Zn uptake defective yeast cells (ZHY3) expressing OsZIP9 or empty vector (VC) were exposed to a solution containing 5 µM 67Zn for different time periods. (C) Transport activity for different metals. Wild-type yeast cells (BY4741) expressing OsZIP9 or empty vector (VC) were exposed to a solution containing 5 µM of 67Zn, 57Fe, or 65Cu for two hours in the presence of galactose. The concentration of stable metal isotopes was determined by isotope mode of ICP-MS. ΔMetal was calculated by subtracting the natural abundance of each metal isotope. Data are means ±SD of three biological replicates. The asterisks indicate significant differences (*p<0.05 or**p<0.01 by T-test).
All data were compared with VC in each part.
3.3 Expression pattern analysis of OsZIP9.
The expression pattern of OsZIP9 was also investigated in plants grown in either soil or nutrient solution by RT-qPCR. In the field samples, OsZIP9 was found to be mainly expressed in the roots at all growth stages (Fig. 2.8A). In samples from hydroponically cultivated rice, the expression of OsZIP9 in the roots was strongly induced by Zn- deficiency, but not by Cu- or Mn-deficiency (Fig. 2.8B). OsZIP9 expression was also induced by Fe-deficiency, but to a lesser extent. Time-dependent expression analysis showed that OsZIP9 expression was significantly up-regulated following 1 day and further increased following 3 days of Zn deficiency (Fig. 2.9A). However, 1 day of Fe deficiency did not induce OsZIP9 expression, although expression induction was observed following 3 days of Fe deficiency (Fig. 2.9B).
The spatial expression pattern of OsZIP9 was also investigated in different root regions. The expression of OsZIP9 was very low in the root tip region (0–0.5 cm from the root tip) (Fig. 2.8C). However, higher expression was detected in root mature regions (>1.0 cm).
Figure 2.8 Expression pattern of OsZIP9. (A) Growth stage- and organ-dependent expression of OsZIP9. Samples of various organs were taken from rice grown in the field at different growth stages. (B) Response of OsZIP9 expression to metal deficiency.
Rice seedlings were grown in the 1/2 Kimura B solution with or without Cu, Zn, Fe, or Mn for three days. (C) Spatial expression pattern of OsZIP9 in roots. Different root segments (0–0.5, 0.5–1.0, 1.0–1.5, 1.5–2.0, 2.0–2.5, and 2.5–3.0 cm from the root tip) were collected from roots of 5-d-old seedlings. The expression level of OsZIP9 was determined by RT-qPCR. Histone H3 (A, B) and Actin (C) were used as internal controls. The expression relative to root at 6 weeks (A), control condition (B), and the root segment of 2.5–3.0 cm (C) are shown. Data are means ±SD of three biological replicates. Statistical comparison was performed by ANOVA followed by Tukey- Kramer’s test. Different letters indicate significant difference (p<0.01).
Figure 2.9 Time-dependent response of OsZIP9 to Zn-deficiency and Fe-deficiency in the roots. (A) Time-dependent expression of OsZIP9 in response to Zn-deficiency.
(B) Time-dependent expression of OsZIP9 in response to Fe-deficiency. Rice seedlings were grown in a solution with or without Fe or Zn for different time. The expression level of OsZIP9 in the roots was determined by quantitative real-time RT-qPCR.
Histone H3 was used as an internal control. Data are means ±SD of three biological replicates. Statistical comparison was performed by ANOVA followed by Tukey- Kramer’s test (**P<0.01).
3.4 Tissue specificity of OsZIP9 expression
To investigate the tissue specificity of OsZIP9 expression, transgenic lines carrying the promoter of OsZIP9 fused with GFP were generated. Immunostaining using GFP antibody showed that the signal was very weak in both the root tip (0.2 cm from the root tip) and mature region (1.5 cm from the root tip) of plants supplied with Zn (Fig.
2.10, A and D). However, in Zn-deficient roots, ZIP9 was strongly expressed at the exodermis and endodermis of the root mature region (Fig. 2.10, E, G and H). The signal in the root tip of Zn-deficient plants was also weak, which is consistent with the spatial expression pattern of OsZIP9 (Fig. 2.8C). No signal was detected in wild-type plants (Fig. 2.10, C and F), indicating the specificity of the antibody.
Figure 2.10 Tissue specificity of OsZIP9 expression. Two-week-old plants of transgenic lines carrying the OsZIP9 promoter fused with GFP were exposed to a solution containing Zn (A, D) or not (B, E) for 5 days. The root cross sections from the
root tip (0.2 cm from the tip) (A-C) and mature region (1.5 cm from the tip) (D-F) were prepared and used for immunostaining with an anti-GFP antibody. (G, H) Magnified image of orange box area in (E). (C, F) Wild-type rice roots as a negative control. Red color shows signal from the anti-GFP antibody and blue color from auto fluorescence of cell wall. ex, exodermis; en, endodermis. Scale bar, 25 µm.
3.5 Subcellular localization of OsZIP9
Subcellular localization of OsZIP9 was investigated by transiently expressing a GFP- OsZIP9 fusion in rice protoplasts and onion epidermal cells. In rice protoplasts expressing GFP alone, the GFP signal was detected in the cytoplasm and nuclei (Fig.
2.11, A-D). However, in protoplasts expressing GFP-OsZIP9, the GFP signal was mainly localized to the peripheral membrane of the cells, although some signal was also detected in the endomembrane (Fig. 2.11, E-H). Similar results were obtained in onion epidermal cells (Fig. 2.11, I-L).
To further confirm OsZIP9 subcellular localization, we performed double staining using DAPI and an OsZIP9 antibody. In the roots of plants exposed to -Zn conditions for 4 days, OsZIP9 was localized to the periphery of the cells, outside of the nuclei stained by DAPI (Fig. 2.11, M-P). No signal was detected in the knockout line (Fig.
2.11Q). Taken together, these results indicate that OsZIP9 is most likely localized to the plasma membrane.
Figure 2.11 Subcellular localization of OsZIP9. (A-L) Subcellular localization of OsZIP9 in rice protoplasts and onion epidermal cells. GFP alone (A-D) or OsZIP9 fused with GFP at N-terminal (E-L) was transiently transformed into rice protoplasts (A-H) or onion epidermal cells (I-L). GFP signal (A, E and I), chlorophyll image (B, F), Ds-Red signal (J), bright field (C, G and K) and merged image (D, H and L) are shown. (M-O) Subcellular localization of OsZIP9 in rice roots. Double staining with DAPI (nuclei marker) and OsZIP9 antibody was performed in the roots of wild-type rice (M-P) and oszip9 mutant (Q) exposed to Zn-free solution for 4 days. (N-P) Enlarged image from yellow dotted box in M. The red color shows the signal from the antibody (O) and cyan blue from autofluorescence of cell wall and nuclei stained by DAPI (P). (M-N), Merged image. Scale bar=10 µm (D, H), 100 µm (L), 50 µm (M, Q), 10 µm (N, O, P).
3.6 Phenotypic analysis of OsZIP9 knockout lines in hydroponic and soil culture To investigate the role of OsZIP9 in Zn transport, OsZIP9 knockout lines were generated by the CRISPR/Cas9 technique. Two independent knockout lines with different target positions (oszip9-1 and oszip9-2): one (oszip9-1) with a 1-bp deletion at the first exon, and the other (oszip9-2) with a 1-bp insertion at the second exon, were ued for phenotypic analysis (Fig. 2.6B).
When the wild-type rice and two independent knockout lines were grown in a nutrient solution containing different Zn concentrations (0.02, 0.2, or 2 µM), they showed different phenotypes. At 0.02 µM Zn, growth of the two knockout lines was obviously inhibited compared with wild-type rice (Fig. 2.12A). New leaves showed typical Zn-deficiency symptoms in the knockout lines, but not in the wild-type rice (Fig.
2.12D). The shoot fresh weight of the knockout lines was 65% of the wild-type rice (Fig. 2.12E), although the root fresh weight did not differ between different lines (Fig.
2.13F). However, at 0.2 and 2 µM Zn, growth was similar between wild-type rice and the knockout lines (Fig. 2.12, B, C, E and F).
Mineral element profiles were then compared in the roots and shoots of wild-type rice and the knockout lines exposed to different Zn concentrations. At 0.02 µM Zn, both the concentration and content of Zn in the roots and shoots were significantly lower in the knockout lines than in wild-type rice (Fig. 2.13, A-D). At 0.2 µM Zn, shoot Zn concentration and content were lower in the knockout lines than in wild-type rice, but root Zn concentration and content were similar between different lines. However, Zn concentration and content in both the roots and shoots of the different lines were
comparable at 2 µM Zn (Fig. 2.13, A-D).
Figure 2.12 Phenotypic analysis of OsZIP9 knockout lines in hydroponic solution. (A- C) Phenotype of the wild-type rice and two OsZIP9 knockout lines (oszip9-1 and oszip9-2). Scale bar, 10 cm. (D) Zn-deficiency symptom of new leaf. Scale bar, 2.5 cm.
(E-F) Fresh weight of shoots (E) and roots (F). The plants were grown in a nutrient solution containing 0.02 (A, D), 0.2 µM (B) and 2 µM (C) Zn for 17 days. Data in E and F are means ±SD of three biological replicates. Statistical comparison was performed by ANOVA followed by Tukey-Kramer’s test. Different letters indicate significant difference (p<0.01).
Figure 2.13 Zn concentrations and contents in wild-type rice and OsZIP9 knockout lines. (A-B) Zn concentrations in root (A) and shoot (B) of wild-type rice and knockout lines. (C-D) Zn contents in the roots and shoots. The plants were grown in a nutrient solution containing 0.02, 0.2, or 2 μM Zn for 17 days. Data are means ±SD of three biological replicates. Statistical comparison was performed by ANOVA followed by Tukey-Kramer’s test. Different letters indicate significant difference (p<0.01). All data were compared with the wild-type rice in each treatment.
There was no difference in the concentrations of Ca, Mg, K, P, Fe, Cu, and Mn in the roots of wild-type rice and the knockout lines (Figs. 2.14, A-D and 2.15, A-C); however, the knockout mutants showed higher concentrations of Ca, Mg, Fe, Cu, and Mn in the shoots at 0.02 µM Zn, but not at 0.2 and 2.0 µM Zn (Figs. 2.14, E-F and 2.15, D-F).
Moreover, the contents of these elements except Fe were similar between the different lines at all Zn concentrations tested (Figs. 2.16, E-F and 2.17, D-F), indicating that the higher concentrations observed at 0.02 µM Zn were caused by decreased growth. The shoot concentration and content of K were slightly decreased in the knockout lines, whereas those of P were not altered compared with wild-type rice (Figs. 2.14, G-H and 2.16, G-H).
Figure 2.14 The concentration of macro-elements in the roots and shoots.
Concentration of Ca (A, E), Mg (B, F), K (C, G) and P(D, H)in the root (A-D) and shoots (E-H). Both the wild-type rice and two independent OsZIP9 knockout lines were grown in a nutrient solution containing 0.02, 0.2 µM and 2 µM Zn for 17 days. Data are means ±SD of three biological replicates. Statistical comparison was performed by ANOVA followed by Tukey-Kramer’s test. Different letters mean significant difference (p<0.01).
Figure 2.15 Concentration of Fe, Mn and Cu in the roots and shoots. Concentration of Fe (A, D), Cu (B, E) and Mn (C, F) in the roots (A-C) and shoots (D-F). Both the wild-type rice and two independent OsZIP9 knockout lines were grown in a nutrient solution containing 0.02, 0.2 µM and 2 µM Zn for 17 days. Data are means ±SD of three biological replicates. Statistical comparison was performed by ANOVA followed by Tukey-Kramer’s test. Different letters mean significant difference (p<0.01).
Figure 2.16 Content of macro-elements in the roots and shoots. Content of Ca (A, E), Mg (B, F), K (C, G) and P (D, H) in the roots (A-D) and shoots (E-H). Both the wild-type rice and two independent OsZIP9 knock-out lines were grown in a nutrient solution containing 0.02, 0.2 µM and 2 µM Zn for 17 days. Data are means ±SD of three biological replicates. Statistical comparison was performed by ANOVA followed
by Tukey-Kramer’s test. Different letters mean significant difference (p<0.01). All data were compared with the wild-type rice in each treatment.
Figure 2.17 Content of Fe, Mn and Cu in the roots and shoots. Content of Fe (A, D), Cu (B, E) and Mn (C, F) in the roots (A-C) and shoots (D-F). Both the wild-type rice and two independent OsZIP9 knockout lines were grown in a nutrient solution containing 0.02, 0.2 µM and 2 µM Zn for 17 days. Data are means ±SD of three biological replicates. Statistical comparison was performed by ANOVA followed by Tukey-Kramer’s test. Different letters mean significant difference (p<0.01). All data were compared with the wild-type rice in each treatment.
When grown in soil until maturity, the knockout lines accumulated less than half the amount of Zn in wild-type rice in straw and brown rice (Fig. 2.18). However, the concentrations of other elements, including Cu, Fe, and Mn, in straw and brown rice
concentration of Mn in straw was slightly increased in the knockout lines compared with wild-type rice (Fig. 2.18). Accumulation of Cd and As in straw and brown rice was also compare, but no difference in the accumulation of these two toxic elements was found in either straw or brown rice between wild-type rice and the OsZIP9 knockout lines (Fig. 2.19). Combined together, these results indicate that OsZIP9 is a specific transporter for Zn uptake in rice roots.
Figure 2.18 Comparison of metal accumulation between wild-type rice and two independent OsZIP9 knockout lines grown in soil. (A, B) Metal concentrations in the straw (A) and brown rice (B). Both the wild-type rice and two independent OsZIP9 knockout lines were grown in soil under flooded conditions until maturity. The concentration of different metals was determined by ICP-MS. Data are means ±SD of three biological replicates. Statistical comparison was performed by ANOVA followed by Tukey-Kramer’s test. Different letters indicate significant difference (p<0.01). All data for each element were compared with the wild-type rice.
Figure 2.19 Concertation of Cd and As in straw and brown rice. Both wild-type rice and two independent OsZIP9 knockout lines were grown in soil until maturity. The concentration of Cd (A) and As (B) in the straw and brown rice was determined by ICP- MS. Data are means ±SD of three biological replicates. Statistical comparison was performed by ANOVA followed by Tukey-Kramer’s test. Different letters mean significant difference (p<0.01). All data were compared with the wild-type rice in each treatment.
3.7 Short-term uptake experiments with stable isotope 67Zn
To confirm whether Zn uptake was altered in the knockout lines, a short term (24 h) labeling experiment with stable isotope 67Zn was performed. Following the exposure of Zn-deficient plants to 0.4 µM 67Zn for 24 h, the OsZIP9 knockout lines accumulated much less 67Zn (as ∆67Zn) in both the roots and shoots compared with wild-type rice (Fig. 2.20A). The ∆67Zn uptake in the knockout lines was 41% of wild-type rice (Fig.
2.21B); however, there was no difference in the root-to-shoot translocation of ∆67Zn between the different lines (Fig. 2.20C). To confirm these results, an OsZIP9 RNAi line,
2.21A), was also investigated. Similar to the knockout lines, the ∆67Zn concentration in both the roots and shoots was lower in the RNAi line than in wild-type rice (Fig. 2.21B).
The ∆67Zn uptake in the RNAi line was 66% of that in wild-type rice (Fig. 2.21C), whereas the root-to-shoot translocation was similar between the RNAi line and wild- type rice (Fig. 2.21D).
Furthermore, a kinetic uptake experiment with 67Zn in Zn-deficient plants at 4°C and 25°C was performed. At 4°C, there was no difference in ∆67Zn uptake (30 min) between wild-type rice and the knockout lines (Fig. 2.20D). However, at 25°C, the ∆67Zn uptake was higher in wild-type rice than in the knockout lines, although the uptake increased with increasing 67Zn concentrations in the nutrient solution in all lines (Fig. 2.20D).
The net uptake of ∆67Zn calculated was significantly higher in wild-type rice than in the knockout lines (Fig. 2.20E). Knockdown of OsZIP9 also significantly reduced the net uptake of ∆67Zn (Fig. 2.21E). Together, these results support that OsZIP9 contributes to Zn uptake in rice roots.
Figure 2.20 Short-term labeling experiment with 67Zn. (A) Concentration of Δ67Zn in the roots and shoots. (B) Uptake of Δ67Zn. (C) Root to shoot translocation of Δ67Zn.
The wild-type rice and two independent OsZIP9 knockout lines grown in 0.02 μM Zn conditions for 17 days were exposed to a solution containing 0.4 µM 67Zn for 24 h. (D- E) Kinetic study of 67Zn uptake. Seedlings grown in Zn-deficient solution for 7 days were exposed to a solution containing different concentrations of 67Zn for 30 min at 25°C or 4°C. Net uptake (E) was calculated by subtracting the apparent uptake at 4°C from that at 25°C. Data are means ±SD of three biological replicates. Different letters and asterisks indicate significant difference (p<0.01) compared with wild-type.
Statistical comparison was performed by ANOVA followed by Tukey-Kramer’s test.