地域在住高齢者における咀嚼機能の評価と運動機能との関連
日本大学大学院松戸歯学研究科歯学専攻
五十嵐 憲太郎
(指導:河相 安彦 教授)
1. Abstract 2. 緒言
3.研究方法および結果
3-1.研究Ⅰ:地域在住高齢者における咬合力と膝伸展トルクとの関連 1) 対象者
2) 調査項目 3) 統計解析 4)結果
3-2.研究Ⅱ:疫学調査における検査用グミゼリーを用いた視覚スコア法による咀嚼能 力評価の妥当性
1) 対象者
2) 咀嚼能力の評価 3) 統計解析 4) 結果 4. 考察 5. 結論 6. 参考文献
7. Tables and Figures
1.Abstract Introduction
Recent epidemiological studies suggest that decreased masticatory ability in the elderly is a risk factor for frailty and death. The primary factor that affects masticatory function is the number of remaining teeth in an individual. The Japanese 8020 movement for an oral health campaign has helped increase the number of elders with more residual teeth. However, other factors related to masticatory function, such as occlusal force, are also indicators of decreased masticatory function. Therefore, not only the number of teeth but also functional aspects, such as muscular strength, need to be considered while evaluating masticatory function. Also, to secure the importance of masticatory function in our super-aged society, epidemiological surveys are needed to provide objective and quantitative measures of masticatory function.
Previous studies have shown a significant association between occlusal force and grip strength. However, no study has directly examined the relationship between lower extremity strength and occlusal force, which is directly related to daily life.
On the other hand, occlusal force is a static indicator that indirectly evaluates masticatory ability and does not evaluate direct masticatory ability. Therefore, in order to investigate the relationship with the dynamic exercise functional index such as the walking speed, it is necessary to evaluate the masticatory ability with dynamic elements added. Several methods exist for objectively evaluating masticatory function directly by using test foods such as gummy jelly. However, the validity of the subjective visual evaluation of chewing efficiency has not been assessed.
This study aimed to clarify the relationship between occlusal force and knee extension torque (Research I ), and to verify with an epidemiological study the validity of a visual scoring method using gummy jelly (Research II ).
Research I
Materials and Methods
Participants were 742 residents (315 men and 427 women, mean age 73.3 ± 5.5 years) from Itabashi city, Tokyo. The relationship between occlusal force and knee extension torque was analyzed by multiple regression analysis with consideration of age and sex.
Results and Discussion
The correlation coefficient between the two parameters was significant (r = 0.348, P < 0.001).
Multiple regression analysis revealed that occlusal force was a determinant factor of knee extension torque, in addition to age and sex. A significant correlation was found between the occlusal force and knee extension torque, even after considering other known factors related to knee extension torque. Among the elderly participants, both chewing function and lower limb
motor function were significantly correlated and suggested to be indicators of muscle weakness.
Research II
Materials and Methods
Methods: Community-dwelling elderly individuals (n = 1234) ≥70 years old participated. One evaluator measured visual score (VS) consecutively after participants chewed the gummy jelly (i.e., actual-VS). The chewed jelly was photographed. Two evaluators used the photograph to measure the gummy jelly (i.e., photo-VS). To test the validity of both methods, the correlation between actual-VS and masticatory performance (MP) measured by fully automated method and between photo-VS and MP were analyzed. Inter-rater reliability between the evaluators of photo-VS was analyzed.
Results and Discussion
Significant correlations existed between actual-VS and MP and between photo-VS and MP (r = 0.86-0.87; p < 0.001). The intraclass correlation coefficient of the inter-rater reliability for photo-VS was very high (0.93; p < 0.001; 95% confidence interval: 0.877-0.953); however, the distribution of photo-VS deviated slightly from the actual-VS. A large coefficient of variation in the MP for low VSs suggested the influence of incomplete comminution, which was not reflected by the VS, and the accidental swallowing of small pieces during chewing.
Conclusion
We got the following conclusion.
1. Even after considering other known factors related to knee extension torque, a significant correlation was found between the occlusal force and knee extension torque in a cross-sectional survey of community-dwelling elderly individuals.
2. The validity of using the visual scoring method with gummy jelly was confirmed in a large population-based epidemiological study in which the VS had high correlation and consistency with MP measured by a fully automated method, despite some deviation between VS and MP.
2. 緒言
咀嚼機能の維持は,寿命の延伸1)や高齢者のQOL2)と関連があり,咀嚼機能の低下が フレイルや死亡のリスクファクターである1, 3)ことも疫学調査で報告されている.これ まで我が国では 8020 運動が推進され,高齢者の残存歯数の向上につながっている4). しかし,咀嚼機能に関連するのは歯数のみではないため,その他の要因,特に口腔に関 わる機能低下について疫学調査などで定量的にかつより広く評価・検討する必要がある と考えられる.これまで,咀嚼機能の評価方法が種々検討され,それらを用いて全身の 運動機能との関連が報告されてきた.
咀嚼機能と全身の運動機能との関連は多くの報告があり,咀嚼機能がサルコペニアと 関連するという報告や5),咬筋厚と四肢骨格筋量との関連6)も報告されている.間接的 な評価法のひとつである咬合力では,握力との関連が報告されている7).しかしながら,
歩行など日常生活に直接関係する下肢筋力と咬合力との関係については不明な点が多 い.さらに,加齢による筋力低下は上肢よりも下肢のほうが早く起こるとされており8), 咬合力と下肢筋力の関係を明確にすることは,筋力の観点から見た健康寿命における咀 嚼機能の役割を理解する上で重要であると言える.
一方,咬合力は咀嚼機能を間接的に評価する静的な指標であり,直接的な咀嚼機能を 評価していないことから歩行速度など動的な運動機能指標との関連を検討するには,動 的要素を加えた咀嚼機能の評価が必要である.咀嚼機能を直接的かつ客観的に評価する ため,実際の食物を用いて「咀嚼能力」として評価する方法が検討されおり,これまで にピーナッツ9),チューインガム10),グミゼリー11, 12)などが用いられてきた.特に,グ ミゼリーを用いた咀嚼能力評価は直接的・客観的かつ定量的な評価が可能であり13),こ れまでにグルコース濃度 12)やグミゼリー内部の色素の溶出量 13)から咀嚼能力を算出す る方法が報告され,既に疫学調査で用いられている14-16).しかし,これらの方法は計測 機器が必要であり,その手法や準備が短時間で多数の者を測定する際に煩雑であること が考えられる.このため,グミゼリーの粉砕程度から目視により視覚的に咀嚼能力を判 定する視覚スコア法17)が開発された.視覚スコア法は特別に器具を必要としないため,
検査時間の短縮が期待できる.また,歯科医師でない者が判定しても,歯科医師とほぼ 同等の結果が得られることが報告されている.このことから,多人数を対象とする疫学 調査で有効であると考えられる.しかし,実際に視覚スコア法を用いて行った疫学調査 は報告されておらず,また機器を使用する方法と比較した評価特性も明らかでない.
そこで本研究では,来場型健診を受診した地域在住高齢者を対象に咀嚼機能の評価方 法,および運動機能との関連をより明確にするため,咀嚼機能のうち間接的な評価法で ある咬合力と下肢筋力の指標である膝伸展トルクとの関連を検討し(研究Ⅰ),咀嚼機 能で直接的に咀嚼能力を評価出来るグミゼリーを用いた視覚スコア法の疫学調査にお ける妥当性の検証を行った(研究Ⅱ).
3. 研究方法および結果
3-1. 研究Ⅰ: 地域在住高齢者における咬合力と膝伸展トルクとの関連
1) 対象者
2011~2013 年に住民基本台帳から無作為抽出された,東京都板橋区に在住の 65 歳 以上の男女両方の 1,380 人を対象とした.対象者から介護施設入居者を除いた者に対 し包括的健診への案内を郵送し,最終的に,2013 年 10 月に東京都板橋区にある東京 都健康長寿医療センターで健診を受診したのは791人であった.このうち,口腔関連 検査および膝伸展トルクに関するデータに欠損のない 742人(男性315人,女性 427 人,平均年齢73.3±5.5歳)を対象とした.主観的評価の信頼性を確実にするために,
認知機能の評価指標であるMini-Mental State Examination (MMSE) が24点未満の者を 分析から除外した.なお,本研究は東京都健康長寿医療センター倫理委員会(承認番
号2011-H48)および日本大学松戸歯学部倫理委員会(承認番号EC14-027)の承認を受
け,対象者へのインフォームドコンセントの下実施した.
2) 調査項目 (1) 口腔関連指標 a.咬合力
感圧シート(Dental Prescale 50H type R,GC Corporation,東京,日本)および専用測 定機器オクルーザー(Occluzer,Fujifilm Corporation,東京,日本)で咬合力を分析し た.被験者のフランクフルト平面が床と平行になるよう坐位をとらせ,咬頭嵌合位で できるだけ強くシートを噛むように対象者に指示し測定を1回行った18).義歯を使用 している対象者は義歯装着状態で測定した.
b.残存歯数・機能歯数
残根を除いた,口腔内に萌出している歯の数を残存歯数とした.機能歯数は,残存 歯数にブリッジ,義歯,インプラントなどにより補綴された歯の数を加算したもので ある19).
(2) 身体測定指標 a.BMI
対象者の身長および体重を用いてBMIを算出した.
b.四肢骨格筋量(Skeletal Muscle Mass Index: SMI)
生体電気インピーダンス法を用いた体組成分析装置であるInBody720 (InBody,ソウ ル,韓国)にて四肢骨格筋量を測定した20).
c.握力
握力の測定にはスメドレー式ハンドダイナモメーター(アズワン,大阪,日本)を 用いた.2回測定し,高い方の値を用いた.
d.膝伸展トルク
膝伸展トルクの測定は簡易型膝伸展筋力測定器Isoforce GT610S(OG技研,岡山,
日本)を用いて行った.対象者に坐位をとらせ,膝関節を 90 度屈曲させた開始姿勢 から,等尺性最大膝関節伸展筋力を 2 回測定し,その最大値を採用した.その後,
調査対象者の膝裂隙から外果までの距離をメジャーにて測定し,この距離と重力加速 度を等尺性最大膝関節伸展筋力に乗じて膝伸展トルクを算出した21).
膝伸展トルク(Nm)=等尺性最大膝関節伸展筋力×(膝裂隙~外果間距離)×9.8(m/s2) e.歩行速度
対象者を3mの加速区間,10mの測定区間,3mの減速区間の合計16mの歩行路を一 人で歩行させ,対象者が遊脚層(地面から片足が離れている状態) にあった時点から計 測を開始し,10m測定区間の起点から終点における秒数を計測した.測定は2回行い,
速い方を各対象者の代表値とした.計測秒数で10mを除し,1秒あたりの歩行速度を 算出した.
(3) その他の指標
年齢,性別,および既往歴(高血圧,脳卒中,心臓病,糖尿病,高脂血症,骨粗鬆 症,変形性股関節症,変形性股関節症,骨折の経験,うつ病)は,対象者への聴取に より収集した.血液検査にて血液学的検査結果,ヘモグロビンレベル,総コレステロ ール,および血清アルブミン量を採取した22).そのほか, MMSE 23),抑うつ状態(Zung Self-Rating Depression Scale: SDS)24),日常生活機能(老研式活動能力指標(Tokyo Metropolitan Institute of Gerontology index of competence: TMIG index of competence)25), および転倒不安感尺度26)を調べた.
3) 統計解析
使用した各変数には正規性が認められなかったので,Speaman の順位相関分析を用 いて各項目間の相関を検討した.横断研究である本研究デザインの性質上,因果関係 の特定はできなかったが,膝伸展トルクを目的変数として,重回帰分析により膝伸展 トルクに関連する要因の影響度を把握した.説明変数として,膝伸展トルクと有意な 相関関係を有する項目を選択した.統計分析にはSPSS20.0J for Windows(IBM社,米国) を使用し,有意確率は5%未満に設定した.
4) 結果
(1)参加者の特徴
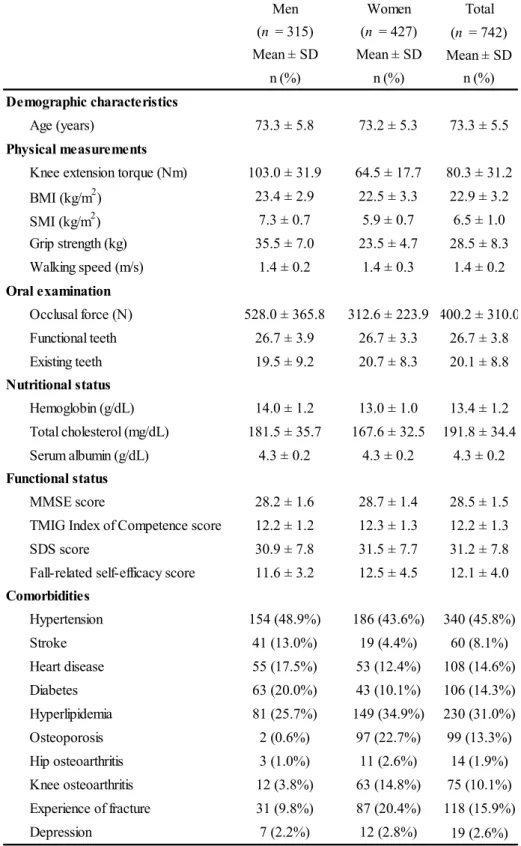
各項目の対象者の特性をTable 1に示す.膝伸展トルクよび咬合力の平均±標準偏差は,
男性で103.0±31.9Nmおよび528.0±365.8N,女性で64.5±17.7Nmおよび312.6±223.9N であった.
(2)膝伸展トルクと他の項目との相関関係
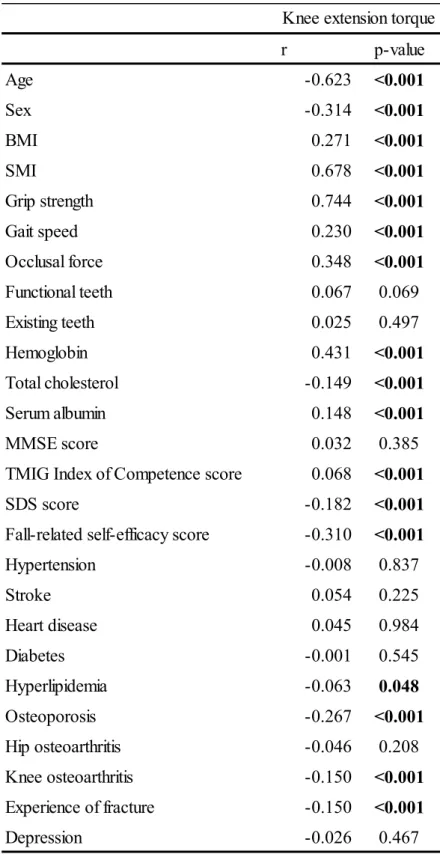
Table 2 に膝伸展トルクと各パラメータの相関係数を示す. 膝伸展トルクと咬合力間
の相関係数は0.348であり,有意な正の相関を示した(p <0.001).
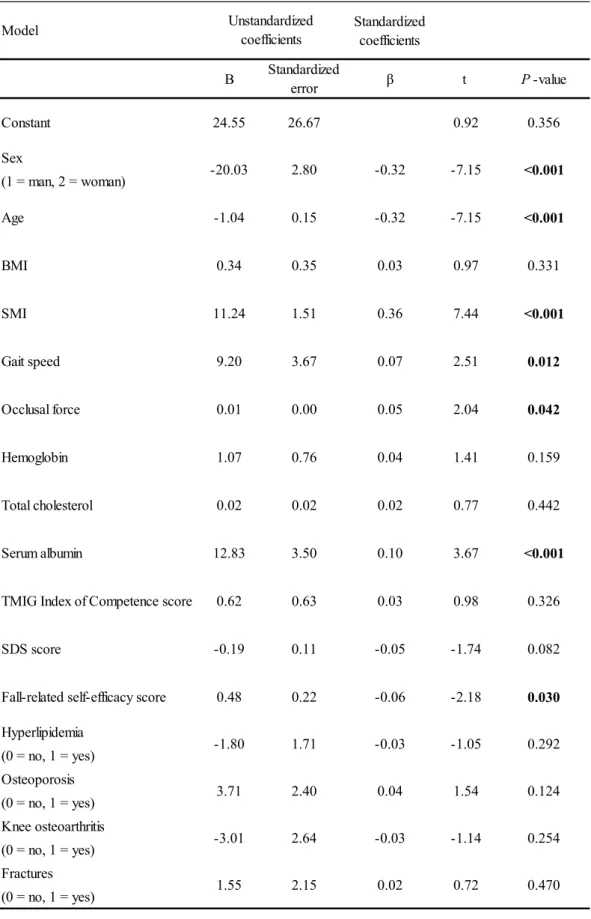
Table 3に膝伸展トルクを従属変数とした重回帰分析の結果と,相関分析において有意 な相関を示した項目を独立変数としたものを示す.多重共線性を回避するため,目的変 数である膝伸展トルクとおなじ筋力の指標である握力を解析から除外した.重回帰分析 の結果は,膝伸展トルクに関連して抽出された因子は年齢,性別,SMI,歩行速度,ア ルブミン,転倒不安感尺度,および咬合力であった(調整R2 = 0.584).このことから咬 合力は膝伸展トルクと関連があることが示唆された.
3-2.研究Ⅱ:疫学調査における検査用グミゼリーを用いた視覚スコア法による咀嚼能力評 価の妥当性
1) 対象者
東京都板橋区高島平地区に在住する住民基本台帳に登録された 70 歳以上の男女全
員(7,614 名)に対して基本属性(年齢, 性別, 日常生活自立度等)・家族状況・健
康状態・生活状況等のアンケートを郵送した.2 週間後に調査員が対象者の自宅に訪 問し記入された調査票を直接回収し,5,430 名(71.3%)から回収された.調査員が訪 問時に来場型検診への参加の意志を確認し,実際に検診に参加し,データの利用につ いて同意が得られた1360 名(男性550 名,女性810 名)が認知機能および既往歴等 の調査を受診し, 後日そのうち 1248 名(男性 506 名,女性 742 名)が運動機能お よび口腔機能等の調査を受診した.調査は2016年10月~12月に東京都板橋区高島平 地区にて実施した.
2) 咀嚼能力の評価
咀嚼能率の評価は,対象者に嚥下せず30回自由にグミゼリー(UHA味覚糖,大阪,
日本)を咀嚼した後,紙カップ上に張られたガーゼ上にグミゼリーを吐き出すように
指示した12, 13).義歯を使用している者は,義歯を装着したまま測定を行った.グミゼ
リーの粉砕片は,視覚スコア法を用いて測定した27).続いて,色素濃度の測定のため の全自動法を行った28).
(1) 視覚スコア法
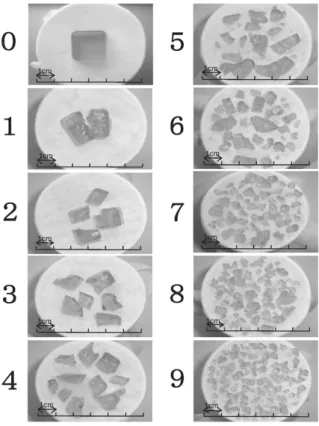
プラスチック製のスパチュラを使用して,紙コップの上に張ったガーゼ上にグミゼ リーの咬断片を広げた.Nokubiら17)による先行研究での方法に従い,結果を安井らに よって吐出したグミゼリーから溶出したグルコース濃度の範囲に基づきスコア化され た視覚情報と比較した 27)(図2).視覚情報は吐出した咬断片を10段階(0~9)に分 類されている.判定は他の人と相談せずに,1人が視覚情報と比較することで30秒以 内に決定した.調査の際の視覚スコアの判定(実測スコア)は,2 人の歯科医師のう ちの1 名によって決定された.一致度を検証するために,紙コップをカップホルダー
(ペーパーカップスタンドクリアキュービック; BSA サクライ,名古屋,日本)に 固定し,試験体から15cm離した位置から規格写真をデジタルカメラ(FinePix AX600;
富士フイルム,東京,日本)を用いて撮影した.撮影した写真を用いて,実測時とは 異なるの2名の歯科医師によって後日スコアを判定した(写真スコア).判定者は事前 にキャリブレーションを行い判定基準の統一を図っている.
(2) 全自動法
全自動法では,グミゼリー中に含まれるβカロテン量から咬断片の表面積増加量を 測定する専用の測定装置(アズワン,大阪,日本)を用いて行った.スコアを判定す るために使用したグミゼリーを,温度35°Cに調整した25 mLの水に入れた専用の測 定セルに投入し,得られた混合物を測定装置に挿入して10秒間攪拌・洗浄した.その 後,測定セルに緑色光で照射し,セルを透過した光の量を感光体で電圧に変換した.
これにより溶出したβカロテンの量を計測した.さらに回帰式を用いて,感光部で発 生した電圧に基づき,咬断片の表面積の増加量(mm2)を算出した13, 28).最終的に算 出された表面積増加量を,全自動法の咀嚼能力(MP)として使用した.
3) 統計解析
Spearmanの相関分析を用いて,実測スコアおよび写真スコアと全自動法との相関を
求めた.また,実測スコアと写真スコアの一致度を評価するために,評価者間信頼度 の級内相関係数を算出した.統計分析は,SPSS23.0J for Windows(IBM社,米国)を使用 し,有意確率は5%未満に設定した.
4) 結果
(1) 対象者の情報
受診した1,248人の対象者のうち,6人が口腔機能の検査を拒否した.したがって,
1,242人の参加者から咀嚼能力データを収集した.機器の誤動作のため参加者のうちの
1 人が全自動法による測定を行うことができず,写真の不備のために 7 人を評価でき なかった.その結果,1,234人の参加者(男性504人,女性730人,平均年齢77.1±4.8 歳)を測定した.
(2) 2種類のスコア法の分布とその相関
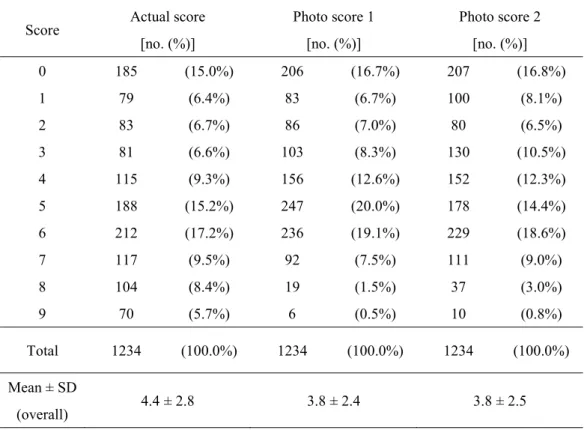
Table 4に,参加者の視覚スコアの分布を示す.対象者の実測スコアと写真スコアの
分布は若干異なり,スコア8と9での写真スコアの対象者の頻度は低かったため,ス コアの平均値は写真スコアよりも実測スコアの方が高い結果を示した.実測スコアと 写真スコアでの評価者間信頼度の級内相関係数は0.93(p <0.001,95%CI: 0.88-0.95) であった.
(3) 視覚スコアと全自動法による咀嚼能力の相関
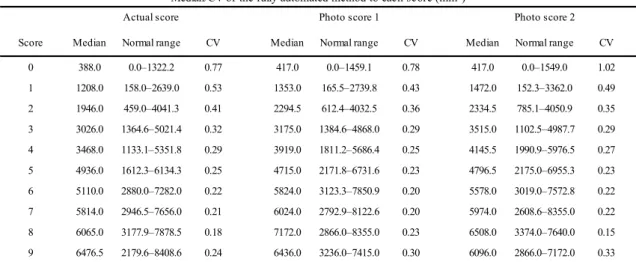
Table 5に各スコアの中央値,範囲およびMPの変動係数を,Fig. 2-a,b,cにスコア
ごとの全自動法による咀嚼能力の箱ひげ図を示す.スコアごとの全自動法の咀嚼能力 は,スコア値が増加するにつれて増加する傾向がみられた.さらに,スコア値の増加 に伴い,スコア毎の全自動法の咀嚼能力の変動係数が減少する傾向がみられた.しか
し,スコア値が高いほど全自動法の咀嚼能力の分布範囲は大きい値を示した.
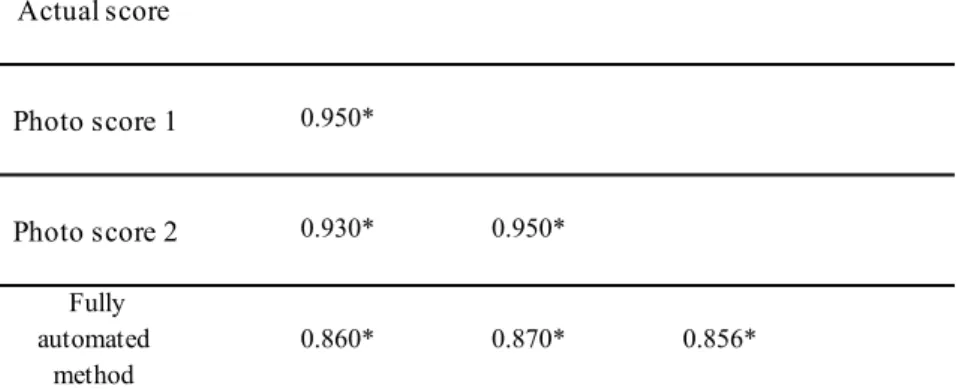
Table 5に視覚スコアと全自動法による咀嚼能力の相関を示す.両者は有意に強い相
関関係を示していた(r = 0.86-0.87,p <0.001).
4. 考察
本研究では,咀嚼機能の評価方法,および運動機能との関連をより明確にするため,
咀嚼機能のうち間接的な評価法である咬合力と下肢筋力の指標である膝伸展トルクと の関連を検討し(研究Ⅰ),咀嚼機能で直接的に咀嚼能力を評価出来るグミゼリーを用 いた視覚スコア法の疫学調査における妥当性の検証を行った(研究Ⅱ).
研究Ⅰでは,地域在住の高齢者における咀嚼機能のうち筋力を評価する咬合力と下肢 筋力の指標である膝伸展トルクとの関係を明らかにした.高齢者における咀嚼機能と一 般的な運動機能との関係は,咀嚼機能とサルコペニア 5) や,咬筋厚と四肢骨格筋量 6) のほか,咬合力と握力の間7)に関連が報告されている.しかし,咬合力と下肢筋力との 間の直接的な関連を報告した研究はこれまでみられなかった.筋肉量や筋力の減少は,
加齢とともに観察される29, 30).しかし,筋力低下は上肢よりも下肢で早く引き起こされ
8),下肢の筋力低下もまた,要介護のリスクファクターとして報告されている31).その ため,咬合力と下肢筋力との関連を明らかにすることは,咀嚼機能と要介護や健康寿命 との関連を明らかにすることにつながる.今回の結果は,咬合力と一般的な筋力の指標 である握力の間の関連を示した先行研究の結果とも一致する7)
本研究では,膝伸展トルクを下肢筋力の指標として用いた. 膝伸展トルクは膝伸展 時の下肢筋力の指標であり,歩行などの運動機能と密接に関連する32).さらに,咬合力 は咀嚼における筋力の指標であり,先行研究においても咀嚼機能の客観的指標として使 用されてきた33).年齢,性別,SMI,歩行速度,アルブミン,転倒関連自己効力感スコ アが膝伸展トルクに関連する要因として抽出された.年齢と性別の関与は当然であるが
34),下肢筋力と筋量および栄養状態との相関35)は結果の信頼性を示し,歩行速度34)およ び転倒36)との相関は結果の妥当性を示していると考えられる.
また,咀嚼筋は抗重力筋として頭部位置の安定化に寄与すると考えられており5),膝 伸展トルクで評価した下肢筋力も抗重力筋である37).咬合力と膝伸展トルクのいずれも,
抗重力筋を評価するための指標であると考えられ.両者の関連は抗重力筋によるものと 考えられる.この関連は先行研究とも矛盾しない5).
今回の研究では膝伸展トルクと残存歯数や機能歯数との相関関係はみられなかった.
平野らは咀嚼能力の向上には残存歯数が多いだけでなく,欠損の補綴による機能歯数と 良好な運動機能も必要とされることが報告されている19).しかし,今回の対象者では,
残存歯数と機能歯数の平均はそれぞれ20.1±8.8本と26.7±3.8本であり,欠損歯数が少 ないのみならず,その欠損も義歯やブリッジにより十分に補綴がなされていたといえる.
このことから,本研究の対象者は残存歯や機能歯の影響はそれほど大きくないと考えら
れ,同時に残存歯数の増加した現代の日本人の高齢者の現状を反映しているといえる.
咬合力の低下を防ぐことで下肢筋力の低下を防ぐことができる可能性が考えられ,逆 に,下肢の筋力を維持することも咬合力を維持するために重要であると考えられる.今 回の結果はあくまで横断研究であり,両者の因果関係は明らかにすることはできなかっ た.そのため,今後縦断研究によって両者の因果関係を明らかにする必要があるといえ る.
一方,研究Ⅱでは,実測時と写真による視覚スコア法により多人数の高齢者の咀嚼能 力を評価した.視覚スコア法は,実測・写真の相互に強い相関性および高い一致度を示 し,両者とも機器を用いた咀嚼能力との強い相関を示した.この結果は,大規模疫学調 査における視覚スコア法の妥当性を示し,同時に,全自動法による機器を用いた咀嚼能 力との相違を明らかにすることが出来た.
実測および写真による視覚スコア法の級内相関係数は 0.93 であり,実測スコアと写 真スコアの相関係数も 0.93-0.95 と非常に強い正の相関を示した.実測スコアと写真ス コアの相関関係は実験的環境での咬断片において先行研究で報告されている17).しかし ながら,実際のスコアと写真スコアの間のスコア分布は本研究ではわずかに異なり,本 研究では写真スコアではスコア4,5のより分布が大きくおよびスコア8,9で分布が少 ない結果となり,実測スコアでの3次元での咬断片とそれらの2次元での画像との差に 起因したと考えられる.このことから,スコアが高い場合の判定は3次元的に咬断片の 粉砕の差異を検出可能な実測スコアの方が優れていると考えられる.しかし,臨床的な 観点からは隣接するスコアを厳密に区分する必要はなく,いずれの判定方法を用いても 咀嚼能力の判定に大きな影響はないと考えられる.そのため,実測スコアと写真スコア のいずれを用いて判定するかは,状況に応じて選択できると考えられる.判定に当たっ ては,スコアを決定するために適切なキャリブレーションを実施し,判断が一定になる よう配慮したが,視覚スコア法は判定者の視力に影響を受ける可能性があり,この点は 視覚スコア法の限界といえる.
本研究では,全自動法による咀嚼能力と各視覚スコア法の相関係数(0.86-0.87)は,
Nokubi らによる先行研究で報告された実験的環境下よりわずかに低い値を示した
(0.957-0.96)17).しかし,全自動法と視覚スコア法の定量的測定値の本質的な違いに
よるものであるため,この結果は大規模疫学調査の状況下では許容範囲内であると考え られる.全自動法での咀嚼能力は粉砕されたグミゼリーの咬断片から溶出したβ-カロ テン量に基づいて,咬断により増加した表面積として計算される28).これに対し視覚ス コア法では,規格化された視覚要素を参考にしてグミゼリーの粉砕状態を目視で観察す ることによりスコアを判定する17).したがって,不完全な咬断によるグミゼリーの表面 積の増加は,全自動法では反映され得るが,視覚スコア法では反映されず,それにより,
スコアが低い場合の全自動法の咀嚼能力値の変動係数が大きくなったと考えられる
(Table 5).したがって,咀嚼能力の微細な変化や咀嚼能力の低下した対象者を正確に評
価するには,全自動法の使用が推奨されるといえる.
本研究は,限られた時間と環境で行う疫学調査で行われたことから,条件設定や手 順・材料などで制約があった.対象者には30 回の咀嚼後に粉砕されたグミゼリーを吐 出するように指示したが,咬断片の偶発的・非自発的な誤飲の可能性を考慮する必要が ある.そのような場合,全自動法で測定されるβ-カロテンの量が減少し,咀嚼能力の 値が低下することが考えられる.しかし,視覚スコア法は判定者がおおよその粉砕状態 を評価してスコアを判定可能なため,測定時には問題とならないと考えられる.また,
吐出されたグミゼリーの重量は測定することが出来なかった.したがって,偶発的な誤 飲によってグミゼリーが減少したかは不明で,今後詳細に検討する必要があると言える.
測定は1日6時間,連続 26日間という長期間にわたって継続しており,全自動法の機 器での水温設定などが一定に保たれていない可能性がある.また,検査に用いたグミゼ リーは現状日本以外では入手が困難であり,他の咀嚼機能検査の方法と視覚スコア法と の比較検証が必要であると言える.
以上のような限界はあるが,本研究結果は,疫学調査における咀嚼能力の定量的尺度 としてグミゼリーによる視覚スコア法の有効性を確認した.視覚スコア法は,特別な器 具や装置を必要とせず,咀嚼機能と全身の健康との関係を明らかにするための種々の調 査に簡便に利用可能であるのみならず,咀嚼機能低下を早期に発見することで,包括的 な口腔機能低下を示した概念である「口腔機能低下症」38)の予防,改善のための介入の 促進が期待できるといえる.
5. 結論
今回の研究結果より,地域在住高齢者に対する疫学調査において咀嚼機能と全身の運 動機能との関連,および咀嚼機能評価法に関して以下の結論を得た.
1. 咀嚼機能の間接的評価法の咬合力と下肢筋力の指標である膝伸展トルクとの関連 が明らかとなり,筋力の点での咀嚼機能と運動機能の関連が明らかであることが示 された.
2. 咀嚼機能の直接的な評価方法としてのグミゼリーを用いた視覚スコア法は,機器 を用いた咀嚼能力とわずかな違いはみられたが,疫学調査において咀嚼能力を評価 する上で妥当性を有する方法であることが示された.
6. 参考文献
1) Nakanishi N, Fukuda H, Takatorige T, et al.: Relationship between self-assessed masticatory disability and 9-year mortality in a cohort of community-residing elderly people, J Am Geriatr Soc, 53: 54-58, 2005.
2) Takata Y, Ansai T, Awano S, et al.: Chewing ability and quality of life in an 80-year-old population, J Oral Rehabil, 33: 330-334, 2006.
3) Tanaka T, Takahashi K, Hirano H, et al.: Oral Frailty as a Risk Factor for Physical Frailty and Mortality in Community-Dwelling Elderly, J Gerontol A Biol Sci Med Sci, 2017.
4) Yamanaka K, Nakagaki H, Morita I, et al.: Comparison of the health condition between the 8020 achievers and the 8020 non-achievers, Int Dent J, 58: 146-150, 2008.
5) Murakami M, Hirano H, Watanabe Y, et al.: Relationship between chewing ability and
sarcopenia in Japanese community-dwelling older adults, Geriatr Gerontol Int, 15: 1007-1012, 2015.
6) Umeki K, Watanabe Y, Hirano H: Relationship between Masseter Muscle Thickness and Skeletal Muscle Mass in Elderly Persons Requiring Nursing Care in North East Japan Int J Oral-Med Sci, 15: 152-159, 2017.
7) Iinuma T, Arai Y, Fukumoto M, et al.: Maximum occlusal force and physical performance in the oldest old: the Tokyo oldest old survey on total health, J Am Geriatr Soc, 60: 68-76, 2012.
8) Frontera WR, Hughes VA, Lutz KJ, et al.: A cross-sectional study of muscle strength and mass in 45- to 78-yr-old men and women, J Appl Physiol (1985), 71: 644-650, 1991.
9) Manly RS, Braley LC: Masticatory performance and efficiency, J Dent Res, 29: 448-462, 1950.
10) Komagamine Y, Kanazawa M, Minakuchi S, et al.: Association between masticatory
performance using a colour-changeable chewing gum and jaw movement, J Oral Rehabil, 38:
555-563, 2011.
11) Shiga H, Kobayashi Y, Arakawa I, et al.: Validation of a Portable Blood Glucose Testing Device in Measuring Masticatory Performance, Prosthodonti Res Pract, 5: 15-20, 2006.
12) Ikebe K, Morii K, Matsuda K, et al.: Reproducibility and Accuracy in Measuring Masticatory Performance Using Test Gummy Jelly, Prosthodonti Res Pract, 4: 9-15, 2005.
13) Nokubi T, Nokubi F, Yoshimuta Y, et al.: Measuring masticatory performance using a new device and beta-carotene in test gummy jelly, J Oral Rehabil, 37: 820-826, 2010.
14) Ikebe K, Matsuda K, Kagawa R, et al.: Association of masticatory performance with age, gender, number of teeth, occlusal force and salivary flow in Japanese older adults: is ageing a risk factor for masticatory dysfunction?, Arch Oral Biol, 56: 991-996, 2011.
15) Kosaka T, Ono T, Kida M, et al.: A multifactorial model of masticatory performance: the Suita study, J Oral Rehabil, 43: 340-347, 2016.
16) Kikui M, Ono T, Kokubo Y, et al.: Relationship between metabolic syndrome and objective masticatory performance in a Japanese general population: The Suita study, J Dent, 56: 53-57, 2017.
17) Nokubi T, Yoshimuta Y, Nokubi F, et al.: Validity and reliability of a visual scoring method for masticatory ability using test gummy jelly, Gerodontology, 30: 76-82, 2013.
18) Matsui Y, Ohno K, Michi K, et al.: A computerized method for evaluating balance of occlusal load, J Oral Rehabil, 23: 530-535, 1996.
19) Hirano H, Ishiyama N, Watanabe I, et al.: Masticatory ability in relation to oral status and general health on aging, J Nutr Health Aging, 3: 48-52, 1999.
20) Baumgartner RN, Koehler KM, Gallagher D, et al.: Epidemiology of sarcopenia among the elderly in New Mexico, Am J Epidemiol, 147: 755-763, 1998.
21) 解良 武士, 河合 恒, 吉田 英世 ほか: 2年後にフレイルから改善した都市在住高齢者の 心身機能の特徴, 理学療法学, advpub, 2015.
22) Zhang Z, Pereira SL, Luo M, et al.: Evaluation of Blood Biomarkers Associated with Risk of Malnutrition in Older Adults: A Systematic Review and Meta-Analysis, Nutrients, 9, 2017.
23) Folstein MF, Folstein SE, McHugh PR: "Mini-mental state". A practical method for grading the cognitive state of patients for the clinician, J Psychiatr Res, 12: 189-198, 1975.
24) Aoki A, Nagate M, Utsumi K, et al.: Can we determine depressive conditions on the basis of somatic symptoms? A cross-sectional study of depressive conditions among Japanese patients at a university hospital general medicine clinic, Intern Med, 51: 1335-1340, 2012.
25) Koyano W, Shibata H, Nakazato K, et al.: Measurement of competence: reliability and validity of the TMIG Index of Competence, Arch Gerontol Geriatr, 13: 103-116, 1991.
26) Tinetti ME, Richman D, Powell L: Falls efficacy as a measure of fear of falling, J Gerontol, 45:
P239-243, 1990.
27) 安井 栄, 野首孝祠, 吉牟田陽子ほか : 検査用グミゼリーによる咀嚼能率スコア法の臨 床活用に向けた信頼性の検討, 日咀嚼会誌, 22: 11-17, 2012.
28) Nokubi T, Yasui S, Yoshimuta Y, et al.: Fully automatic measuring system for assessing masticatory performance using beta-carotene-containing gummy jelly, J Oral Rehabil, 40:
99-105, 2013.
29) Cruz-Jentoft AJ, Baeyens JP, Bauer JM, et al.: Sarcopenia: European consensus on definition and diagnosis: Report of the European Working Group on Sarcopenia in Older People, Age Aging, 39: 412-423, 2010.
30) Chen LK, Liu LK, Woo J, et al.: Sarcopenia in Asia: consensus report of the Asian Working Group for Sarcopenia, J Am Med Dir Assoc, 15: 95-101, 2014.
31) Akune T, Muraki S, Oka H, et al.: Incidence of certified need of care in the long-term care insurance system and its risk factors in the elderly of Japanese population-based cohorts: the
ROAD study, Geriatr Gerontol Int, 14: 695-701, 2014.
32) Bean JF, Kiely DK, Herman S, et al.: The relationship between leg power and physical performance in mobility-limited older people, J Am Geriatr Soc, 50: 461-467, 2002.
33) Hidaka O, Iwasaki M, Saito M, et al.: Influence of clenching intensity on bite force balance, occlusal contact area, and average bite pressure, J Dent Res, 78: 1336-1344, 1999.
34) Hayashida I, Tanimoto Y, Takahashi Y, et al.: Correlation between muscle strength and muscle mass, and their association with walking speed, in community-dwelling elderly Japanese individuals, PloS one, 9: e111810, 2014.
35) Bartali B, Frongillo EA, Stipanuk MH, et al.: Protein intake and muscle strength in older persons: does inflammation matter?, J Am Geriatr Soc, 60: 480-484, 2012.
36) Society AG, Society BG, Prevention AAoOSPoF: Guideline for the prevention of falls in older persons., J Am Geriatr Soc, 49: 664-672, 2001.
37) Suzuki Y, Iwamoto S, Haruna Y, et al.: Effects of 20 days horizontal bed rest on mechanical efficiency during steady state exercise at mild-moderate work intensities in young subjects, J Gravit Physiol, 4: S46-52, 1997.
38) Minakuchi S, Tsuga K, Ikebe K, et al.: Oral hypofunction in the older population: Position paper of the Japanese Society of Gerodontology in 2016, Gerodontology, 2018.
7. Figures and Tables
Figure 1. Visual data used for the measurement of the scored masticatory ability
Figure 2. Box-plot diagrams of the actual, photo 1, and photo 2 scores and the fully
automated method. (a) Actual score. (b) Photo score 1. (c) Photo score 2.
Table 1. Demographic and clinical data of the study subjects
SD, standard deviation
Total (n = 742) Mean ± SD
n (%) 73.3 ± 5.5 80.3 ± 31.2
22.9 ± 3.2 6.5 ± 1.0 28.5 ± 8.3
1.4 ± 0.2 400.2 ± 310.0
26.7 ± 3.8 20.1 ± 8.8 13.4 ± 1.2 191.8 ± 34.4
4.3 ± 0.2 28.5 ± 1.5 12.2 ± 1.3 31.2 ± 7.8 12.1 ± 4.0 340 (45.8%)
60 (8.1%) 108 (14.6%) 106 (14.3%) 230 (31.0%) 99 (13.3%)
14 (1.9%) 75 (10.1%) 118 (15.9%)
19 (2.6%) Experience of fracture 31 (9.8%) 87 (20.4%)
Depression 7 (2.2%) 12 (2.8%)
Hip osteoarthritis 3 (1.0%) 11 (2.6%)
Knee osteoarthritis 12 (3.8%) 63 (14.8%)
Hyperlipidemia 81 (25.7%) 149 (34.9%)
Osteoporosis 2 (0.6%) 97 (22.7%)
Heart disease 55 (17.5%) 53 (12.4%)
Diabetes 63 (20.0%) 43 (10.1%)
Hypertension 154 (48.9%) 186 (43.6%)
Stroke 41 (13.0%) 19 (4.4%)
Fall-related self-efficacy score 11.6 ± 3.2 12.5 ± 4.5 Comorbidities
TMIG Index of Competence score 12.2 ± 1.2 12.3 ± 1.3
SDS score 30.9 ± 7.8 31.5 ± 7.7
Functional status
MMSE score 28.2 ± 1.6 28.7 ± 1.4
Total cholesterol (mg/dL) 181.5 ± 35.7 167.6 ± 32.5
Serum albumin (g/dL) 4.3 ± 0.2 4.3 ± 0.2
Nutritional status
Hemoglobin (g/dL) 14.0 ± 1.2 13.0 ± 1.0
Functional teeth 26.7 ± 3.9 26.7 ± 3.3
Existing teeth 19.5 ± 9.2 20.7 ± 8.3
Oral examination
Occlusal force (N) 528.0 ± 365.8 312.6 ± 223.9
Grip strength (kg) 35.5 ± 7.0 23.5 ± 4.7
Walking speed (m/s) 1.4 ± 0.2 1.4 ± 0.3
BMI (kg/m2) 23.4 ± 2.9 22.5 ± 3.3
SMI (kg/m2) 7.3 ± 0.7 5.9 ± 0.7
Physical measurements
Knee extension torque (Nm) 103.0 ± 31.9 64.5 ± 17.7 Demographic characteristics
Age (years) 73.3 ± 5.8 73.2 ± 5.3
Men (n = 315)
Women (n = 427) Mean ± SD
n (%)
Mean ± SD n (%)
Table 2. Spearman’s correlation coefficient between the variables
r p-value
Age -0.623 <0.001
Sex -0.314 <0.001
BMI 0.271 <0.001
SMI 0.678 <0.001
Grip strength 0.744 <0.001
Gait speed 0.230 <0.001
Occlusal force 0.348 <0.001
Functional teeth 0.067 0.069
Existing teeth 0.025 0.497
Hemoglobin 0.431 <0.001
Total cholesterol -0.149 <0.001
Serum albumin 0.148 <0.001
MMSE score 0.032 0.385
TMIG Index of Competence score 0.068 <0.001
SDS score -0.182 <0.001
Fall-related self-efficacy score -0.310 <0.001
Hypertension -0.008 0.837
Stroke 0.054 0.225
Heart disease 0.045 0.984
Diabetes -0.001 0.545
Hyperlipidemia -0.063 0.048
Osteoporosis -0.267 <0.001
Hip osteoarthritis -0.046 0.208
Knee osteoarthritis -0.150 <0.001 Experience of fracture -0.150 <0.001
Depression -0.026 0.467
Knee extension torque
Table 3. Coefficients of multiple regression analysis
Dependent variable: knee extension torque; adjusted R2 = 0.584
Model Standardized
coefficients B Standardized
error β t P-value
Constant 24.55 26.67 0.92 0.356
Sex
(1 = man, 2 = woman)
Age -1.04 0.15 -0.32 -7.15 <0.001
BMI 0.34 0.35 0.03 0.97 0.331
SMI 11.24 1.51 0.36 7.44 <0.001
Gait speed 9.20 3.67 0.07 2.51 0.012
Occlusal force 0.01 0.00 0.05 2.04 0.042
Hemoglobin 1.07 0.76 0.04 1.41 0.159
Total cholesterol 0.02 0.02 0.02 0.77 0.442
Serum albumin 12.83 3.50 0.10 3.67 <0.001
TMIG Index of Competence score 0.62 0.63 0.03 0.98 0.326
SDS score -0.19 0.11 -0.05 -1.74 0.082
Fall-related self-efficacy score 0.48 0.22 -0.06 -2.18 0.030 Hyperlipidemia
(0 = no, 1 = yes) Osteoporosis (0 = no, 1 = yes) Knee osteoarthritis (0 = no, 1 = yes) Fractures (0 = no, 1 = yes)
-3.01 2.64 -0.03 -1.14 0.254
1.55 2.15 0.02 0.72 0.470
-1.80 1.71 -0.03 -1.05 0.292
3.71 2.40 0.04 1.54 0.124
<0.001 Unstandardized
coefficients
-20.03 2.80 -0.32 -7.15
Table 4. The frequency of each score
The actual score is the score determined on the day of the survey. The photo score is determined using the obtained photograph.
SD, standard deviation.
Number of participants Score Actual score
[no. (%)]
Photo score 1 [no. (%)]
Photo score 2 [no. (%)]
0 185 (15.0%) 206 (16.7%) 207 (16.8%)
1 79 (6.4%) 83 (6.7%) 100 (8.1%)
2 83 (6.7%) 86 (7.0%) 80 (6.5%)
3 81 (6.6%) 103 (8.3%) 130 (10.5%)
4 115 (9.3%) 156 (12.6%) 152 (12.3%)
5 188 (15.2%) 247 (20.0%) 178 (14.4%)
6 212 (17.2%) 236 (19.1%) 229 (18.6%)
7 117 (9.5%) 92 (7.5%) 111 (9.0%)
8 104 (8.4%) 19 (1.5%) 37 (3.0%)
9 70 (5.7%) 6 (0.5%) 10 (0.8%)
Total 1234 (100.0%) 1234 (100.0%) 1234 (100.0%)
Mean ± SD
(overall) 4.4 ± 2.8 3.8 ± 2.4 3.8 ± 2.5
Table 5. The median and correlation of variance of each score, compared with the findings from the fully automated method
The actual score is determined on the day of the survey. The photo score is determined using the obtained photograph. The normal range is between the 2.5th percentile and 97.5th percentile.
CV, coefficient of variation: (SD/Mean)
Score Median Normal range CV Median Normal range CV Median Normal range CV
0 388.0 0.0–1322.2 0.77 417.0 0.0–1459.1 0.78 417.0 0.0–1549.0 1.02
1 1208.0 158.0–2639.0 0.53 1353.0 165.5–2739.8 0.43 1472.0 152.3–3362.0 0.49
2 1946.0 459.0–4041.3 0.41 2294.5 612.4–4032.5 0.36 2334.5 785.1–4050.9 0.35
3 3026.0 1364.6–5021.4 0.32 3175.0 1384.6–4868.0 0.29 3515.0 1102.5–4987.7 0.29
4 3468.0 1133.1–5351.8 0.29 3919.0 1811.2–5686.4 0.25 4145.5 1990.9–5976.5 0.27
5 4936.0 1612.3–6134.3 0.25 4715.0 2171.8–6731.6 0.23 4796.5 2175.0–6955.3 0.23
6 5110.0 2880.0–7282.0 0.22 5824.0 3123.3–7850.9 0.20 5578.0 3019.0–7572.8 0.22
7 5814.0 2946.5–7656.0 0.21 6024.0 2792.9–8122.6 0.20 5974.0 2608.6–8355.0 0.22
8 6065.0 3177.9–7878.5 0.18 7172.0 2866.0–8355.0 0.23 6508.0 3374.0–7640.0 0.15
9 6476.5 2179.6–8408.6 0.24 6436.0 3236.0–7415.0 0.30 6096.0 2866.0–7172.0 0.33
Median/CV of the fully automated method to each score (mm2)
Actual score Photo score 1 Photo score 2
Table 5. The correlation coefficient for each of the masticatory ability measurement items
The actual score is the score determined on the day of the survey. The photo score is the score determined using the obtained photograph.
* : p < 0.001
Actual score Photo score 1 Photo score 2
Fully automated
method Actual score
Photo score 1 0.950*
Photo score 2 0.930* 0.950*
Fully automated
method
0.860* 0.870* 0.856*