Raman Spectroscopy for Real Time Monitoring of
Cancer in Live Mouse Models
著者(英)
Akinori Taketani
学位名
博士(理学)
学位授与機関
関西学院大学
学位授与番号
34504甲第664号
Thesis of Doctoral Degree
Raman Spectroscopy for Real Time Monitoring of Cancer in
Live Mouse Models
Department of Bioscience, Graduate School of Science and
Technology
Kwansei Gakuin University
Akinori Taketani
February 28, 2018
Abstract
The purpose of these studies was to develop Raman spectroscopic techniques to support in situ cancer diagnosis during endoscopic observation. Reliable diagnostic techniques are essential for cancer diagnosis, which may reduce invasiveness and provide objective data, thus improving the accuracy of endoscopic diagnosis.
The aim of the first study was to evaluate the capability of a miniaturized Raman endoscope (mRE) system to monitor the advancement in colorectal tumors in a mouse model. The endoscope was narrow enough to observe the internal portion of the mouse colon in a semi-noninvasive method, following anesthesia treatment. The mRE system allowed the visualization and Raman spectral measurement of any targeted point within the colorectal tumor in the model animal under anesthesia, with no damage to the tissue (i.e., noninvasive method). Continuous monitoring of the same tumor allowed observation of the alteration in its molecular composition and size, as well as the tumor advancement. The tumor lesion was distinguished from the normal tissues of the control mouse at an accuracy of 86.8%. The Raman spectra obtained from the live mouse colon revealed molecular changes in lipid and protein profiles. As the next step, it would be necessary to evaluate the effectiveness of the mRE system.
In the second study, the effects of anticancer drugs were studied using the mRE system in the mouse model. Three anticancer drugs, 5-fluorouracil (5-FU), cisplatin (CDDP), and docetaxel were employed for this purpose. This study demonstrated that in
situ Raman analysis is highly sensitive in detecting the effects of anticancer drugs. On the
other hand, a noninvasive technique was developed to collect images, as one of the standards for diagnosis.
autofluorescence hyperspectral imaging (AF-HSI) and Raman spectroscopy. AF-HSI images reflected the distribution of intact fluorescence materials such as nicotinamide adenine dinucleotide (NADH), flavin adenine dinucleotide (FAD), and collagen in the subcutaneous tumor in a live mouse model. Raman spectroscopy showed the difference in blood flow between the active and non-active areas with NADH imaging. AF-HSI image in situ and Raman spectroscopy revealed the distribution of collagen type I. AF-HSI images gathered information that was inaccessible using tissue sections. The measurement methods using the mouse model, Raman spectroscopy, and autofluorescence imaging were important tools to study cancer progression and anticancer drug treatment.
<<CONTENTS>>
General Introduction………..……...1
Rererences………8
Chapter Ⅰ : Raman Endoscopy for the in situ investigation of
advancing colorectal tumors in live model mice………11
Ⅰ - 1. Abstract……….12
Ⅰ - 2. Introduction………..13
Ⅰ - 3. Material and Methods...………15
1. Preparation of AOM–DSS colorectal cancer model mice 2. Raman measurements 3. Procedure for endoscopic observation 4. Histopathological study 5. Data analysis
Ⅰ - 4. Results………...18
1. Raman measurements of colorectal tumors in model mice 2. Analysis of Raman spectra from colorectal tumors in model mice
Ⅰ - 5. Discussion……….……….26
Ⅰ - 6. Conclusion……….28
Ⅰ - 7. Acknowledgements………...………29
Chapter ⅠⅠ : Raman Endoscopy for Monitoring Anticancer Drug
Treatment of Colorectal Tumors in Live Mice...33
ⅠⅠ - 1. Abstract………34
ⅠⅠ - 2. Introduction……….………35
ⅠⅠ - 3. Material and Methods.………...38
1. Preparation of the AOM-DSS colorectal cancer model mice 2. Anticancer drug treatment 3. Raman measurements 4. Procedure for endoscopic observation 5. Histopathological study 6. Data analysis
ⅠⅠ - 4. Results………..41
1. Observation of the same tissue before and after drug treatment 2. Comparison of effects among 3 anticancer drug treatments
ⅠⅠ - 5. Discussion……….52
ⅠⅠ - 6. Conclusion………...………54
ⅠⅠ - 7. References………55
Chapter ⅠⅠⅠ : Raman spectroscopy and autofluorescence image for the
in situ investigation of tumor constructions in live
subcutaneous mice model...58
ⅠⅠⅠ - 1. Abstract………..………59
ⅠⅠⅠ - 2. Introduction………...60
ⅠⅠⅠ - 3. Material and Methods...……….63
1. Preparation of the DLD-1 subcutaneous cancer model mice 2. Autofluorescence Hyper Spectral Raman Image 3. Raman measurement 4. Raman imaging 5. Histropathological study 6. Data analysis
ⅠⅠⅠ – 4. Results...66
ⅠⅠⅠ - 5. Discussion...70
ⅠⅠⅠ – 6. Conclusion...71
ⅠⅠⅠ – 7. References...72
General conclusion...75
Aknowledgements...77
List of Publications...78
- 1 -
General Introduction
Colorectal cancer is the most common cause of cancer deaths in women and the third most common cause of cancer deaths in men in Japan1. In Japan, colon examination is conducted through screening tests for the early detection and diagnosis of colorectal cancer. Patients are diagnosed with other methods upon detection of blood in the stool. A blood test is generally the second preferred method for the detection of cancer markers and may be the most convenient method with less impact on the patient’s health2. Precision examination is performed after the blood test. Endoscope test and histopathology using tissue biopsy are standard methods that directly analyze lesions in the colon3. The reliability of endoscopic observations largely depends on the knowledge and skill of the clinicians. J. C. Rijn reported a global miss rate of 21% in the detection of colorectal polyps with endoscopy4. This report is expected to improve the accuracy of the endoscopic diagnosis. Some additional techniques have been developed to allow visualization of the fine texture of the tissue surface during endoscopy, such as spraying indigo carmine dye, narrow band imaging observation, and auto-fluorescence imaging5-7. Cancer diagnosis based on visual observation fully relies on the pattern recognition ability or “esthetic eyes'” of clinicians. In addition to the direct observation of colorectal cancer with an endoscope, a few methods that allow cancer detection in a completely noninvasive manner include X-ray computed tomography (X-CT), magnetic resonance imaging (MRI), and positron emission tomography (PET), which allow visualization of the tumor shape8-10. Although the accuracy of diagnosis by X-CT, MRI, and PET is increasing every year, the results may not be convincing enough for the clinicians. As X-ray CT poses the risk of the exposure to radiation, it is not easily recommended to patients from time to time. MRI may pose difficulty in the clear observation of the colon structure,
- 2 -
as the colon moves during peristaltic exercise and the measurements may take a long time. Although PET is a powerful technology to detect metastasized cancer, very few hospitals have this facility. These techniques (X-CT, MRI, PET, and endoscopy) rely on the morphological observations such as the shape and size of the suspicious lesion, and clinicians often require additional direct observation of the tissue to make confirmatory diagnosis. Histopathology with tissue biopsy is a gold standard for the definite diagnosis of cancer. However, it is highly invasive and requires a long time for sample preparation before microscopic observation. The number of pathologists in 2017 is 2,405, and the number of hospitals is 8,439. It is concerned that the load of pathologists increases rapidly as the number of biopsy required increases. Hence, reliable diagnostic techniques that reduce invasiveness and provide objective data are desirable to improve the accuracy of endoscopy-based cancer diagnosis.
In recent years, Raman spectroscopy has attracted the attention of researchers as a technique for cancer diagnosis. It is one of the measurement techniques that provide subjective data of biological samples with low invasiveness. In 1928, C. V. Raman discovered scattered light exhibiting different frequencies upon irradiation of carbon tetrachloride (CCl4) with monochromatic light, for which he was awarded the Nobel Prize in 1930. This phenomenon, termed as the Raman effect, after his name11,12, is attributed to energy transition in a molecule between the ground state and the excited vibrational state. As the vibrational level is unique to the molecule, vibrational spectroscopy is able to determine and identify molecules present in any sample. The applications of Raman spectroscopy were limited until the development of the first laser in 1960. Many researchers have used Raman spectroscopy to study biological samples, owing to its low invasiveness13. Ozaki et al. obtained the Raman spectra of proteins from the eye lens using
- 3 -
argon ion visible excitation laser (488 nm)14. However, almost all biomaterials emit strong fluorescence and are weak substrates for laser illumination15. Fluorescence may pose a problem while using Raman spectroscopy for biological samples. In 1980s, Fourier transform (FT) Raman spectroscopy that employs an oscillation line of Nd-YaG laser at 1064 nm for light excitation was developed to eliminate fluorescence noise15,16. Raman spectra of many biological samples were successfully obtained using FT Raman spectroscopy. However, the detection sensitivity was low and the time to measure FT Raman spectrum was considerable. In the 1990s, a different type of near-infrared (NIR) excitation Raman spectrometer equipped with a sensitive and commercial charge-coupled device (CCD) detector, a high throughput dispersion spectrometer, and an NIR diode laser that emitted light from 700 to 860 nm wavelength became popular. This instrument allowed the measurement of Raman spectrum in a shorter time than that with the FT Raman instrument. Coupling it with an optical fiber was easy, as NIR light exhibits high throughput in normal glass fiber for biomedical Raman spectroscopy17,18.
In comparison with other vibrational spectroscopy techniques, NIR excitation Raman spectroscopy offers some advantages. Fourier transformed infrared (FT-IR) absorbance spectroscopy, a technique related to Raman spectroscopy, is one of the vibrational spectroscopy methods19 used for the analysis of organic materials. However, FT-IR spectroscopy may not be useful for biomedical study. As water has high absorption in infrared and NIR regions, it is difficult to measure water-based samples such as biological samples with FT-IR spectroscopy. Materials with covalent bonds exhibit vibrational energy. IR light has very low penetration efficiency for most of the optical materials. Currently, very few materials are available for optical fiber IR light. In contrast, visible and NIR light (~1200 nm) are used for the measurement of Raman spectrum. Glass
- 4 -
and water have no absorption in these regions. Moreover, the Raman band of water does not overlap with the finger print region (~1800 cm−1) of usual organic materials. All these features deem Raman spectroscopy suitable for bioanalysis.
Raman spectra of biological materials comprise complex bands, owing to the overlapping peaks arising from various chemical materials20. Chemometrics, a mathematical technique based on statics, is applied to analyze complex data and extract useful information from a series of datasets for easy understanding. Chemometrics allows visualization and easy understanding of the change in the data group without arbitrariness, thereby serving as an important tool for the analysis of Raman spectra of biological samples.
Many researchers have reported in situ analysis of cancers by Raman spectroscopy and fiber optic Raman probes. Raman spectroscopy was applied for the first time to explore the implications of early detection of neoplastic lesions in the human stomach during clinical gastroscopic observation. Bergholt et al. developed a 1.8-mm diameter Raman probe for its use in the human stomach21 and suggested that cancerous tissues could be identified in the stomach and esophagus at an accuracy of 89.3% and 94.7%, respectively, using Raman spectroscopy and partial least squares-discriminant analysis (PLS-DA) as one of the chemometrics22. Furthermore, Haka et al. suggested the application of Raman endoscopy for human breast cancer diagnosis (ex vivo study)23.
The purpose of this study was to develop Raman spectroscopic techniques for supporting in situ cancer diagnosis with endoscopic observation. This study may provide objective data to clinicians to improve the accuracy of endoscopic diagnosis. In this direction, fundamental research on colorectal cancer tissues using Raman spectroscopy is desirable. Many researchers have developed techniques to discriminate between benign
- 5 -
and malignant tumor. Clinicians may not rely on Raman spectroscopy data for making confirmatory diagnosis, as Raman spectroscopy shows no morphological information but may provide detailed information of molecular composition changes. Therefore, it is necessary to accumulate sufficient amount of basic data and research results to prove reliable diagnosis with Raman spectroscopy in the absence of morphological information. To the best of my knowledge, no technique allows the direct observation of the advancement in cancer. M. V. Schulmerich et al. reported in vivo measurement of murine bones under anesthesia using Raman spectroscopy24. The present study was encouraged based on the results of previous studies for monitoring the tumor (colorectal tumor) in a single living mouse model to provide sufficient reliable data.
The use of a mouse model offers several advantages. It is possible to monitor the advancement of tumor from early stages and during the chemotherapy treatment process using a mouse model. Moreover, the individual discordance is eliminated, as the mice are isogenic. The azoxymethane–dextran sodium sulfate (AOM–DSS) colon cancer mouse model was used in the present study, as the tumor advances very rapidly in this model, and a month is enough for the sample preparation25. The tumor often advances into adenocarcinoma in this model26, which was used herein to monitor the advancement of tumors, using Raman spectroscopy. The problem in using a mouse model was its small size. The normal endoscope with the Raman probe used for human studies was too large for the mouse model. Hattori et al. and Komachi et al. developed a miniaturized Raman endoscopic (mRE) system for mouse studies27-29. The diameter of the endoscope head was 2.5 mm and included a channel with a 1.2-mm diameter. A ball lens-installed hollow optical fiber Raman probe (BHRP) with a 0.64-mm diameter was attached on to the probe head30–32. This system was small enough to measure the mouse colon tumor under
- 6 -
anesthesia treatment, while BHRP allowed noninvasive measurement of tissues. The first study involved the use of established techniques for in situ noninvasive observation of the same tumor to monitor the advancement of cancer in a live mouse model using an mRE system with BHRP and development of procedures for the efficient analysis of the Raman spectra with chemometrics. In the next step, the efficiency of this instrument was evaluated. In the second study, the effects of anticancer drugs were studied using an mRE system in the mouse model. Anticancer drug treatment is one of the standard treatments for colorectal cancer. Monitoring the effect of anticancer drugs by Raman spectroscopy has been conducted in cultured cells33. Skolekova et al. reported the effects of anticancer agents on cancer cells34. Ock et al. reported real-time monitoring of anticancer drug effects on cancer cells using surface-enhanced Raman spectroscopy35. These studies strongly suggest that Raman spectroscopy may be useful for monitoring the effects of anticancer drugs at the cellular level. The molecular biological study of cultured cancer cells may provide information on the anticancer effects of drugs. However, this information may be insufficient to understand cancer tissue, owing to the complexity of cancer tissues as compared with cells36.The mRE system and mouse model allowed direct monitoring of tumors.
Under clinical settings, cancer diagnosis is based on imaging techniques such as histopathology and endoscopic diagnosis. The Raman image system comprises a microscope Raman spectrometer and confocal imaging system on a computed micro-stage. The sample for observation may be inserted into the sampling stage of the microscope. It is necessary to process the sample and it may be difficult to evaluate live tissues. Autofluorescence imaging has been used to study colorectal cancer. Aubin et al. suggested that nicotinamide adenine dinucleotide (NADH) and flavin exhibit
- 7 -
autofluorescence in viable cells37. Barenbiom et al. reported that elastin and collagen present extensively in the extracellular matrix and emit autofluorescence38. The measurement of NADH in viable cells and extracellular matrix may provide structural information of the tumor tissue, as tumor tissue contains complex structures such as cancer stem cells and extracellular matrix. The site dependency of viable cells and extracellular matrix was studied in live tumors by comparing the autofluorescence image with Raman spectra to study the complex structure of tumor tissues in third chapter.
- 8 -
References
1. Cancer statistics in Japan, FPCR National Cancer Center, 2015
2. P. Hewitson, P. Glasziou, E. Watson, B. Towler and L. Irwig, Am. J. Gastroenterol., 2008, 10, 1572
3. K. W. Kinzler and B. Vogelstein, Cell, 1996, 87, 159-170
4. J.C. Rijn, J. B. Reitsma, J. Stoker, P. M. Bossuyt, S. J. Deventer and E. Dekker, Am.
J. Gastroenterol., 2006, 10, 343-350
5. S. Kudo, H. Kashida, T. Tamura, E. Kogure, Y. Imai, H. Yamano and A. R. Hart,
World J. Surg., 2000, 24, 1081-1090
6. N. Uedo, H. Iishi, M. Tatsuta, T. Yamada, H. Ogiyama, K. Imanaka, N. Sugimoto, K. Higashino, R. Ishihara, H. Narahara and S. Ishiguro, Gastrointest. Endosc., 2005, 62, 521-528
7. H. M. Chiu, C. Y. Chang, C. C. Chen, Y. C. Lee, M. S. Wu, J. T. Lin,C. T. Shun and H. P. Wang, Gut., 2007, 56, 373–379
8. O. A. Ogunbiyi, F. L. Flanagan, F. Dehdashti, B. A. Siegel, D. D. Trask, E. H. Birnbaum, J. W. Fleshman, T. E. Read, G. W. Philpott and I. J. Kodner, Ann. Surg.
Oncol., 1997, 4, 613-620
9. T. Ichikawa, S. M. Erturk, U. Motosugi, H. Sou, H. Iino, T. Araki and H. Fujii, AJR, 2006, 187, 181-184
10. D. Dominique, J. Nucl. Med., 1999, 40, 591-603
11. C. V. Raman, K. S. Krishnan, Nature, 1928, 121 , 501-502 12. C. V. Raman, K. S. Krishnan, Nature, 1928, 121, 711-711
13. E. B. Hanlon, R. Manoharan, T. W. Koo, K. E. Shafer, J. T. Motz, M. Fitzmaurice, J. R. Kramer, I. Itzkan, R. R. Dasari and M. S. Feld, Phys. Med. Biol. 2000, 45, R1-R59
- 9 -
14. A. Mizuno, Y. Ozaki, K. Itoh, S. Matsushima and K. Iriyama, Biochem. Biophys. Res.
Commun. 1984, 119, 989-994
15. Y. Ozaki, A. mizuno, H. Sato, K. Kawauchi, Appl. Spectrosc. 1992, 46, 533-536 16. B. Venkatesh, S. Ramasamy, M. Mylrajan, R. Asokan, P. T. Manoharan and J. M.
Rifkind, Spectrochim. Acta. A., 1999, 55, 1691-1697
17. C. J. Frank and R. L. McCreery, Anal. Chem., 1995, 67, 777
18. J. F. Brennan III, Y. Wang, R. R. Dasari amd S. Feld, Appl. Spectrosc. 1997, 51, 201 19. Z. Movasaghi, S. Rehman and I. ur Rehman, App. Spectrosc. Rev., 2008, 43, 134–
179
20. I. Notingher, C. Green, C. Dyer, E. Perkins, N. Hopkins, C. Lindsay and L. L. Hench,
J. R. Soc. Interface, 2004, 1, 79–90
21. M. S. Bergholt, W. Zheng, K. Lin, K. Y. Ho, M. Teh, K. G. Yeoh, J. B. Y. So and Z. Huang, Analyst, 2010, 135, 3162–3168
22. M. S. Bergholt, W. Zheng, K. Lin, K. Y. Ho, M. Teh, K. G. Yeoh, J. B. Y. So and Z. Huang, J. Biomed. Opt., 2011, 16, 037003
23. A. S. Haka, Z. Volynskaya, J. A. Gardecki, J. Nazemi, R. Shenk, N. Wang, R. R. Dasari, M. Fitzmaurice and M. S. Feld, J. Biomed. Opt., 2009, 14, 054023
24. M. V. Schulmericha, J. H. Colea, J. M. Kreiderb, F. E. Whitea, K. A. Dooleya, S. A. Goldsteinb and M. D. Morrisa, Appl. Spectrosc., 2009, 63, 286–295
25. D. W. Rosenberg, C. Giardina and T. Tanaka, Carcinogenesis, 2009, 30, 183–196 26. C. Becker, M. C. Fantini, S. Wirtz, A. Nikolaev, R. Kiesslich, H. A. Lehr, P. R. Galle
and M. F. Neurath, Gut, 2005, 54, 950–954
27. Y. Hattori, Y. komachi, T. Asakura, T. Shimosegawa, G. Kanai, H. Tashiro and H. Sato, App. Spec., 2007, 6, 579-584
- 10 -
28. Y. Komachi, T. Katagiri, H. Sato and H. Tashiro, Appl. Opt., 2009, 48, 1683-1696 29. Y. Komachi, H. Sato, K. Aizawa and H. Tashiro, Appl. Opt., 2005, 44, 4722-4732 30. T. Katagiri, Y. S. Yamamoto, Y. Ozaki, Y. Matsuura and H. Sato, Appl. Spectrosc.,
2009, 63, 103-107
31. Y. S. Yamamoto, Y. Oshima, H. Shinzawa, T. Katagiri, Y. Matsuura, Y. Ozaki and H. Sato, Anal. Chim., 2008, 619, 8-13
32. B. B. Andriana, Y. Oshima, S. Takanezawa, T. W. Tay, C. L. R. Soeratman, M. S. Alam, H. Mitsuoka, X. B. Zhu, T. Suzuki, Y. S. Yamamoto, N. Tsunekawa, Y. Kanai, M. Kurohmaru and H. Sato, BiOS-SPIE, San Jose, California, USA, 2009, 7167-33. 33. R. J. Swain and M. M. Stevens, Biochem. Soc. Trans., 2007, 35, 549
34. S. Skolekova, M. Matuskova, M. Bohac, L. Toro, L. Demkova and J. Gursky, Cell
Commun. Signaling, 2016, 14, 4
35. K. Ock, W. I. Jeon, E. O. Ganbold, M. Kim, J. Park, J. H. Seo, K. Cho, S. W. Joo and S. Y. Lee, Anal. Chem., 2012, 84, 2172-2178
36. D. Hanahan and R. A. Weinberg, Cell, 2000, 100, 57-70 37. J. E. Aubin, J. Histochem. Cytochem., 1979, 27, 36-43
38. G. M. Barenboim, A. N. Domanskii, K. K. Turoverov, New York, 1969, 6
39. A. Taketani, R. Hariyani, M. Ishigaki, B. B. Andriana and H. Sato, Analyst, 2013,
138, 4183-4190
40. A. Taketani, B. B. Andriana, H. Matsuyoshi and H. Sato, Analyst, 2017, 142, 3680– 3688
- 11 -
Chapter Ⅰ : Raman Endoscopy for the in situ investigation of
advancing colorectal tumors in live model mice
Ⅰ - 1. Abstract……….12
Ⅰ – 2. Introduction……….……….13
Ⅰ – 3. Material and Methods...………15
1. Preparation of AOM–DSS colorectal cancer model mice
2. Raman measurements
3. Procedure for endoscopic observation
4. Histopathological study
5. Data analysis
Ⅰ – 4. Results……….……..18
1. Raman measurements of colorectal tumors in model mice 2. Analysis of Raman spectra from colorectal tumors in model mice
Ⅰ - 5. Discussion………..26
Ⅰ – 6. Conclusion………28
Ⅰ – 7. Acknowledgements………...29
- 12 -
Ⅰ - 1.
AbstractThe aim of the present study is to evaluate the capability of a miniaturized Raman endoscope (mRE) system to monitor the advancement of colorectal tumors in model mice as a method that is noninvasive to the tumor itself. Nevertheless, the endoscope is narrow enough to observe the inside of the mouse colon in such a way that is semi-noninvasive to the animal. However, the mRE system allowed the visualization and Raman spectral measurement of any targeted point within the colorectal tumor in model mice under anesthesia, without damaging the tissue (i.e., noninvasively). Continuous monitoring of the same tumor allowed the observation of alterations in its molecular composition and size, along with its advancement. The tumor lesion was discriminated from normal tissues of the control mouse with an accuracy of 86.8%. I succeeded in visualizing and performing Raman spectral observations on a shrinking polyp type tumor. The Raman analysis suggested that it was not cured but supposedly transformed to another tumor type.
- 13 -
Ⅰ - 2.
IntroductionColorectal cancer is the third most cancer death in men and first most cancer death in women in Japan1. Colorectal cancer is generated by mutations in tumor-suppressor genes and oncogenes activated in the colon epithelium. After further mutations in tumor-suppressor genes such as p53, matrix metalloproteinase is expressed in the tumor cells, leading to the destruction of the basal lamina consisting of collagen IV, and then the tumor acquires the ability to metastasize2,3. Early stage tumors in the colorectal epithelium are generally benign and usually in the form of an adenoma. However, these tumors can metastasize, and therefore, be classified as adenocarcinoma. Determining whether a tumor is malignant or benign is difficult based on its visual appearance4,5.
Raman spectroscopy had been applied to explore the implications of early detection of neoplastic lesions in the human stomach during clinical gastroscopy, and excitation laser was introduced a 1.8 mm Raman endoscopic probe for the in situ measurement6. Bergholt et al., reported that cancerous tissues could be identified inside the stomach and esophagus with an accuracy of 89.3% and 94.7%, respectively6,7. Meanwhile, Raman endoscopy can be suggested for human breast cancer diagnosis (ex
vivo study)8. Their results showed a sensitivity of 83% and a specificity of 93% for the
evaluation of freshly excised surgical specimens8. In the case of colorectal cancer diagnosis, Zheng et al. reported about the Raman analysis of single live epithelial cells, in which the method showed about 86.3% sensitivity and 86.3% specificity9.
The purpose of the present study is to demonstrate that the molecular changes of a tumor lesion can be studied over a long period in a live mouse by using the miniaturized Raman endoscope (mRE) system. The use of a mouse model makes it possible to monitor the advancement of the tumor from the very early stage through the treatment process
- 14 -
during chemotherapy. Moreover, it can eliminate individual discordance. In generating the tumor model, the same tumor type is usually produced because the mouse is isogenic; moreover, the initiator and the promoter of carcinogenesis are identical to all the mice. It is impossible to do a similar observation in human subjects. Nevertheless, the problem in using a mouse model is its size. The normal endoscope with a Raman probe used for human studies is too large for the mouse model. Hence, we developed the present mRE system for mouse studies10-12. The diameter of the endoscope head is 2.5 mm, including a channel with 1.2 mm diameter. A ball lens-installed hollow optical fiber Raman probe (BHRP) with 0.64 mm diameter is inserted into the channel13–15. Raman spectroscopy allows us to obtain information about molecular concentrations and the structural composition of tumor tissues in situ in a totally noninvasive manner. The long-term aim of this study is to develop a technique for analyzing the characteristic molecular compositions of adenomas and adenocarcinomas, and for monitoring the effect of anticancer drugs in situ. To reach this aim, the present study focuses on collecting preliminary knowledge and examining the performance of the system. We have developed a method for monitoring the molecular changes in an axillary tumor in a living rat by injecting BHRP into the tumor via an injection needle15. The early detection of the cancer is not the major purpose at this time.
The azoxymethane–dextran sodium sulfate (AOM–DSS) colon cancer model mice were used in the present study because the tumor advances very rapidly in this model and only 1 month is needed for sample preparation16. AOM-DSS model has been found to be more potent and stable in solution than 1,2-dimethylhydrazine models17. Moreover, the tumor often advances into adenocarcinoma in this model18. However, no concrete knowledge is available about the advancement of these tumors. Therefore, monitoring the
- 15 -
same tumor (colorectal tumor) in a single mouse is necessary for a reliable analysis. In the present study, performing Raman measurement under the guide of visual observation in individual live mice and analyzing the molecular alterations dependent on the advancement of the tumor were successfully carried out.
Ⅰ - 3. Material and Methods
1. Preparation of AOM–DSS colorectal cancer model mice
BALB/cCrSlc mice were purchased from SLC (Shizuoka, Japan). The azoxymethane (AOM) and dextran sodium sulfate (DSS) were purchased from Sigma-Aldrich Chemical Co. (St. Louis, MO, USA). The saline (Otsuka Pharmaceutical Co., Ltd., Tokushima, Japan) solution of AOM was administrated by intraperitoneal injection (7.4 mg kg-1) once to each 8 week old mouse17. The mice were then given DSS in drinking water (30 mg ml-1). DSS administration had a duration of 1 week and was repeated twice with a 2 week interval16. A tumor was observed in all mice (16 heads) at 15 weeks after AOM administration. Four of 16 heads mice, which have developed tumor lesions, possessed good recognizable tumor performance for Raman measurement and were used for further studies. Several control mice were kept under the same conditions as the model mice. Measurements of 3 model mice (A–C) and 1 control mouse (N) were carried out at 15, 17, and 19 weeks of age, and the remaining model mouse (D) was assessed at 16 and 18 weeks. Carcinogenesis of these colorectal tumors was confirmed by histopathological study in Biopathology Institute Co., Ltd(Oita, Japan).
- 16 - 2. Raman measurements
The Raman system was equipped with a miniaturized endoscope and a ball lens-installed hollow optical fiber Raman probe (BHRP)13-15. The endoscope was made by Machida Endoscope Co. Ltd. (Japan). The homemade BHRP consisted of a sapphire ball lens of 500 mm diameter (Edmund Optics, USA) and a hollow optical fiber of 420 mm outer diameter (Doko Engineering LLC, Japan)9-12. Combining miniturized endoscope and BHRP made mRE system. A diode laser emitting at 785 nm (Toptica Photonics, Germany) was used for excitation during the Raman measurements. A single polychromatic Raman spectrometer (F4.2, focal length 320 mm, 750 nm blazed 600 l mm-1 grating; Photon Design Co. Ltd., Japan) and a charge coupled device detector (DU420-BRDD; Andor Technology Co. Ltd., Northern Ireland) were used to record the Raman spectra. The BHRP was coupled to the spectrometer through a long-pass filter (LF; Semrock, USA), a notch filter (NF; Kaiser Optical System, USA), and 2 lenses to focus the laser and Raman scattered light into the hollow optical fiber and the slit (100 mm width). Fig. 1-1 describes this mini-endoscope and Raman system. Spectra for a 60 second exposure of the sample to a 60 mW excitation light were acquired.
Fig.1-1 The structure of the miniaturized Raman endoscopic system with schematic drawing of the experimental setup.
- 17 - 3. Procedure for endoscopic observation
Mice were anesthetized with an inhalation anesthesia apparatus (SurgiVet, USA) and kept on a warming plate to maintain the body temperature at about 37 ℃. The mice were then positioned on a specialized circuit board that can control heating19. The concentration of isoflurane (Mylan, Tokyo, Japan) was 1.0–2.5%. Isoflurane has a lower concentration than that is recommended by Piramal Healthcare Ltd., London, UK with the volume-to-volume (v/v) of 3–5%19. The endoscope was inserted from the anus, and then the lumen was pressurized with air via the channel to keep the field of view. Feces that remained in the colon were removed by washing off the colon with saline. The BHRP was inserted into the endoscope's channel to measure the Raman spectra (Fig. 1-1). The distance of the tumor from the anus was recorded through repeated measurements. The method worked well, and no other markers were necessary for recognizing the same tumor in each mouse during this experiment. This study was approved by the ethics committee of Kwansei Gakuin University.
4. Histology study
Particularly in histology studies, whole specimens are immediately fixed with 4% paraformaldehyde at 4 ℃, dehydrated through a graded series of ethanol (70%, 80%, 90%, 95%, and 100%), continued immersing in histo-clear, and embedded in paraffin20. The sections were 5 µm thick and stained with hematoxylin–eosin (H/E). The degree of morphological alteration in the tissue sections was graded by experienced pathologists who were blind to spectroscopic data.
- 18 - 5. Data analysis
First, a background spectrum due to the Raman probe was subtracted from the recorded spectra, and the measured spectra were later background-corrected. The 5th polynomial line fit to the spectrum was subtracted from the spectra. Spectral areas having a negative value were extracted. The extracted areas were subjected to a 5th polynomial fitting and another subtraction. The same procedure was repeated 5 times to obtain the background-corrected spectra. Then, the spectral intensities were standardized with a phenylalanine band at 1003 cm-1, which was adequately sharp to determine its accurate intensity. These collection procedures are necessary for the further analysis8. A chemometrics software program (Unscrambler; CAMO, USA) was used for principal component analysis (PCA), partial least square regression (PLSR) analysis, and linear discriminant analysis (LDA)21,22. PCA is able to obtain the maximum variance from complex data as the principal component (PC) and find the correlation of these data. PLSR, similar method to PCA, find the linear differences from complex data as the factor. LDA is a classification method of searching for a linear combination of the variables that best separates two classes. The minimum level of smoothing (11 points) was carried out with the Savitzky–Golay method to show the bands clearer to the spectra shown in Fig. 1-2. However, the spectra without smoothing were used for the further spectral analysis to minimize the artificial effect.
Ⅰ - 4. Results
1. Raman measurements of colorectal tumors in model mice
- 19 -
to the difficulty of deeply inserting the endoscope without scratching the vulnerable tumor
Fig.1-2 Raman spectra of tumors (averaged) measured in 3 tumor models, at 15 (a and d), 17 (b and e), and 19 (c and f) weeks of age (tumor model: 15 weeks, n = 19; 17 weeks, n = 24; 19 weeks, n = 19; control: 15 weeks, n = 7; 17 weeks, n = 9; 19 weeks, n = 7)
Fig.1-3 (A) photograph of a typical colon tumor measured with the endoscope in a 15 week old live model mouse, the tumor is marked with a broken line (---), the distance of the tumor from the anus is ±14 mm, the head of the BHRP (*) and the lumen of colon (**) are seen in the picture; (B) photomicrograph of a hematoxylin–eosin-stained colorectal adenocarcinoma in Fig. 1-3 A(---), the tissue was collected from a killed mouse (19 weeks old) and necrotic tumor cells (a), cancer cells (b), and normal cells (c) can be seen.
- 20 -
lesion. I selected 4 of 16 mice that have the best tumor configuration (i.e., the tumor has an easy-to-access location and is easily recognizable for continued endoscopic observation) for further observation. The head part of the endoscope could be bent up and down with a lever at its handle. The handle is rotated to turn the sight into either the right or the left direction. To point the probe toward a closer or farther tissue, the probe rod is pulled or pushed. With these simple manipulations, it is possible to reach any point within the colon through the visual guide of a TV monitor. A typical endoscope picture of a colon tumor in the mouse model is shown in Fig. 1-3A. The distal end of the BHRP can be seen at the right side of the sight. Generally, several (3–7) polyp-shaped tumors were observed in each mouse. A photomicrograph of an H/E-stained adenocarcinoma tissue is shown in Fig. 1-3B, which indicates that the tumor in the AOM/DDS mouse model has advanced into the malignant state. The tissue sample was obtained from a large polyp-like dysplasia. On the basis of our histopathologic examinations, an estimated 5–10% of tumors in the 20 week old mice are adenocarcinoma and the other tumors are adenoma.
2. Analysis of Raman spectra from colorectal tumors in model mice
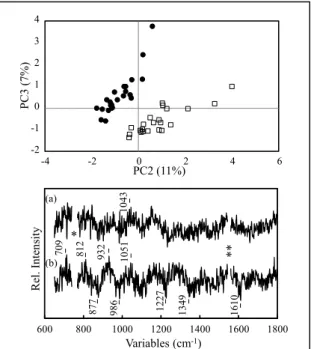
The Raman spectra of live tumor model and control mice are shown in Fig. 1-2. I selected several polyp-like tumors in the 3 model mice and the measurements were repeatedly carried out at 15, 17, and 19 weeks of age (7th, 9th and 11th weeks after the administration of AOM). Several spectra were collected from different polyps in each model mouse and they were collected from different positions in the colon wall for the control mouse. The total numbers of the measured spectra were 19, 24 and 19 for 15 (a), 17 (b) and 19 (c) weeks of tumor models and 7, 9 and 7 for 15 (d), 17 (e) and 19 (f) weeks of control. The Raman spectra were analyzed with PLSR analysis The PLSR score plot
- 21 -
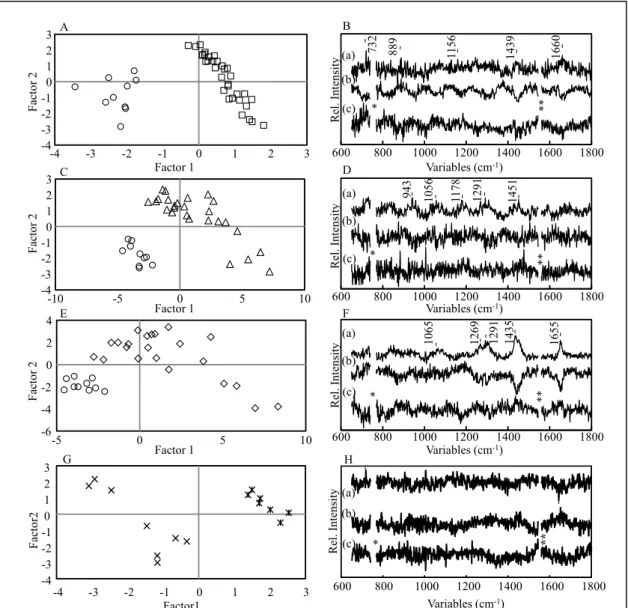
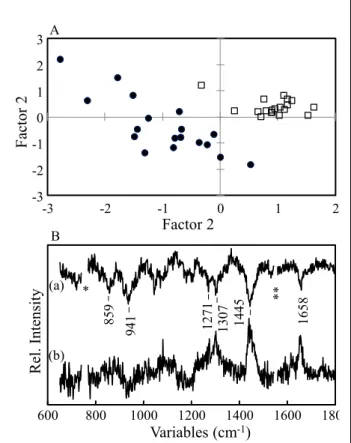
and loading plot for factors 1 and 2 calculated for 3 tumor mice are shown in Fig. 1-4A and C. The dataset is classified into 3 groups according to the number of weeks. The bands at 1662, 1451, and 1342 cm-1 are assigned to amide I, C-H bending, and amide III vibrational modes of protein in factor 1, and the bands at 1736, 1655, and 1441 cm-1 were assigned to C=O stretching, C=C stretching and C–H bending modes of triacylglycerol in factor 2, respectively. This tendency is observed more clearly in the PLSR score plot calculated for a single mouse. The score and loading plots of the spectra obtained from one mouse alone are shown in Fig. 1-4B and D. These score plots indicate that molecular alterations occurred as the tumor advanced. The results suggest that the tumor developed in one direction and all tumors showed a relatively uniform
Fig.1-4 Score and loading plots for factors 1 and 2 of PLSR models obtained for the spectra measured in 3 tumor mouse models (A and C) and in a single tumor mouse model (B and D). Marks of ●, □ and ▲ represent the spectral data measuread at 15, 17, 19 weeks of age, respectively. The Raman spectra weremeasured at several tumor lesions in the mouse; for the 3 tumor mouse models, the total number of spectra are 19, 24 and 19 for 15, 17 and 19 weeks, for the single tumor mouse model, the total number of spectra are 8, 7 and 7 for 15, 17 and 19 weeks.
- 22 -
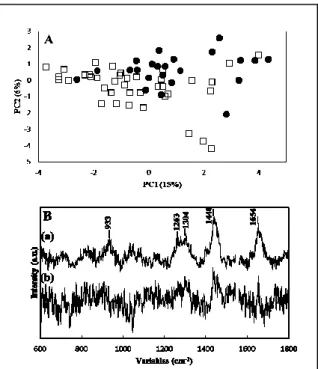
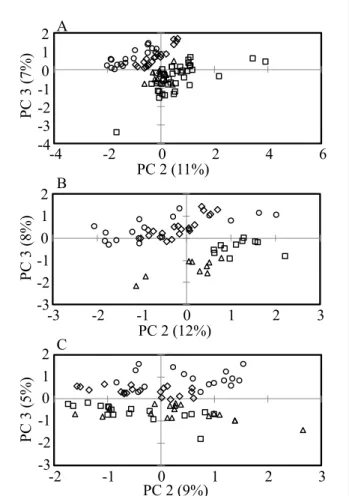
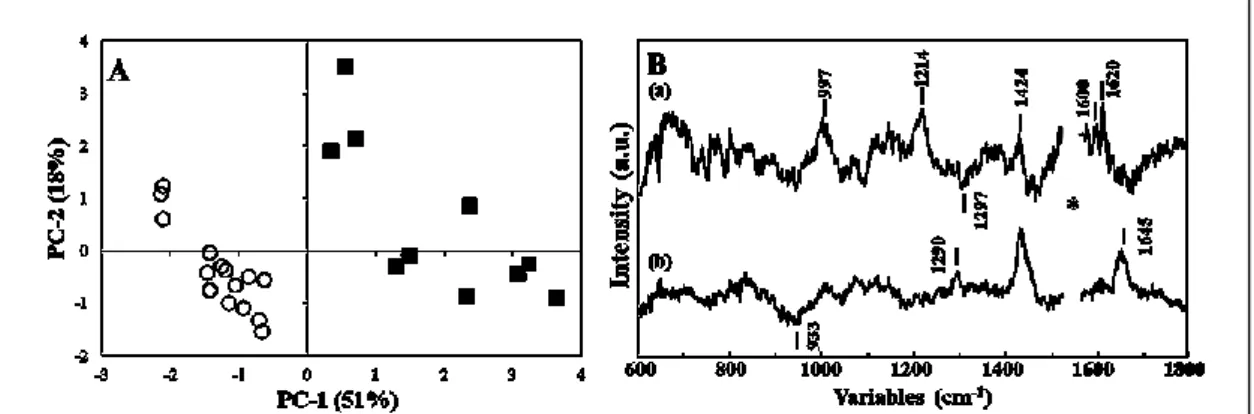
phase of development in the AOM/DSS mouse model. The validation result of the spectra of the control mouse applied to the PLSR model obtained for the 3 tumor mice is depicted in Fig. 1-5. When the control data applied to the PLSR model obtained for the tumor advancing, the prediction result has no relationship with the weeks of mouse. If the PLSR model reflected the usual aging effect of the colorectal tissue, the data would be classified depending on the weeks. It is not the case. The result strongly suggests that the PLSR model of the tumor mice successfully extracted specific information to the tumor progression. Fig. 1-6 shows a PCA score plot (A) and loading plots (B; principal components (PCs) 1 (a) and 2 (b) ) calculated for the spectra of the tumor lesion in 2 model mice (B and C; n = 41) and for the control mouse (N; n = 23). The spectra of these 3 mice, including data obtained at different ages (15–19 weeks), were analyzed together.
Fig.1-6 Score plot (A) for PC1 and 2 of a PCA model built for the Raman spectra obtained from control (● ; n = 22) and tumor (□ ; n = 41) mice, and loading plots (B) of PC1 (a) and 2 (b)
Fig. 1-5 Prediction result of the dataset of the control mouse (15 weeks n = 7, 17 weeks n=9, 19 weeks n = 7) applied to the PLSR model. Bars (-) represent prediction values and vertical bars do represent deviations of the prediction values.
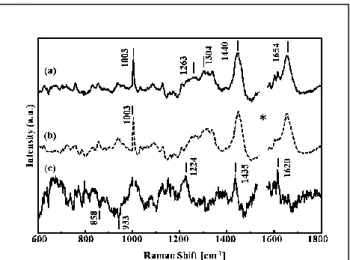
- 23 - Strong five bands appeared at 1654,
1440, 1304, 1263, and 933 cm-1 in the loading plot of PC1 in Fig. 1-6B (a), which seemed to be assignable to lipids. I have inspected score plots for PC1 to PC7; however, no clear classification, including the week dependency, was observed. It seems
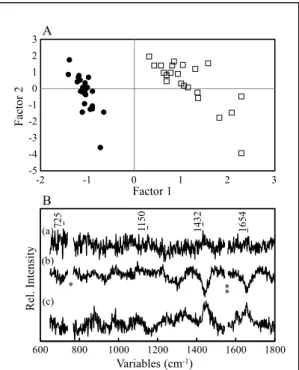
that PLSR can extract information more efficiently depending on the dependent variables. Judging from the features of the loadings, PC1 and 2 are mostly arising from the protein in the negative direction and fat (triacylglycerol) in the positive direction. This judging due to the bands at 1662, 1451, and 1342 cm-1 is assigned to amide I, C-H bending23, and amide III vibrational modes of protein24 in PC1. Meanwhile, the bands at 1736, 1655, and 1441 cm-1 were assigned to C=O stretching25, C=C stretching26, and C–H bending modes of triacylglycerol27 in PC2. The PCA score plot (A) and loading plots (B; PC1 and 2) in Fig. 1-6 were calculated for the spectra of model and control mice. Although the control and tumor spectra were not discriminated in the score plot, the spectra of the control mouse showed a tendency to have a larger PC1 contribution. Five bands strongly appeared at 1654, 1440, 1304, 1263, and 933 cm-1 in the loading plot of PC1, which seemed to be assignable to lipids. The result suggests that the normal colon tissue has a higher lipid concentration than the tumor. The data of the normal mouse and those of the tumor model mice were then analyzed with LDA. The LDA score plot is depicted in Fig. 1-7. The LDA model was constructed for the spectra of control (N; n = 23) and tumor mice (B and C; n = 41). The spectra of different tumor model mice (A and D; n = 38)
Fig.1-7 LDA score plot of the control dataset (○), tumor dataset (×), and validation dataset (△).
- 24 -
were used to validate the model. LDA was applied to the sample data with these 5 bands. The result showed that 86.8% (n = 33) of tumor samples were classified correctly and 13.2% (n = 5) incorrectly. Since all of the control data were used to obtain a reliable model, there is no control spectra left for validation. The validation is made with the spectra of different tumor model mice which were not used to build the model. Therefore, the present LDA model is relatively robust. Fig. 1-8A depicts a series of pictures of a shrinking tumor in the same mouse. These are endoscopic pictures observed at the same position in a model mouse at 15, 17, and 19 weeks of age. A small tumor is visible in the first picture (Fig. 8A(a)), slightly larger tumor appeared in the second picture (Fig. 1-8A(b)), and then in the third picture (Fig. 1-8A(c)) these tumors disappeared. The observed point was at 14 mm from the anus. Although a few tumors showed a reduction in size (shrinking tumors) during the observation, I have succeeded in simultaneously recording both pictures and spectral data in only one case because this was not a predictable phenomenon. In this case, the tumor seemed to have disappeared; however, the other tumors were only reduced in size. The shrinking tumors were generally small; however, no characteristic feature was recognized from the visual observation. The Raman spectra of this lesion are shown in Fig. 1-8B. The spectra of the shrinking tumor measured at 15 (Fig. 1-8B(a)), 17 (Fig. 1-8B(b)), and 19 (Fig. 1-8B(c)) weeks are depicted. The spectra in Fig. 1-8B(d) and (e) are the subtraction results of the 17 week spectrum minus the 15 week spectrum and the 19 week spectrum minus the 15 week spectrum, respectively. The spectra of the shrinking tumor measured at 15 (Fig. 1-8B(a)), 17 (Fig. 1-8B(b)), and 19 (Fig. 1-8B(c)) weeks showed similar features to those of the growing tumors shown in Fig. 1-3. The subtraction spectrum in Fig. 1-8B(d) shows a negative band at 933 cm-1, which may be arising from collagen type I28 and may indicate the
less-- 25 less--
activity of tissue repair. Since the spectra were too noisy to collect information with visual comparison, the previous LDA model was applied for
Fig.1-8 The pictures of shrinking tumor (A; 14 mm from anus) taken at mouse ages of 15 (a), 17(b) and 19(c) weeks; the Raman spectra of tumors (B; averaged) measured at mouse ages of 15 (a), 17 (b), and 19 (c) weeks, and the subtractions spectra of 17 weeks minus 15 weeks (d) and 19weeks minus 15
weeks (e). The spectra in the 1545-1559 cm-1 range were hidden to remove a strong noise due to the
oxygen in the hollow fiber. The tumor is shown with dotted line (---). The head of the BHRP was marked by ''*''. The lesion with a ''**'' mark indicates the lumen of the colon.
- 26 -
diagnosis. Fig. 1-9 is the LDA score plot of the 15 weeks dataset (×), 17 weeks dataset (*), and 19 weeks dataset (●) used by LDA model in Fig.1-7. The spectra of the shrinking tumor were classified as “tumor” in Fig.1-9. It suggested that the shrunken tumor was disappeared by observation but Raman spectroscopy found the tumor. However, the shrunken tumor were not checked up and diagnosed by histopathologists due to unable to recognize the exact position of the shrunken tumor after sacrificed.
Ⅰ - 5. Discussion
Observation and measurement of Raman spectra in individual mice were carried out repetitively during a 2 weeks interval to prevent the adverse effects of anesthesia. After the observation at 19 weeks, the mice were sacrificed for histopathological studies. Cautious observation of the extracted colon as well as endoscopic observation indicated that the Raman measurements with 60 mW laser irradiation did not cause any damage to the tissue. Not only the low level of laser irradiation, but the exposure time of laser was short enough, which did not cause the accumulation of energy to be hot and consequently give effect to the tissue. The laser irradiation level and exposure time will have a relationship with the damage of tissue23. Furthermore, pathologic analysis of the biological effects of laser–tissue interaction needs a relationship of the irradiation parameters with the biologic status and response of the target tissue over time29.
Fig.1-9 LDA score plot of the 15 weeks dataset (×), 17 weeks dataset (*), and 19 weeks dataset (●) of shrinking tumor.
- 27 -
Visual observation indicated that the tumors mostly grew in size during the 4 weeks but no other obvious changes were observed. Bands at 1654, 1440, 1263, and 1003 cm-1 were assigned to the amide I, C–H bending, and amide III vibrational modes of protein, and a breathing mode of the phenyl ring of phenylalanine30, respectively. It seemed that a band at 933 cm-1 can be assigned to proline in collagen type I31,32. As the bands at 1654, 1440, and 1304 cm-1 seemed to have trace contributions of a lipid24,33. The working distance and the size of the focal volume were 60 and 58 µm the depth direction, respectively9.The tumor part is usually much thicker due to the dysplasia as shown in Fig. 1-1C. The lipid seems to be included in the tumor tissue itself.
The present study demonstrates that an in vivo study with a miniaturized Raman probe and a miniaturized endoscope is a powerful method for obtaining molecular and morphological information of tissues in real time without damaging the tissue. Although no bleeding occurred during the operation, the anesthesia procedure is still necessary for studies with this colorectal tumor mouse model. From this viewpoint, although introducing the endoscope may be a semi-noninvasive method, the procedure might still cause pain to the animals. The possibility of monitoring unique alterations in the molecular composition of the colorectal tumor will allow us to study the therapeutic effects of not only anticancer drugs but also various medical treatments, using individual model mice. The technique may also contribute to reducing the number of mice to be killed in studies. The tumor grade was not discussed in this study because I focused on the noninvasive observation of the tumors. It was possible to conduct a biopsy for a part of the tissue with forceps; however, it might cause severe inflammation, infection, and irregular tissue formation during repair. The present results reveal that the molecular composition of a tumor changes as the tumor advances.
- 28 -
This kind of study would be very difficult to use other tumor animal models such as the dog or sheep model because it would take a long time to create the model and to advance the tumor in these medium-sized animals. Although the mouse model is too small for the commercially available endoscopes, it has the advantage of ease in preparation and tumor control. The present system allows the use of a mouse model to study the molecular alterations and the morphology of live tumor tissues continuously.
Ⅰ - 6. Conclusion
The present study demonstrated that this Raman system equipped with a miniaturized endoscope and BHRP can simultaneously obtain spectral and visual information on the same tumor in a single mouse through continued measurements for several weeks. The results of Raman monitoring of tumors suggested some biochemical alterations in the molecular composition of the tumor, such as the change in the concentration of collagen type I and lipids in the lesion. The LDA model was constructed with 5 bands mainly assigned to lipids distinguishing the tumor and the control tissues. I have succeeded in observing and measuring the Raman spectra of a shrinking tumor. According to the LDA analysis, the shrinking tumor was not cured but rather transformed to another tumor type. The animal test using a mouse is irreplaceable for the basic research of tumor. The present technique can contribute to open a new era into the advanced mouse model research.
- 29 -
This study was financially supported by Konica Minolta Technology Center and A-step, JST (Japan Science and Technology Agency).
- 30 -
Ⅰ - 8. References
1. Cancer statistics in Japan, FPCR National Cancer Center, 2015
2. M. Hollstein, D. Sidransky, B. Vogelstein and CC. Harris, Science, 1991, 253, 49-53 3. M. G. Havenith, J. W. Arends, R. Simon, A. Volovics, T. Wiggers and F. T. Bosman,
Cancer, 1988, 62, 2207-2211
4. K. W. Kinzler and B. Vogelstein, Cell, 1996, 87, 159–170
5. T. Takayama, S. Katsuki, Y. Takahashi, M. Ohi, S. Nojiri, S. Sakamaki, J. Kato, K. Kogawa, H. Miyake and Y. Niitsu, N. Engl. J. Med., 1998, 18, 1277-1284
6. M. S. Bergholt, W. Zheng, K. Lin, K. Y. Ho, M. Teh, K. G. Yeoh, J. B. Y. So and Z. Huang, Analyst, 2010, 135, 3162–3168
7. M. S. Bergholt, W. Zheng, K. Lin, K. Y. Ho, M. Teh, K. G. Yeoh, J. B. Y. So and Z. Huang, J. Biomed. Opt., 2011, 16, 037003.
8. A. S. Haka, Z. Volynskaya, J. A. Gardecki, J. Nazemi, R. Shenk, N. Wang, R. R. Dasari, M. Fitzmaurice and M. S. Feld, J. Biomed. Opt., 2009, 14, 054023.
9. F. Zheng, Y. Qin and K. Chen, J. Biomed. Opt., 2007, 12, 034002.
10. Y. Hattori, Y. komachi, T. Asakura, T. Shimosegawa, G. Kanai, H. Tashiro and H. Sato, Appl. Spectrosc., 2007, 6, 579–584
11. Y. Komachi, T. Katagiri, H. Sato and H. Tashiro, Appl. Opt., 2009, 48, 1683–1696 12. Y. Komachi, H. Sato, K. Aizawa and H. Tashiro, Appl. Opt., 2005, 44, 4722–4732 13. T. Katagiri, Y. S. Yamamoto, Y. Ozaki, Y. Matsuura and H. Sato, Appl. Spectrosc.,
2009, 63, 103–107
14. Y. S. Yamamoto, Y. Oshima, H. Shinzawa, T. Katagiri, Y. Matsuura, Y. Ozaki and H. Sato, Anal. Chim. Acta, 2008, 619, 8–13
- 31 -
of going over the present Clinical PD and PDT, ed. N. Miyoshi and R. H. Pottier,
Sankeisha Co., Ltd., Japan, 2011, pp. 97–112
16. D. W. Rosenberg, C. Giardina and T. Tanaka, Carcinogenesis, 2009, 30, 183–196 17. A. I. Thaker, A. Shaker, M. S. Rao and M. A. Ciorba, JoVE, 2012, 11, 4100.
18. C. Becker, M. C. Fantini, S. Wirtz, A. Nikolaev, R. Kiesslich, H. A. Lehr, P. R. Galle and M. F. Neurath, Gut, 2005, 54, 950–954
19. C. Constantinides, R. Mean and B. J. Janssen, ILAR J., 2011, 52, e21–e31
20. B. B. Andriana, Y. Oshima, S. Takanezawa, T. W. Tay, C. L. R. Soeratman, M. S. Alam, H. Mitsuoka, X. B. Zhu, T. Suzuki, Y. S. Yamamoto, N. Tsunekawa, Y. Kanai, M. Kurohmaru and H. Sato, BiOS-SPIE, San Jose, California, USA, 2009, 7167-33. 21. Y. Oshima, H. Shinzawa, T. Takenaka, C. Furihata and H. Sato, J. Biomed. Opt., 2010,
15, 017009.
22. Y. Oshima, H. Sato, A. Zaghloul, G. N. Foulks, M. C. Yappert and D. Borchman,
Curr. Eye Res., 2009, 34, 824–835
23. R. J. Lakshimi, V. B. Kartha, C. M. Krishna, J. G. R. Solomon, G. Ullas and P. U. Devi, Radiat. Res., 2002, 157, 175–182
24. C. Kraft, L. Neudert, T. Simat and R. Salzer, Spectrochim. Acta, Part A, 2005, 61, 1529–1535
25. I. Notingher, C. Green, C. Dyer, E. Perkins, N. Hopkins, C. Lindsay and L. L. Hench,
J. R. Soc., Interface, 2004, 1, 79–90
26. R. Malini, K. Venkatakrishma, J. Kurien, K. M. Pai, L. Rao, V. B. Kartha and C. M. Krishna, Biopolymers, 2006, 81, 179–193
27. L. Silveira, S. Sathaiah, R. A. Zangaro, M. T. T. Pacheco, M. C. Chavantes and C. A. G. Pasqualucci, Lasers Surg. Med., 2002, 30, 290–297.
- 32 -
28. W. T. Cheng, M. T. Liu, H. N. Liu and S. Y. Lin, Microsc. Res. Tech., 2005, 68, 75– 79
29. S. Thomsen, Photochem. Photobiol., 1991, 53, 825–835
30. J. W. Chan, D. S. Taylor, T. Zwerdling, S. M. Lane, K. Ihara and T. Huser, Biophys.
J., 2006, 90, 648–656
31. I.Notingher, I.Bisson, A. E. Bishop,W.L.Randle, J.M. P. Polak and L. L. Hench, Anal.
Chem., 2004, 76, 3185–3193
32. H. U. Gremlich and B. Yan, Infrared and Raman spectroscopy of biological materials,
New York, 2001, pp. 421–476
33. N. Stone, C. Kendall, J. Smith, P. Crow and H. Barr, Faraday Discuss., 2004, 126, 141–157
- 33 -
Chapter ⅠⅠ : Raman Endoscopy for Monitoring Anticancer
Drug Treatment of Colorectal Tumors in Live
Mice
ⅠⅠ - 1. Abstract………...……….34
ⅠⅠ – 2. Introduction………...……….35
ⅠⅠ – 3. Material and Methods...………...………38
1. Preparation of the AOM-DSS colorectal cancer model mice 2. Anticancer drug treatment
3. Raman measurements
4. Procedure for endoscopic observation 5. Histopathological study
6. Data analysis
ⅠⅠ – 4. Results………....……….41
1. Observation of the same tissue before and after drug treatment2. Comparison of effects among 3 anticancer drug treatments
ⅠⅠ - 5. Discussion………...………52
ⅠⅠ – 6. Conclusion………...………..54
ⅠⅠ – 7. References………...………..55
- 34 -
ⅠⅠ - 1.
AbstractI have developed a murine model to study the effects of anticancer treatment on colorectal tumors. A miniaturized Raman endoscope (mRE) system was employed for the study. The endoscope is narrow enough to observe the inside of the mouse colon under anesthesia. It has a channel for a ball lens mounted on a hollow fiber Raman probe (BHRP) to measure any targeted point under the visual control of the endoscope. Colorectal cancer tissue was observed to study alterations of the tissue in response to anticancer drug treatment. Three anticancer drugs, 5-fluorouracil (5-FU), cisplatin (CDDP), and docetaxel were employed. Although no alteration was recognized in the endoscopic visual observations at 2 weeks after the drug treatments, the Raman spectra obtained in the live mouse colon indicated that changes of lipids and proteins were observed. This study demonstrates that in situ Raman analysis is powerful in detecting the effects of anticancer drugs.
- 35 -
ⅠⅠ - 2. Introduction
Colorectal cancer is the third most cancer death in men and first most cancer death in women in Japan1 and anticancer drugs are a mainstay in treating any cancer. There are many kinds of anticancer drugs but they can cause severe side effects. Therefore, it is necessary to select the most effective drugs for each case while limiting side effects. This is not straightforward because of the individual characteristics of each cancer. During chemotherapy, higher doses are preferable to destroy cancer cells but the dosage may need to be limited in order to minimize side effects2. In clinic, selection of cancer drugs is based on doctor’s experience and knowledge3. The selected drugs have to work greater efficiency and lower toxicity for patients4.
The purpose of the present study was to develop a technology to estimate the efficiency of anticancer drugs over short periods of time. For this purpose, I applied Raman spectroscopy via endoscope to evaluate the effects of different anticancer drugs in a noninvasive manner. It is difficult to do this with repeated biopsies because of their invasive character. For continuous measurement of responses, minimally invasive methodologies are required. Raman spectroscopy provides information about the molecular composition without damaging the tissue (i.e., noninvasively)5. I used the azoxymethane-dextran sodium sulfate (AOM-DSS) colon cancer mouse model because the tumor progresses very rapidly and only 1 month is needed for sample preparation. Such a model is easily manipulated, allowing a well-controlled environment for cancer research6.
Raman spectroscopy has been applied to explore the implications of early cancer detection in the human stomach during clinical gastroscopy, which led to the development of a 1.8 mm Raman endoscopic probe for in situ measurements. Cancerous tissues can be
- 36 -
identified inside the stomach and esophagus with an accuracy of 89.3% and 94.7%, respectively7. Meanwhile, Raman endoscopy has been suggested for human breast cancer diagnosis (in an ex vivo study)5. This study reported a sensitivity of 83% and a specificity of 93% for the evaluation of freshly excised surgical specimens. For colorectal cancer diagnosis, it has been reported that the Raman analysis of single live epithelial cell had a sensitivity of 86.3% and a specificity of 86.3%8.
This present study was to evaluate the effect of anticancer drugs in live colorectal cancer mouse models using a Raman endoscope system. We have developed a miniaturized Raman probe and an endoscope specifically for use in the mouse7,9,10. A ball lens-installed hollow optical fiber Raman probe (BHRP) consists of a sapphire ball lens and a hollow optical fiber11,12. The endoscope system allows the direct observation of the tumor in the colon. The colorectal cancer model is created through the administration of azoxymethane (AOM) and dextran sodium sulfate (DSS)6. Live tumor-bearing mice are then treated with one of three anticancer drugs, 5-fluorouracil (5-FU), cisplatin (CDDP), or docetaxel.
5-FU is an analog of uracil with a fluorine atom at the C-5 position instead of hydrogen. 5-FU is converted intracellularly to several active metabolites, including fluorodeoxyuridine monophosphate (FdUMP), fluorodeoxyuridine triphosphate (FdUTP), and fluorouridine triphosphate (FUTP); these active metabolites disrupt DNA and RNA synthesis and the action of thymidylate synthase (TS)13. CDDP interacts with DNA to form DNA adducts, primarily intra-strand crosslink adducts, which activate several signal transduction pathways, including those involving ATR, p53, p73, and MAPK, and culminates in the activation of apoptosis14.Docetaxel is a semisynthetic taxane. Docetaxel targets the β subunit of tubulin heterodimers, thereby stabilizing microtubules and
- 37 -
inducing cell-cycle arrest and apoptosis15. These drugs all disrupt cellular activity to interfere with the cell cycle and/or mitosis and induce cell death but their mechanisms are different.
Principal component analysis (PCA) was employed for the classification of the Raman spectra related to the anticancer drug treatment and control groups to detect tissue alterations in response to drug treatment. I hypothesized that Raman analysis would be able to discriminate the effects of these drugs based on the molecular compositional changes they induced.
Reactions of cancer cells to anticancer drugs have been studied in vitro using Raman imaging16. Cancer tissue consists of not only cancer cells but also extracellular matrix, and many other cells, e.g., macrophages and vascular endothelial cells. Among the various types of cells, cancer stem cells have tumorigenic capacity and their presence seems to closely correlate with tumor drug resistance17. Skolekova et al. reported that pretreatment of human mesenchymal cells with CDDP led to changes in the phosphorylation profiles of many kinases and also increased secretion of IL-6 and IL-8 cytokines, which increased the chemoresistance and stem cell characteristics of breast cancer cells18. In addition, high collagen content in a tumor's extracellular matrix and its organization into a thick fibrous network, particularly in poorly vascularized hypoxic regions, increase tissue stiffness, providing an additional physical barrier that further limits the penetration of anticancer drugs19. These reports suggest the importance of research on whole cancer tissue at the molecular level. The endoscope with Raman spectroscopy gives us a chance to study intact cancer tissue with repeated non-invasive observations during long term chemotherapy. The present study demonstrated the feasibility of Raman endoscope in the study of anticancer drugs in situ.
- 38 -
ⅠⅠ - 3. Material and Methods
1. Preparation of the AOM-DSS colorectal cancer model mice
BALB/cCrSlc mice were purchased from SLC (Shizuoka, Japan). The AOM and DSS were purchased from Sigma-Aldrich Chemical Co. (St. Louis, MO, USA). AOM was dissolved in normal saline solution (Otsuka Pharmaceutical Co., Ltd., Tokushima, Japan) and a 7.4 mg/kg dose was administered by intraperitoneal injection to each 8-week-old mouse6. The mice were then fed DSS in drinking water (30 mg/ml) for 1 week and this cycle was repeated twice at a 2-week interval. The study was approved by the ethics committee of Kwansei Gakuin University.
2. Anticancer drug treatment
5-FU (LKT Laboratories, Inc., Tokyo Chemical Industry, Tokyo, Japan), docetaxel (Tokyo Chemical Industry, Japan), and CDDP (Tokyo Chemical Industry, Tokyo, Japan) were the anticancer-drugs used. 5-FU and CDDP were diluted with saline in accordance with previous reports20,21. They were administered to the mice at doses of 25 mg/kg and 1.3 mg/kg for 5-FU and CDDP, respectively. The stock solution of docetaxel (50 mg/ml in ethanol) was diluted with polysorbate 80 (Wako Pure Chemical Industries, Ltd., Osaka, Japan) and 5% dextrose (Sigma-Aldrich Chemical Co., St. Louis, MO, USA) in water (D5W) as described in previous reports22. The prepared solutions were administered by intravenous injection 2 weeks after AOM/DSS treatment and Raman measurements were then carried out 2 weeks after the anticancer drug treatments. Control mouse models were treated with normal saline instead of anticancer drugs. There were five 5-FU, three CDDP, three docetaxel treated and two control AOM/DSS mouse models prepared. Three of the 5-FU treated models underwent Raman observation before
- 39 -
and after the drug treatments. CDDP and docetaxel treated models didn't observed before and after treatments. All chemicals used were reagent, not medical, grade.
3. Raman measurements
A Raman system equipped with BHRP and a miniaturized endoscope were used for in situ Raman measurement in the live mouse colon11,12. The endoscope (Machida Endoscope Co. Ltd., Japan) had a 1.2 mm diameter channel for the BHRP, illumination, and image fibers, and its total diameter was 2.5 mm. The BHRP had a sapphire ball lens 500 m in diameter (Edmund Optics, USA) and a hollow optical fiber of 420 m outer diameter (Doko Engineering LLC, Japan)9-12. A diode laser (785 nm, Toptica Photonics, Germany) was used for excitation. The Raman system included a single polychromatic Raman spectrometer (F4.2, focal length 320 mm, 750 nm blazed 600 l/mm grating; Photon Design Co. Ltd., Japan) and a charge coupled device detector (DU420-BRDD; Andor Technology Co. Ltd., Northern Ireland). The BHRP was coupled to the spectrometer through a long-pass filter (LF; Semrock, USA), a notch filter (NF; Kaiser
Fig.2-1 The structure of the miniaturized Raman endoscopic system with a schematic drawing of the experimental setup (a); the structure of the head of the endoscope and image of the Raman measurement in a colon tumor (b).
- 40 -
Optical System, USA), and 2 lenses to focus the laser and Raman scattered light into the hollow optical fiber and the slit (100 µm width: ~10 nm of spectral resolution). Schematic pictures of the Raman system are depicted in Fig. 2-1. The detailed specifics of the instruments have been described elsewhere23. To obtain high quality Raman spectra, the laser power was 60 mW and the exposure time was 60 seconds.
4. Procedure for endoscopic observation
The mouse was anesthetized using an inhalation anesthesia apparatus (SurgiVet, USA) and kept on a warming plate to maintain body temperature23.The concentration of isoflurane (Mylan, Tokyo, Japan) was carefully controlled in the range between 1.0 and 2.5%. The endoscope was inserted into colon through the anus, and then the lumen was pressurized with air via the channel to maintain the field of view. Feces that remained in the colon were removed by washing with saline. The BHRP was inserted into the endoscope’s channel to measure the Raman spectra. The distance of the tumor from the anus was recorded through repeated measurements. The detailed procedure for observation and measurement has been described previously23.
5. Histology study
Mice were sacrificed under anesthesia after Raman measurement and the colon was resected. The colon tissue was fixed with 10% formaldehyde (Wako Pure Chemical Industries, Ltd., Japan) for 24 hours and dehydrated with ethanol. The tissue was sliced at 5 µm thickness after paraffin (Sakura Fineteck, Japan) embedding25 and the samples were stained with Masson's trichrome stain HT15-1KT kit (Sigma-Aldrich Chemical Co., St. Louis, MO, USA) and Mayer's hematoxylin solution (Sigma-Aldrich Chemical Co.,