Income Disparity among the Elderly in Japan :
Life-course Factors Affecting Retired Life
page range
1-18
year
2016-03
No.1
Income Disparity among the Elderly in Japan:
Life-course Factors Affecting Retired Life
Kazuo SEIYAMA
Kwansei Gakuin University
Income Disparity among the Elderly in Japan:
Life-course Factors Affecting Retired Life
*Kazuo Seiyama**
Abstract
The income inequality among Japanese elderly is known to be considerably high. But neither the reason of this high inequality nor the factors which affect the elderly’s income level in Japan are not known. Even inquiries on this problem are rare. Then, this work examines, using a nation-wide and individual-level survey data, how the income distribution among the retired male elderly is deter-mined. The original male respondents of the survey are composed of those age 55-84 years. It is found that retirement generally begins at around age 60, and by age 70 most men have retired. After age 65, the main source of personal income tends to be pension, which comprises more than two-thirds of total personal income. Because overall income inequality among retired men reflects ine-quality in pension income, we examined the factors on the individual pension income levels. The results are astonishing, though not unexpected; that is, the career factors exert very strong effects on pension income. The effect of education level is strong but only indirect. Two important factors are identified; they are the type of main occupation and the firm size when respondents were working.
Keywords
Income inequality, retired elderly, pension, career effect, main occupation
Introduction
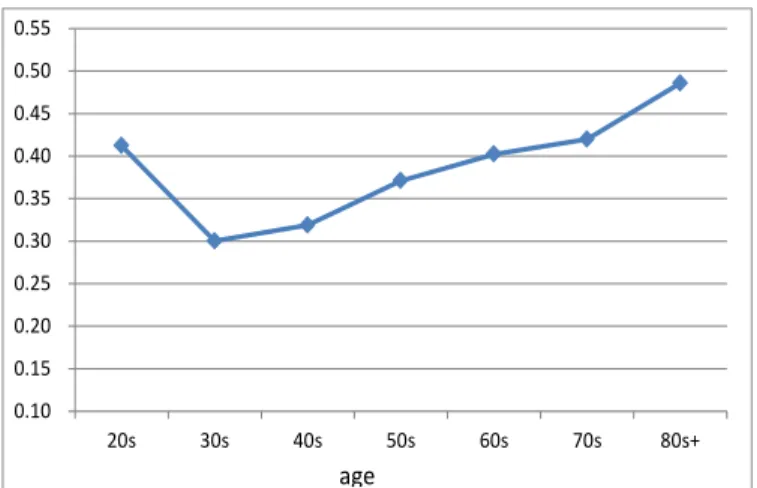
With societies increasingly aging, inequality within the retired population should more fre-quently be the focus of stratification research. Especially, it has been well known that in Japan, income inequality among the elderly is consistently and considerably higher than that seen in other age groups (Seike and Yamada 2004). Empirical evidence in support of this assertion can be seen in Figure 1. This characteristic is said to be internationally peculiar to Japan1.
* This work is a part of the research project “A Comprehensive Study Examining the Forms of Social
Stratification in an Aging Society and Constructing Public Norms” (PI: Sawako Shirahase), and it was supported by a JSPS Grant-in-Aid for Scientific Research (S) 2008–2012 (Grant Number 20223004).
** Professor, Graduate School of Sociology, Kwansei-Gakuin University.
Email: [email protected].
1
Yamada (2002: Table 3.1) reports that among the nine OECD countries, the tendency for there to be greater income inequality among the retirement-age population relative to the working-age population was found only in Japan and the United States. Besides, the extent of the difference between the age groups regarding the degree of inequality was much larger in Japan than in the United States.
In my previous study (Seiyama 2009), using 1995 SSM data, I analyzed the reasons for greater income disparity among the elderly in Japan. In that analysis, six distinct effects that might have influenced the peculiarity of income inequality among the elderly were hy-pothesized and examined. These were the Retirement effect, Pension effect, Bipolarization effect, Career effect, Self-employed effect, and De-standardization effect. Among these ef-fects, three effects were found to be significant—namely, the Retirement effect, De-stand-ardization effect, and Self-employed effect. On the other hand, the Career effect was only slight. In concrete terms, the effect of a difference in occupational careers in the later work-ing years on income level was found to be very small.
However, there were two serious defects in the data on which the analysis was based: people aged more than 70 years were excluded, and information on income sources (including pension) were not available.
Generally speaking, in spite of the importance and peculiarity of income inequality among the elderly in Japan, there have been only a few studies on how the elderly’s income distribution is determined. Even so, in those studies that attempted such analyses, only household incomes headed by an elderly individual were addressed; this is mainly because official statistics on income distribution in Japan are limited to household income, and they disregard individual or personal income. Since the amount of household income is affected by too many variables that relate to household composition—such as whether or not the household head is married, the number of earners, and each earner’s working situation—it is very difficult to draw clear analytical results from household income data (e.g., Horie et al. 2008).
To obtain a clear understanding of the mechanisms of income distribution among the elderly, we need to have access to data on individual or personal income, and analyze
0.10 0.15 0.20 0.25 0.30 0.35 0.40 0.45 0.50 0.55 20s 30s 40s 50s 60s 70s 80s+ age
Figure 1. Income inequality within age group (Gini coefficient): Source, Comprehensive Survey on Living Condition (2009)
the information therein. As such, this study is an analysis of individual-level income dispar-ity among the elderly. The data are based on a nation-wide survey conducted in 2010, headed by Sawako Shirahase, with 6,442 effective respondents, both male and female, aged 50–84 years; these data contain various stratification variables, as well as information on income sources. In this analysis, to maintain clarity throughout, we focus on income inequality among retired men aged 65 or older; occasionally, we reference household income and fe-male respondents’ income.
This analysis thus reveals a new picture—one that is entirely different from that offered by the previous study—of income inequality among the Japanese elderly. That is, the career effect is extremely high. The details of this finding are demonstrated in the fol-lowing.
Age Differences in Income Distribution
Average income and income sources
As one grows older, his or her amount of income changes, as does its source. Before ana-lyzing income inequality among retired Japanese men, we would like to determine the var-ious income situations that exist among the varvar-ious age groups, from middle-aged to retired.
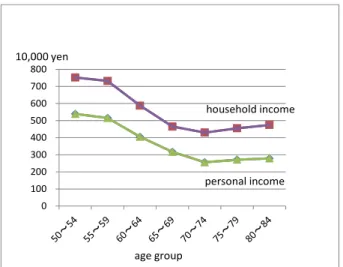
Table 1 shows the average incomes for each age group (broken into five-year in-tervals) in our respondents; here, all respondents are included. Figure 2 depicts the same data figuratively, but only for male respondents. The average income—at both the personal and household levels—of the age 50–54 group (i.e., the youngest group in our data) was the highest. It declines from the 60s and into the early 70s, and drops to a lower level thereafter.
Table 1. Average Income by Age Group
age personal income household income personal income household
income male female 50~54 539.5 752.3 193.9 756.3 424 491 55~59 515.1 731.7 157.5 623.9 471 531 60~64 405.4 587.6 145.3 537.4 613 675 65~69 317.1 465.2 133.9 440.0 530 568 70~74 256.3 430.0 126.4 400.4 463 464 75~79 271.1 455.2 111.5 381.3 380 388 80~84 279.1 474.4 113.4 444.4 198 246 total 378.3 565.9 143.6 526.7 3079 3363
male respontents female respondents
number of respondents including NA
Figure 2 clearly shows a transitional pattern of income level from working age to retired age. After the peak in the working age—which is at around 55 years of age—the age-specific average income decreases. The downward slope is steep in the 60s.
One should bear in mind that our data are not panel data, and so the age difference does not represent a temporary transition; it only shows contemporary differences among the different age groups at one point in time. However, with this in mind, we can somehow estimate an average transitional change in income situation as age advances. From this viewpoint, the age groups can be classified into three broad categories: working age, 50~59 years; transition age, 60~69 years; and retired age, 70~84 years. This classification derives from the age differences in average personal income among the male respondents shown in Table 1 and Figure 2, in which seven five-year age groups are distinguished. They can be reclassified into three broad categories according to income level. For the first two age groups, the average male personal income is above JPY5,000,000; it is below JPY3,000,000 for each of the last three age groups, while the average male personal incomes of the two 60s groups are in the middle. Of course, the labels of the three categories—that is, “working, transition, and retired”—only roughly represent their characteristics. For example, actual transition seems to begin not at age 60, but in the late 50s, and they continue into the early 70s. Nevertheless, we can accept this three-tier categorization as being consistent with the fundamental life stages of men in later adulthood.
When one retires, not only the amount of income but also its source changes. Fol-lowing complete retirement, one receives no working income; he or she may receive a pen-sion benefit, however. Most contemporary Japanese retired elderly receive a certain penpen-sion amount annually1.
Table 2 shows the compositional percentages of sources of male respondents’
1
For a brief introduction to the pension system of Japan, see OECD (2013).
0 100 200 300 400 500 600 700 800
Figure 2. Average income by age: male respondents
10,000 yen
age group
household income
sonal income in each age group. For the working age (50~59 years old), most personal in-come consists of working inin-come. After age 60, the proportion of working inin-come starts to decline, while the share of pension income increases. The transition continues up to around age 70. After 70 years of age, the proportion of pension income exceeds 75%; working in-come comprises only a small proportion.
In passing, it should be noted that in each age group, the share of capital income is entirely negligible. This is a well-known Japanese characteristic of average personal income composition.
This age-based difference in the sources of personal income clearly corresponds to that which pertains to average income. The average income changes in accordance with the extent to which working income is supplanted by pension income; this is because, for these age groups, the average pension income is surely lower than the average working income. In relation to personal income composition, we may look at household income com-position not in terms of types of source, but the proportions of each household member’s personal income. Table 3 shows this for male respondents. The share of spouse’s personal income remains relatively unchanged among the age groups, while the share of “other” in-come slightly increases with age. This “other” inin-come mainly consists of inin-come from chil-dren or other relatives who live with them.
Table 2. Components of personal income (male)
Age Working Income
Capital
Income Pension Other 50~54 93.9 1.8 1.7 1.1 55~59 89.4 3.2 2.2 2.4 60~64 62.8 3.7 31.0 2.1 65~69 26.9 4.4 67.2 1.3 70~74 16.1 5.1 75.6 2.0 75~79 11.6 5.2 81.0 1.6 80~84 6.9 5.1 85.2 2.0 total 49.3 3.9 44.5 1.8
Table 3. Component of household income (%;male)
50~54 71.0 21.7 7.4 100 55~59 69.7 19.1 11.2 100 60~64 68.5 19.2 12.3 100 65~69 67.1 17.7 15.2 100 70~74 59.1 20.5 20.4 100 75~79 60.4 18.2 21.4 100 80~84 58.9 15.1 26.0 100 total 66.4 19.1 14.6 100 respondent's personal income spouse's personal income other age total
As mentioned, we mainly focus on data from male respondents. The transitional effect from working age to retired age is larger for men than for women, reflecting the fact that a great majority of women aged 50 years or more at the time of our research had spent their life as a housewife. Of course, housewives also experience certain transitional effects from their husbands’ transition, and women with a work career should experience a transi-tion similar to that experienced by male workers. However, housewives do not experience a personal income change to any significant degree, while women with a work career do. The heterogeneity of their experiences seems so large, even within an age group, that it is very difficult to draw from our age group data any consistent consensus regarding age dif-ference or transition.
Income inequality within age group
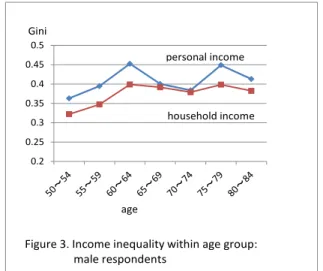
Figure 3 shows the Gini coefficients of within-group income distribution. Several traits can be highlighted with regard to the age difference in income inequality as shown in Fig-ure 3.
(a) Roughly speaking, income inequality is greater in the transition-age and retired-age groups than in the working-retired-age group; this aligns with the tendencies seen in many official survey data (such as those in Figure 1).
(b) However, there are some differences compared to Figure 1. First, the personal in-come inequality seen in the age 65–69 group and in the age 70–74 group is less pronounced than that of either the age 60–64 group or the older groups.
(c) Second, in terms of both personal income and household income, age-correlated successive increases in inequality, such as those found in Figure 1, do not exist.
The reason for the lack, in our data, of the inequality-ascending tendency otherwise observed in many official survey datasets is not clear. Figure 4 shows the concrete income distributions within our data for the four age groups. From this, we can identify some reasons for the age-related differences in Gini coefficients seen in Figure 3, at least in terms of the shape of the distribution.
0.2 0.25 0.3 0.35 0.4 0.45 0.5
Figure 3. Income inequality within age group: male respondents
age Gini
personal income
(a) Compared to the working-age 50–54 group, the proportion of lower- income strata in the transition-age 60–64 group is larger and the proportion of middle-income strata is smaller, bringing about a higher Gini coefficient.
(b) Compared to the early transition-age 60–64 group, in the retired-age 70–74 group, more people are concentrated in lower-income strata and fewer people remain in higher-income strata. These circumstances engender a decrease in the Gini coeffi-cient, as people are made “more equal” merely by gathering together in a lower-income strata.
(c) Compared to the early retired-age 70–74 group, in the next age group (i.e., 75–79), more people are located in the middle or higher-income strata, thus producing an increase in inequality.
The reason for the variation in Gini coefficients among different age groups can be understood in this way, at least with our data. Of course, some age differences in income distribution can also be understood in terms of differences in actual situations. As an exam-ple, the reason why, in comparison to the working-age group, more people in the age 60–64 group are located in the lower-income strata than in the middle-income strata is simply that a considerable number of respondents in that group have already retired or moved to a sec-ond workplace with a smaller salary.
Nonetheless, it is not clear why, in comparison to the age 70–74 group, more people in the age 75–79 group are found in the middle or higher-income strata than in the lower-income strata. It is suspected that part of the reason for these distributional characteristics—
which are not readily understood in terms of actual situations—might relate to some of pe-culiarities of the respondents in our survey data. Especially, it seems that our respondents are somehow over-represented by more affluent people, and this over-representation is stronger in older-age groups. This could have stemmed from the tendency in which—in terms of motivational respects or actual living situations—for the elderly, there are greater differences among income strata in terms of their inclination to respond to a social survey such as ours, than those seen among younger age groups: people in higher-income strata are relatively more likely to respond to such a survey, while those in lower-income strata tend to decline or reject participation.
Whatever the case may be, it is not possible here to correct “deviations” in our data from “an exact sample.” As for personal income distribution among the elderly in Japan, to date, there have been no “exact or ideal” data. Therefore, the best strategy is simply to re-main cognizant of possible representational bias in our data, and to be cautious in drawing interpretations or conclusions.
Other age differences
As people age, their working situation naturally changes. Figure 5 shows the pattern of oc-cupational change by age group. Here, occupations are classified into four categories: Pro-fessional or Managerial (Prof–Mng), Clerk or Sales (Clerk–Sales), Manual, and Not work-ing.
The main findings here are as follows.
(a) There is the tendency that higher one’s occupational status is, the more likely that retirement will occur earlier.
(b) A majority of men retire during the ages of 60–69. (c) However, even in their 70s, some are still working.
0.0 10.0 20.0 30.0 40.0 50.0 60.0 70.0 80.0 90.0 50~54 55~59 60~64 65~69 70~74 75~79 80~84 Prof-Mng Clerk-Sales Manual Not working
Figure 5. Distribution of Current Occupation by age group (male)
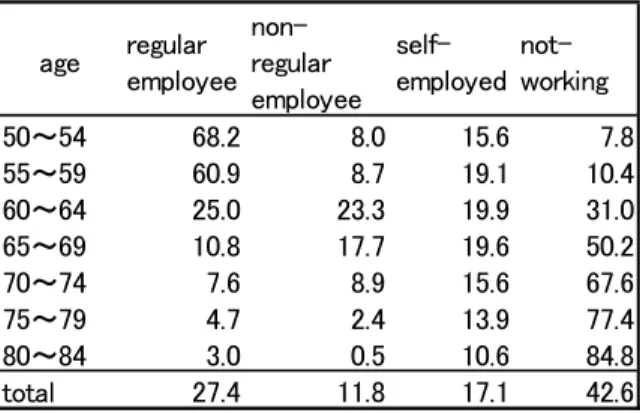
With aging, one experiences changes in occupational status. Table 4 shows the dis-tribution of occupational status for each age group. One noticeable feature here is that the proportion of nonregular employment is high for the transition-age group (i.e., 60–69). It is also noteworthy that those who are in the retired-age groups and still working are mostly either nonregular employees or self-employed. They comprise more than 75% of the work-ing respondents in those age groups.
Income Inequality among Retired Elderly Men
Main Occupation and Education
We now turn to focus on income inequality among retired elderly men. Although retired persons do not receive working income, their current incomes somehow reflect differences in their previous career. Among various career-related variables, education level and occu-pational career are especially important.
The Education of a respondent is a variable that can be captured through a routine questionnaire; however, this is not the case with occupational career. The latter should ba-sically be a very complex variable.
In this study, we would like to understand, as straightforwardly as possible, the mechanism by which income inequality among the retired elderly is determined. With this viewpoint in mind, we choose a simple variable or a set of variables to represent one’s oc-cupational career. Here, one’s ococ-cupational career is represented by the occupation in which a respondent has engaged for the longest period of time—in other words, the “longest” oc-cupation. In our survey questionnaire, we asked all respondents—whether still working or retired—“what has been the occupation in which you have ever engaged for the longest period of time?” The answers were coded as per our occupation coding system.
The variable Main Occupation is constructed from the coded occupational status of the longest occupation. In this study, we use a three-category scheme of occupational status classification: Professional or managerial, Clerks or sales workers, and Manual workers. The distribution of each age group is shown in Table 5.
Table 4. Occupational Status (%; male)
age regular employee non-regular employee self-employed not-working 50~54 68.2 8.0 15.6 7.8 55~59 60.9 8.7 19.1 10.4 60~64 25.0 23.3 19.9 31.0 65~69 10.8 17.7 19.6 50.2 70~74 7.6 8.9 15.6 67.6 75~79 4.7 2.4 13.9 77.4 80~84 3.0 0.5 10.6 84.8 total 27.4 11.8 17.1 42.6
For convenience, hereafter, we use the term “main occupation” rather than “the longest occupation”; we do so because, although the occupation we asked about in the ques-tionnaire was “the longest,” it can be interpreted as “the main occupation” in the respond-ents’ occupational career.
It should be noted from Table 5 that our male respondents again seem to be over-represented by those from higher social strata (i.e., those with professional or managerial occupations). We have already suggested the reason for this, and analysis needs to be un-dertaken with this in mind.
Table 6 shows the cross-tabulation of Education and Main Occupation. The pattern of association between the two variables is remarkably similar among the various age groups.
Table 5. Distribution of Main Occupation (male; row %) Prof-Mng Clerk-Sales Manual
50~54 45.6 18.2 36.2 390 55~59 40.4 20.8 38.8 428 60~64 42.7 17.6 39.8 558 65~69 37.6 18.5 43.9 476 70~74 32.4 19.6 48.0 392 75~79 33.3 15.6 51.1 327 80~84 38.7 16.6 44.8 163 total 39.0 18.3 42.6 2734
age Main Ooccupation (%) n
*Main occupation is defined as the occupation in which a respondent has engaged the longest period of time
Prof-Mng Clerk-Sales Manual Low 14.1 2.8 83.1 Middle 29.6 19.8 50.5 High 64.3 22.8 13.0 Total 43.0 19.6 37.4 Low 9.2 9.2 81.7 Middle 35.2 21.7 43.1 High 74.4 16.7 8.9 Total 42.8 17.6 39.6 Low 10.1 13.1 76.8 Middle 36.9 21.9 41.2 High 73.7 18.3 8.0 Total 35.2 17.9 46.9 Low 10.4 11.4 78.3 Middle 34.2 21.2 44.6 High 69.9 19.8 10.3 Total 39.1 18.4 42.5 50~59 60~64 65~84 Total
Table 6. Cross Tabulation of Education and Main Occupation (male; row %)
Income inequality by career difference
Now let us see examine income inequality in terms of career differences. Figure 6 shows how inequality in personal income among the various education levels changes with age. Absolute inequality seems to decrease, but relative inequality remains at almost the same level. Among the working-age respondents, those with a high education level earn, on aver-age, 2.5 times more than those with a low education level. Although the amount of average personal income decreases with aging across all education levels, similar inequality persists. Among retired-age respondents, those with a high education level earn, on average, two times more than those with a low education level.
As for income inequality by main occupation, Table 7 shows a similar trend. Across all age groups, the respondents whose main occupations are (or were) professional or man-agerial earn two times more income than those whose main occupations were of a manual worker variety. 0 100 200 300 400 500 600 700 800 50~54 55~59 60~64 65~69 70~74 75~79 80~84 low middle high total
Figure 6. Personal income by education (male)
10,000 yen age education 0 100 200 300 400 500 600 700 800 50~59 60~64 65~84 Prof-Mng Clerk-Sales Manual
Figure 7. Personal income by Main Occupation (male)
10,000 yen
Pension income
The reason why income inequality persists even after retirement should be the existence of inequality in pension income. This is in fact the case. Figure 8 shows the average pension income, for respondents aged 65 or older, of each cross-classified group by Education and Main Occupation. In general, the higher the Education and the higher the Main Occupation status are, the higher the average pension income will be. The combined effect of the two career variables is not linear: the higher the status in one’s career variable is, the greater the inequality in status in terms of another variable.
In relation to inequality among the various occupational statuses, we would like to see differences in inequality within each occupational status. Figure 9 shows the Gini coef-ficients within each education level. The inequality in pension income among all elderly male respondents is slightly lower than that in personal income as shown in Figure 3. Inter-estingly, the higher the education level is, the lower inequality is within that level.
0 0.1 0.2 0.3 0.4 0.5
Low Middle High Total
Figure 9. Pension Income Inequality within Educational Group (male 65+)
Gini coefficient 0 0.1 0.2 0.3 0.4 0.5
Prof-Mng Clerk-Sales Manual Total
Figure 10. Pension Income Inquality within Occupation Group (male 65+)
main occupation
A similar pattern is found in the inequality within each main occupation, as shown in Figure 10.
Regression Analysis
Factor variables
Now we would like to analyze how pension income and personal income are determined. In the following analysis, as mentioned, we focus on retired male respondents aged 65 or older, and exclude those who are still working. This is because we want to know the income cir-cumstances of completely retired elderly men, who are absent of any effect of working op-portunity.
For this purpose, in addition to Education and Main Occupation, three new career variables are introduced—namely, Firm Size, Executive, and Edu*Occ. They represent fac-tors that are conceptually independent of both Education and Main Occupation—although they are statistically related—and yet conceived to affect the amount of pension income.
The first two new career variables are introduced because our variable Main Occu-pation cannot capture all the status characteristics that relate to the actual main occuOccu-pation. The variable Main Occupation takes three categorical values: professional or managerial, clerk or sales, and manual. This measures an aspect of main occupation while focusing on what “kind of job” one is engaged. However, there are other aspects. For example, two individuals whose main occupation as measured by Main Occupation may be the same— say, managerial—but might have been employed in firms of different sizes: one worked at a large company, while the other worked in a small company. As such, their working income might have greatly differed. Likewise, even if one’s main occupation were categorized as managerial, his working income could be greatly affected by whether he was a member of a board of directors or simply a manager of a section.
As such, these are good reasons for why we introduce the new career variables. More precise definitions follow below.
Firm Size
Firm Size represents the size of the company where the respondent was engaged in his Main Occupation. The size is simply the number of employees. In our data, size is dif-ferentiated into eight categories. Those categories, along with the average pension income for each, are shown in Table 7
As is clear, inequality among the various firm sizes in terms of the amount of pen-sion income is considerably large. Generally, the larger the firm size, the larger the penpen-sion that a respondent enjoys. The most advantaged group—namely, those with a firm size of 1,000 or more employees—receives more than three times that of the least advantaged group—namely, the firm size of fewer than five. There are two possible reasons for this inequality. One is that the inequality simply reflects differences in working income during working years: those in large companies or in the public sector can generally earn more than those in smaller companies. Since the pension system is constructed in such a way that the amount of pension benefit to be paid after retirement is basically proportional to the amount of working income earned when one worked, the average pension income tends to correlate with firm size.
The second reason is that those who are working in smaller companies or are self-employed have a certain tendency not to be covered by the pension system during their working years. That is, those who are (or were) working in an unstable labor market sector tend not to be part of the pension insurance system. Then, for those who had been working mainly in small companies or had been self-employed, the amount of pension benefit tends to be smaller than what they could have enjoyed, had they paid full pension premiums throughout their working years.
For these two reasons, the Firm Size of the Main Occupation is found to have a strong effect on the average amount of pension income.
Based on these considerations, we incorporate the variable Firm Size; it takes four rather than eight different values, according to the number of workers at the firm: 0, for fewer than five workers; 1, for 5–29 workers; 2, for 30–499 workers; and 3, for more than 499 workers, or the public sector. Since the values are assigned so as to be more or less proportional to the average pension income of each group differentiated by firm size, we may treat Firm Size as a ratio variable in regression.
Size Annual Pension
(number of workers) (10,000 yen) less than 5 87.7 109 5~29 143.6 151 30~99 185.7 89 100~299 195.7 92 300~499 191.8 48 500~999 259.9 39 1,000 or more 289.7 196 public sector 259.4 126 NA 134.7 90 total 198.6 940 n (retired male, 65+)
Table 7. Average Pension Income by Firm Size of Main Occupation
Executive
There is an important factor on working income that is conceptually independent of occupational status, in terms of both kinds of job and firm size—that is, whether or not one’s employment status is of an officer, such as president, executive, director, or a business owner. Individuals with such status tend to receive a certain level of executive compensa-tion. We therefore define a dichotomous variable Executive, which takes the value of 1 if the status of a respondent’s main occupation is of some kind of officer, and 0 otherwise. Cross-effect of Education and Main Occupation
It is clear from Figure 8 that the combined effect of Education and Main Occupa-tion is not linear. To incorporate this cross-effect into our analysis, we constructed a simple variable called Edu*Occ. Edu*Occ takes the value 1 only if a respondent’s education is high and his main occupation is professional or managerial.
We can now proceed with the regression analyses. To lessen the effects of unob-served variables, we introduce two controlled variables: Age and Region. Age is simply the respondent’s age, while Region is a dichotomous variable that takes the value of 1 if the respondent lives in the Kanto or Kansai area, and 0 otherwise. Region is meant to control for unspecified effects that could be induced by living in different areas in Japan.
The regression is undertaken as shown in Figure 11.
Persistent career effects: results of regression analysis
As was expected, the amounts of pension income among retired men were found to be largely determined by their working-years career. The extent is astonishingly high, as indi-cated by the adjusted R2 values in both Models 1 and 2.
the amount of income increment when the value of a factor variable increases by a single unit. So, as one can see in Model 1, for example, having a professional or managerial career yields JPY487,000, or approximately USD4,870, more annual pension income than those with a manual laborer career.
At the same time, one can also see from Model 2 that the important factors are not limited to Main Occupation and Education; the other career factors also affect income very strongly. One especially noteworthy finding is that the effect of Education—especially that of a high Education—disappears when Executive and Edu*Occ are input simultaneously. This means that the effect of having a high education level is intermediated by these two factors. Of course, by definition, the factor Edu*Occ largely coincides with a high Educa-tion; however, the point here is that having a career with a high education level of does not directly yield a significant increase in pension income, unless it entails career factors such as having a professional or managerial Main Occupation, having been employed by a large firm or in the public sector, or having served as an executive in one’s main occupation.
Table 9 shows how personal income—of which pension income constitutes a main part—is determined. Not surprisingly, it is mostly determined by the amount of pension income. At the same time, it should be emphasized that there are certain kinds of direct and additional career effects on personal income. Although the increment of the adjusted R2 by additional factor inputs is not very large (i.e., 0.020 for Model 2), it is not insignificant. Among those that still directly affect personal income, the most important is Executive, the variable that indicates that one’s employment status in his main occupation was as an officer (e.g., president, executive, director, or a business owner). The respondents here are all re-tired at the time of the survey—that is, not working. It seems that those who had been in a certain kind of executive status benefitted from some extra income, even after retirement.
Table 8. Regression of Pension Income (retired male aged 65 or more)
factors B β B β
intercept 64.4 41.7
Main Occ (1) Clerk-Sales 21.0 0.064 ** 26.2 0.079 **
Prof-Mng 48.7 0.187 *** 33.4 0.128 *** Education (2) Middle 18.9 0.075 ** 18.0 0.071 ** Hgh 37.9 0.128 *** 8.0 0.027 Firm Size 52.8 0.451 *** 55.7 0.475 *** Executive 39.7 0.103 *** Edu*Occ 42.4 0.126 ** Age 0.06 0.003 Region 17.8 0.066 ** Adj R2= 0.352 Adj R2= 0.366 notes (1)base= Manual ***<0.01 **<0.05 *<0.1 (2)base= Low Model1 Model2
Conclusion
In this study, we attempted to analyze factors that pertain to the amount of personal income among retired elderly men in Japan. The most important finding here is that those career factors determined during their working years continued to exert extremely strong effects in their retired years. This being the central point, the main findings concerning income dis-parity among Japanese elderly men are as follows.
(a) Retirement generally begins at around age 60, and by age 70, two-thirds of Jap-anese men have retired. The age 60–69 period comprises a kind of transition age between working and retired ages.
(b) After age 65, the main source of personal income tends to be pension, which comprises more than two-thirds of total personal income. The overall income inequality among retired men reflects inequality in pension income.
(c) The amounts of annual pension income for retired men aged 65 or older are largely determined by their education levels and the characteristics of their working-years occupational career.
(d) Occupational career characteristics can be differentiated into three specific var-iables: Main Occupation, which represents the “kind of occupation” of the longest occupa-tion in which a respondent has ever engaged; Firm Size (i.e., number of employees within the company) of the longest occupation; and Executive, which signifies whether or not the respondent’s status in his longest occupation is as an officer (e.g., president, executive, di-rector, or business owner). All three of these variables strongly affect a respondent’s pension
Table 9. Regression of Personal Income on Pension Income and other factors (retired male aged 65 or more)
factors B β B β B β
intercept 54.5 34.6 153.0
Pension Income 0.904 0.658 *** 0.785 0.571 *** 0.777 0.565 ***
Main Occ (1) Clerk-Sales 29.1 0.064 ** 28.1 0.062 **
Prof-Mng 25.7 0.072 * 23.1 0.065 * Education (2) Middle -7.8 -0.022 -9.8 -0.028 Hgh 22.8 0.050 26.1 0.057 * Firm Size 12.9 0.080 ** 12.7 0.079 ** Executive 55.2 0.104 *** 55.5 0.105 *** Edu*Occ 22.8 0.050 28.1 0.057 * Age -1.7 -0.054 ** Region 20.0 0.054 **
Adj R2=0.432 Adj R2=0.452 Adj R2=0.457
notes
(1)base= Manual ***<0.01 **<0.05 *<0.1
(2)base= Low
income after his retirement. Especially, the effect of Firm Size is astonishingly high. (e) The effect of Education on pension income seems to be an indirect one; it is mostly mediated by occupational characteristics.
(f) As for overall personal income, while it is largely determined by pension in-come, there are certain direct effects of working career factors.
Frankly, these findings are quite surprising (and gloomy) for those who hope for people’s lives to be more “open” upon retirement, and as equal as possible. Our findings show not only that life opportunities after retirement are almost always determined by career experiences during one’s working years, but also that inequality of life opportunities in terms of income is extremely high. For many, this finding feels very unfair and unsound.
One reason for this strong linkage between retired life circumstances and working career characteristics derives from the way in which Japan’s pension system is constructed. The benefits one can receive upon retirement closely relate to one’s earnings during their active working years. Any strong sense of unfairness, mentioned above, derives from the fact fortunes or misfortunes experienced during one’s active working years “remain in stone” after retirement: one’s destiny in retired life is predetermined.
Unfortunately, it will be difficult to change the pension system in this respect. How-ever, this does not mean that there is no way of reducing income inequality among the el-derly. There appear to be at least two approaches by which inequality among the elderly can be ameliorated. One is to lessen working-income inequality; another is the creation of a certain set of redistribution measures that target the elderly.
The inequality witnessed in this study pertains to that seen in 2010 data. It is hoped that, in future, the situation can be somehow be changed so as to reduce inequality.
Bibliography
Horie, Naoko, Yasuko Oshima, and Tsukagoshi Yuka, 2008, Japan's Widening Income Gap among the Elderly: necessary measures for the reconstruction of an income safety net, MIZUHO Research Paper, 19.
OECD, 2013, Pensions at a Glance 2013: Retirement-Income Systems in OECD and G20 Countries, OECD Publishing.
Seike, Atsushi, and Atsuhiro Yamada, 2004, Economics of Elderly Employment. (in Japa-nese) Nihonkeizai Shimbunsha.
Seiyama, Kazuo, 2009, "Why is the Income Inequality among Japanese Elderly so Large? An Examination of the Effect of Job Career", paper presented at RC28 Conference in Yale University, August 3-6, 2009.
Yamada, Atsuhiro, 2002, "The Evolving Retirement Income Package: Trends in Adequacy and Equality in Nine OECD Countries", OECD Labour Market and Social Policy Oc-casional Papers, No. 63.