トップページ - 横浜国立大学学術情報リポジトリ
31
0
0
全文
(2) and/or graduate programs in English through its Global 30 project (Ministry of Education, 2015, 2016).2 A prominent feature of these programs is that they enroll students from all over the world for whom English is a foreign language. In addition, the faculty members as well are likely to be predominantly non-native speakers of English as well. To date, research on the effects of study abroad has focused on students returning from study abroad in countries where English is the dominant language (i.e., Australia, Canada, New Zealand, the United Kingdom, and the United States). The question is, however, can improvement in English ability be observed when the students are in a country where English is not the dominant language? The present study aims to contribute to this body of research by investigating gains in English language ability by three Japanese university students studying abroad. A distinguishing feature of this research is that it examined students in an English-medium study abroad program in a country where English is not the dominant language (Sweden). As such programs have spread around the world, including Japan, the present study fills a gap in the research literature on study abroad. 2. Research Questions In a detailed study of the fluency development of four Japanese students in a study abroad context, Wood (2007) concluded that “[t]he paths taken by the individual participants are quite varied... whether measured quantitatively or by an analysis of the discourse” (p. 226). In light of that research, the present study focused on examining in detail the variation among three individuals rather than trying to discover generalizable trends based on the aggregate data of a large number of participants. Specifically, the present study investigated changes in pre- and post-departure TOEFL iBT scores, oral interviews, and writing samples of three Japanese university students who spent 10 months studying abroad in an English-medium university program. In addition, questionnaires assessed the students’ use of learning strategies, self-perception of English ability, and feelings about studying abroad. Given the fact that the participants were studying in English in a country where English is not the dominant language, the following research questions were investigated: (1) Did the participants’ TOEFL score improve? (2) Was the participants’ use of learning strategies while abroad associated with their improvement in English? (3) Did participants’ self-perception of 2. There are other universities that are not in the Global 30 project but still enable students to do coursework. in English, for example, Yokohama National University (2016).. 4.
(3) their English ability change? (4) Did the participants’ feelings about studying abroad change? (5) Did the participants’ speaking ability improve? (6) Did the participants’ writing ability improve? 3. Literature Review Previous research on the effects of study abroad on foreign language proficiency has produced mixed results (e.g., Okamoto, 2002; Renna-Suzuki, 2006; Sundermann & Kroll, 2009). The study abroad settings, although potentially rich in opportunities for input and interaction, do not necessarily bring about higher proficiency (Ellis, 1994; Tanaka & Ellis, 2003). It is the type of contact that counts, not just the amount of contact (Collentine, 2009). In surveys of previous studies of the effects of study abroad programs on language proficiency, Freed (1995, 1998a, 1998b) and others have found, for example, (1) lower proficiency students gain more than higher proficiency students, (2) gains in speaking skills tend to outpace gains in grammar, listening, and reading, and (3) the fluency and naturalness of speech outpace gains in accuracy and complexity (e.g. Yashima & Viswat, 1997). Although those findings hold true in many cases, there is still considerable variation among individuals in the same study abroad program. Among the many studies that have investigated the effect of study abroad on Japanese learners specifically, a few relevant to the present study will be mentioned here. Yashima and Viswat (1997) in a study of 16 students who spent one year in USA high schools found improvement in speech rate and reduction in unfilled pauses, but no change in false starts and no improvement in grammar. In a study of four Japanese students enrolled full-time in an intensive ESL program at a university in Canada, Wood (2007) found that over a six-month period participants on the whole improved on five temporal measures of fluency, although there was considerable individual variation: speech rate, articulation rate, non-phonation/time ratio (pauses), mean length of runs, and formula/run ratio. In a study of 15 college students studying in a homestay program in Australia, Renna-Suzuki (2006) reported that although there was a mildly positive effect in terms of enhancing the participants’ cross-cultural understanding and adaptation skills, study abroad was found to be ineffective for improving English proficiency (grammar, listening, reading, and writing). In a study of 21 university students participating in a four-week intensive program in the United States, Okamoto (2002) reported an average gain of 26 points on the paper-based TOEFL. A close look at the reported 5.
(4) data, however, reveals that only 12 students (46%) scored more than the Standard Error of Measurement (SEM), 3 which for the paper-based TOEFL is plus or minus 13 points 4 according to the Educational Testing Service (n.d.). The effect of study abroad on the writing ability of Japanese students has also been studied. Sasaki (2007) compared the writing of seven Japanese university students who spent four to nine months in English-speaking countries with six counterparts in Japan and found that the study-abroad group was “more motivated to write better L2 compositions” and improved in “writing ability and fluency” (p. 615). Kohro (2001) compared the writing ability of five college students on a six-month study abroad program in the United States with five counterparts in Japan and found that the study abroad group “had become more confident of their writing abilities” but did not make significant improvement except for “longer sentences per T-unit” (p. 65).5 Another area of research that has been attracting attention in relation to the effectiveness of study abroad is language learning strategies (e.g., Paige, Cohen, & Shively, 2004). Language learning strategies have been described as “tools for active, self-directed involvement, which is essential for developing communicative competence” and “specific actions taken by the learner to make learning easier, faster, more enjoyable, more self-directed, more effective, and more transferable to new situations” (Oxford, 1990, p. 8). For pedagogical and research purposes, Oxford (1990) developed the comprehensive Strategy Inventory for Language Learning (SILL). The SILL framework divides language learning strategies into two domains, “Direct Strategies” and “Indirect Strategies.” According to Oxford, Direct Strategies are “strategies that directly involve the target language” and “require mental processing of the language” (1990, p. 37). They are divided into three categories. Memory Strategies are techniques such as placing new words in context, 3. “The SEM is an index of the degree of uncertainty associated with a test score. There is, by definition, a 68%. likelihood that a candidate's 'true' score (the score obtained without any extraneous influences) is within one SEM of his or her test score [and] a 95% likelihood that a candidate’s “true” score is within two SEMs of his or her test score.” (ETS, 2005, p.2). 4. The SEM of 13 points mentioned here does not apply to the TOEFL iBT scores that appear later in this paper.. The SEM for TOEFL iBT, which the participants in the present study took, has a standard error of 5.64 points. 5. A “T-unit” is a measure of the structural complexity of a sentence. It consists of one independent clause and. any dependent clauses connected to it.. 6.
(5) using keywords, and representing sounds in memory to help the learner store new information and retrieve it later. Cognitive Strategies are techniques such as note-taking, repetition, and summarizing that allow students to better comprehend and produce language in different ways. Compensation Strategies are techniques such as guessing while listening or reading, using synonyms, and paraphrasing while speaking or writing to compensate for weaknesses in the learners’ ability as they use the language. In contrast to Direct Strategies, “Indirect Strategies provide indirect support for language learning through focusing, planning, evaluating, seeking opportunities, controlling anxiety, increasing cooperation and empathy, and other means” (Oxford, 1990, p. 151). They are divided into three categories: Metacognitive Strategies are techniques such as, surveying information and linking it with what one already knows for the purpose of arranging, planning and evaluating one’s learning. Affective Strategies are techniques such as using relaxation techniques and singing songs in a target language to lower one’s anxiety, which are used to regulate emotional behaviors and motivation. Social Strategies are techniques such as asking questions, cooperating with peers, and developing empathy towards target language speaking people, to promote positive interaction with other people in the language learning process. Several researchers have investigated the use of language learning strategies among Japanese students studying abroad. For example, in a study of college students who studied abroad for three and a half months, Takeda (1998) found no change in the use of memory strategies but an increase in the use of cognitive, metacognitive, and social strategies. However, the lower scoring group used memory strategies more on the listening test. In a study of a three-week homestay program in New Zealand, Kimura (2007) found significantly higher use of language learning strategies as measured on Oxford's Strategy Inventory for Language Learning compared to counterparts who did not go abroad. In both groups there was a tendency to use compensation strategies more than memory or affective strategies. In a two-week program in Australia, Morita (2010) found that participants increased their use of memory, cognitive, affective, and social strategies. However, compensation and metacognitive strategies were the more widely used strategies, both before and after the program. In a study of 89 university students in Japan, Matsumoto (2011) found that students with higher motivation used strategies more often than students with lower motivation but that proficiency level had no significant effect on strategy use. The mixed results of the research above and other research on the frequency of strategy use can perhaps be explained 7.
(6) by variations in context and individual differences, making it difficult to draw generalizable conclusions (LoCastro, 1994). 4. Method 4.1 Participants The participants in this study were three Japanese university students majoring in Business Administration at a national university in Japan. All had studied English for eight years: six years at junior and senior high school and another two years at university. Details of their background appear in Table 1. Small sample sizes in study abroad research is not uncommon. For example, Callen (1999) studied one participant, Wood (2007) studied four participants, and Sasaki (2007) studied seven participants. An advantage of a small sample size is that it allows for detailed analysis of each participant on multiple measures. Accordingly, it allows the researcher to assess the extent to which the findings of other larger studies can successfully explain or predict individual cases. 4.2 Setting: The Study Abroad Program The three students participated in a study abroad exchange program conducted by an English-medium program in Business at a Swedish university. In this program, the international students are totally integrated with the Swedish students, together taking courses delivered in English. About one third of the students and faculty come from an international background. During the program, the participants lived in the international students' dormitory. The academic year consisted of 40 weeks, divided into two semesters. Examples of the types of courses they took are Macro Economic Principles, Marketing Management, International Trade Theory, and Business and Academic Communication (English language study). Depending on the course, classes meet 1, 2, 3, or 4 times a week for 2 or 3 hours each time. Table 1. Profiles of the Three Participants Age Major. Student 1. Student 2. Student 3. 21. 22. 21. Business. Business. International. Administration. Administration. Business. 8.
(7) Year in university. 3. 3. 3. 10 months. 10 months. 10 months. 3. 7. 6. Interval between TOEFL tests. 21 months. 17 months. 14 months. Interval between questionnaires. 16 months. 16 months. 16 months. Period abroad Courses taken in English while abroad. Note: Student 1 also took two courses in Swedish as a foreign language for a total of five courses. He reported he was actively using Swedish outside of class in addition to English, whereas the other students reported using English almost exclusively.. 5. Data Collection Before and after their study abroad experience, the students took the TOEFL iBT in Japan. To find out which learning strategies the students used while studying abroad, the Japanese version of the Strategy Inventory for Language Learning (Oxford, 1990, trans. Shishido and Ban, 1994) was administered when they returned to Japan. In addition, they completed pre-departure and reentry questionnaires to assess their self-perception of their English proficiency and how they felt about their study abroad experience (Appendices I and II). Both questionnaires were administered in English. The author also conducted informal interviews in Japanese with the students individually to discover any background information that might be useful in interpreting the data. The pre-departure data collection was implemented about one week before departure. The timing of the reentry data collection varied depending on the availability of the student. To aid in interpreting the before-and-after data, the students were asked to explain any further English study they did after returning to Japan before taking the posttests and completing the reentry questionnaire. The same questions were used for both the pretest and posttest, but the students did not know that in advance. As this was a longitudinal study and the interval between the tests was more than a year, it is unlikely that there was a “practice effect” affecting the results. In fact, an advantage of using the same questions in a before-and-after longitudinal study is that the researcher does not need to be concerned that a difference in the level of difficulty of the questions may hinder or facilitate the participants’ responses. The contents of the reentry questionnaire were nearly identical. One change was that pre-questionnaire Item 6 (“I am looking forward to studying abroad”) was replaced by Items 9.
(8) 6a (“I enjoyed studying abroad”) and Item 6b (”I would like to study abroad again if possible”) in the post-questionnaire. Another change was the addition of the request: “Please explain how you have studied English since returning to Japan.” Speech sample. Each student was interviewed separately. In the interview, three questions, which were modeled after the TOEFL and IELTS independent speaking tests, were asked. The first two questions were about the students’ personal experiences and a topic close to the students’ lives. The third question asked the students to express and support an opinion on a public issue. Each question in turn was handed to the student. The student had one minute to prepare and then three minutes to speak about it. The interviews were recorded and later transcribed for analysis. The three topics were the following: Topic 1: Many students from around the world choose to study abroad. Why do students want to study abroad? Recently, however, fewer Japanese students are studying abroad. Why do you think so? Topic 2: What aspects of Japan such as people, culture, nature, industry, and social system would you like to introduce to foreigners? Give examples and explain why. Topic 3: Should money be spent on space exploration such as a space station and Japanese Hayabusa Mission? Why or why not? Writing sample: The writing task was similar to the IELTS and the TOEFL Test of Written English. Students had 40 minutes to write two short essays (20 minutes each). It was explained that they would be evaluated on their ability to generate and organize ideas, support their ideas with evidence or relevant examples from their own knowledge or experience, and use standard written English. As in the speaking test, one topic was personal and the other dealt with a public issue. The topics were the following: Topic 1: Describe a place you visited that had a big impact on you. Tell when you went and how long you stayed. Describe the impact the place had on you and why. Topic 2: Many Japanese companies are moving their factories to other Asian 10.
(9) countries. Explain the advantages and disadvantages of this policy and state you opinion. 6. Results and Discussion 6.1 TOEFL Results Table 2 summarizes the TOEFL results, and Table 3 matches the score ranges with the equivalent ability level. Each student’s total score exceeded the total score SEM of 5.64 (11, 14, 21). In other words, the students who would have been put into an ESL class at many American universities came back with the level at which they could enroll in non-ESL classes. 6 However, in interpreting the posttest TOEFL results, it is important to take into consideration the SEM for each section of the test (ETS, 2011). All the students exceeded the Speaking SEM of 1.62 points (2, 3, and 4 points). Only two students exceeded the Listening SEM of 3.20 points (5 and 9 points). One student’s score actually decreased (-3 points), but considering the SEM, it could indicate no change in ability rather than a loss of ability. Similarly, two students exceeded the Writing SEM of 2.72 points (7 and 9 points). The one point gain of the other student did not exceed the SEM so it is inconclusive whether this student’s writing improved or not. For Reading, only Student 3, who gained 4 points, exceeded the Reading SEM of 3.35. It is inconclusive whether the other two students (2 and 3 points respectively) actually improved or not. Individual differences, however, were large. For example, Student 3’s total score increased by 20 points compared to only 11 for Student 2. Similarly, Students 2 and 3 made substantial progress in writing, increases of 7 and 9 points respectively, in contrast to only a one-point increase for Student 2, which did not exceed the SEM. Likewise, Student 1 showed the largest improvement in listening (9 points), which was nearly double compared to the other two students. However, it should be noted that Student 1 had the lowest pretest listening score (11 points), which was about half of the others’ scores, which meant he was the most likely candidate to improve. Speaking was the skill least improved for all participants, at least in terms of the skills measured by TOEFL. Overall, improvement in a student’s total score 6. According to data on the American Exam Services (2014) web site, most USA universities require. international students to have a TOEFL iBT score of about 80 points for admission, implying that a score of 80 is considered adequate for enrollment in regular (non-ESL) coursework in these institutions.. 11.
(10) was primarily due to a larger increase in one skill rather than balanced improvement across the skills. Because of the extremely small sample size (only three participants) the data could not be reliably tested for statistical significance. Table 2. Individual TOEFL Results (iBT) Student 1. Student 2. Student 3. Mean. Pre. Post. Diff. Pre. Post. Diff. Pre. Post. Diff. Pre. Post. Diff. Total. 67. 81. 14. 68. 79. 11. 80. 101. 21. 71.66. 87.00. 15.33. Reading. 18. 20. 2. 20. 23*. 3. 24. 28. 4. 20.66. 23.66. 3.00. Listening. 11. 20*. 9. 19. 16. -3. 19. 24*. 5. 16.33. 20.00. 3.77. Speaking. 17. 19*. 2. 14. 18*. 4. 19. 22. 3. 16.66. 19.66. 3.00. Writing:. 21. 22. 1. 15. 22*. 7. 18. 27*. 9. 18.00. 23.66. 5.66. Notes: (1) The TOEFL iBT range is 0–120 for the total score and 0-30 for each section. (2) Asterisks indicate results that have shifted to the next higher level (e.g., from ‘Intermediate’ to ‘High’) based on the score interpretation table shown in Table 3 below. (3) The SEM for the total score of the TOEFL iBT is 5.64. The SEMs for each section are Reading 3.35, Listening 3.20, Speaking 1.62, and Writing 2.76 (ETS, 2011). (4) The intervals between the pretests and posttests for each student appear in Table 1.. Table 3. Interpretation of TOEFL iBT Scores. Skill and Score Range. Level. Reading (0–30). Low (0–14), Intermediate (15–21), High (22–30). Listening (0–30). Low (0–14), Intermediate (15–21), High (22–30). Speaking (0–4 points converted to 0–30 score. Weak (0–9), Limited (10–17),. scale). Fair (18–25), Good (26–30). Writing (0–5 points converted to 0–30 score scale). Limited (1–16), Fair (17–23), Good (24–30). Source: Education Testing Service. (2012). TOEFL for Institutions: Interpret Scores. Retrieved June 30, 2012, from http://www.ets.org/toefl/institutions/scores/interpret/.. In the reentry questionnaire, the students explained how they had continued to study English after they returned to Japan and before they took the posttest TOEFL. All of them had made an effort to keep using English in some way. Mainly, they looked for opportunities to 12.
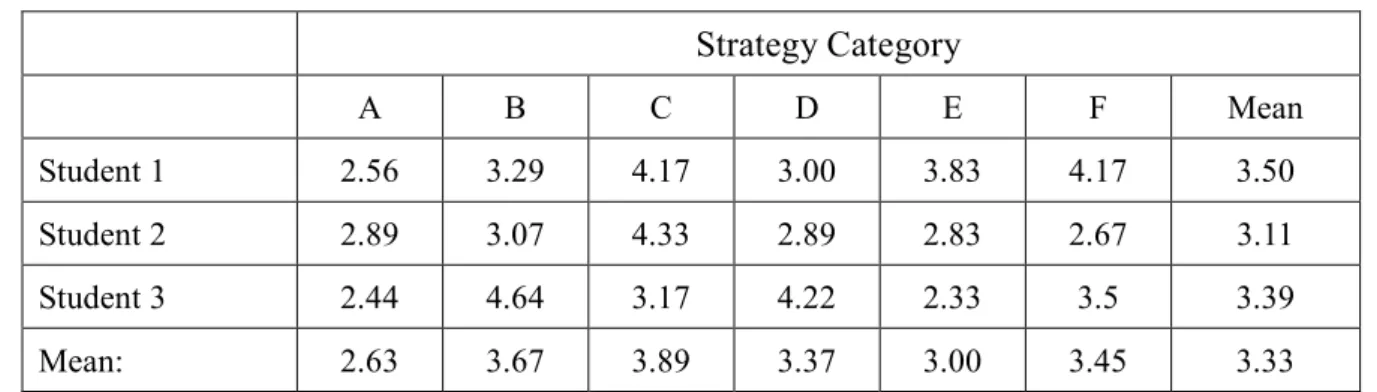
(11) chat or have lunch with English-speaking students on campus from exchange partner schools. Talking with friends abroad through Skype was also mentioned as well as watching movies to maintain their English ability. Did these activities contribute to their posttest TOEFL score? Although students did report using English after their return to Japan, none of the students reported intensive study in any skill area. Their English interaction was limited to chatting with friends, etc. for a limited number of hours per week, generally with the intention of language maintenance rather than improvement. Thus, the total number of hours spent in English post-return and the quality of their interaction with English are unlikely to have been significant enough to have influenced their scores. 6.2 Language Learning Strategies and TOEFL Table 4 shows the results of the Strategy Inventory for Language Learning (SILL) for each individual student. Students marked their responses on a 5-point scale indicating how closely the Inventory behavioral statements matched their own behavior. For example, in Category A, Item 5 states “I use flash cards to remember new English words.” A score of 3 indicates that the item is “somewhat true of me” in contrast to a score of 4 indicating “usually true of me” and a score of 2.0 indicating “usually not true of me.” As can be seen in the table, none of the group means exceeded a 3 although Category C (Compensation) came close at 3.89. According to Oxford (1990), a score of 3.5 is a benchmark for identifying strategies that learners are likely to actually use. Therefore, for the group as a whole, learning strategies did not appear to play a major role. In contrast to the group data, the data for each individual student revealed different results. Each student had one or two strategy categories in or near the 4-point range indicating strategies that each usually used. Specifically, Student 1 (4.17) and Student 2 (4.33) were users of Category C (Compensation Strategies). Student 1 also made use of Category E (3.89), which included Affective Strategies. The strategy choices of Student 1, who had a lower TOEFL score, is consistent with the observations of Griffths (2003, 2004), Kimura (2007), and Sundermann and Kroll (2009) that lower ability leaners (due to less working memory capacity) prefer compensation strategies. On the other hand, Student 3, who made the most progress in TOEFL and had the highest TOEFL score, favored Category B (4.64), which includes memory strategies and Category D (4.22), which includes metacognitive strategies. 13.
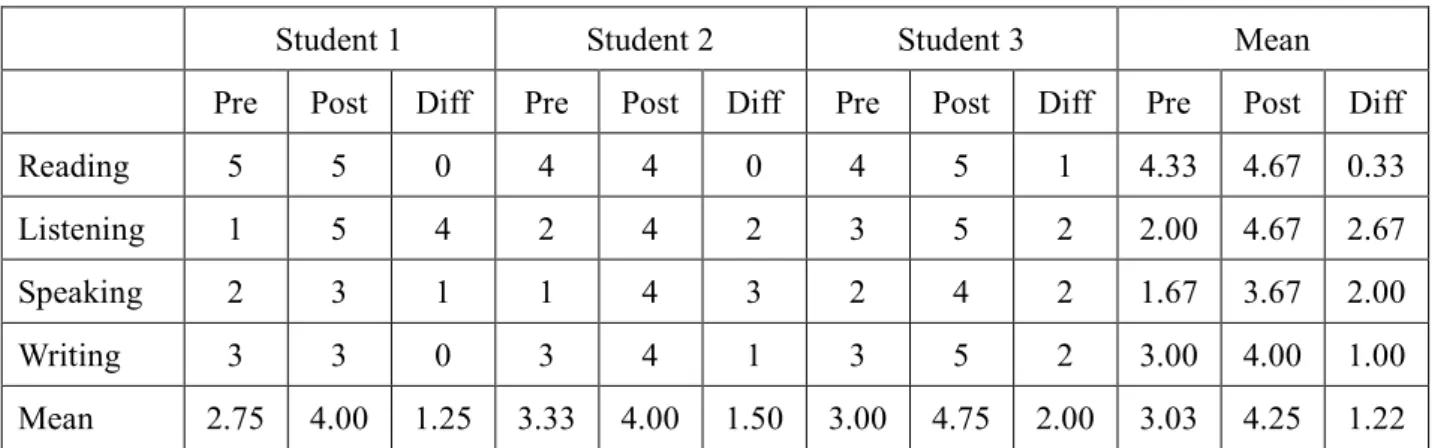
(12) This finding is in contrast to Griffiths (2003), who stated that “higher level students reported highly frequent use of strategies relating to interaction with others, to vocabulary, to reading, to the tolerance of ambiguity, to language systems, to the management of feelings, to the management of learning and to the utilization of available resources” (p. 13). The overall lack of evidence for strategy use among the participants in the present study as well as considerable individual variation make it difficult to draw any conclusions on the effect of language learning strategies on their English ability. Table 4. Results of the Strategy Inventory for Language Learning (SILL). Strategy Category A. B. C. D. E. F. Mean. Student 1. 2.56. 3.29. 4.17. 3.00. 3.83. 4.17. 3.50. Student 2. 2.89. 3.07. 4.33. 2.89. 2.83. 2.67. 3.11. Student 3. 2.44. 4.64. 3.17. 4.22. 2.33. 3.5. 3.39. Mean:. 2.63. 3.67. 3.89. 3.37. 3.00. 3.45. 3.33. Key: A = cognitive strategies; B = memory strategies; C = compensation strategies; D = Metacognitive strategies E = affective strategies; F = social strategies. (2) Scale range: 1 (“Never or almost never true of me”), 2 (“Generally not true of me”), 3 (“Somewhat true of me”), 4 (“Generally true of me”), 5 (“Always or almost always true of me”).. 6.3 Self-Perceived English Ability Before and After Table 5 summarizes the results of the pre-departure and reentry questionnaires regarding the students’ self-perceived English ability (see Appendices I and II). Students marked their responses on a 5-point scale indicating how closely they agreed or disagreed with the statements. Although all the students perceived that their listening ability had improved, Student 2’s TOEFL listening score actually decreased 3 points, which was within the range of statistical error. It may be the case that Student 2 had in mind the spoken English of daily life rather than the academic listening ability required in classes. In contrast, the selfperceived improvement in speaking ability was consistent with their TOEFL Speaking scores. In each case, their actual improvement (2, 4, and 3 points respectively) exceeded the Speaking section SEM of 1.62 points. As for reading ability, one student reported improvement, but the two others reported 14.
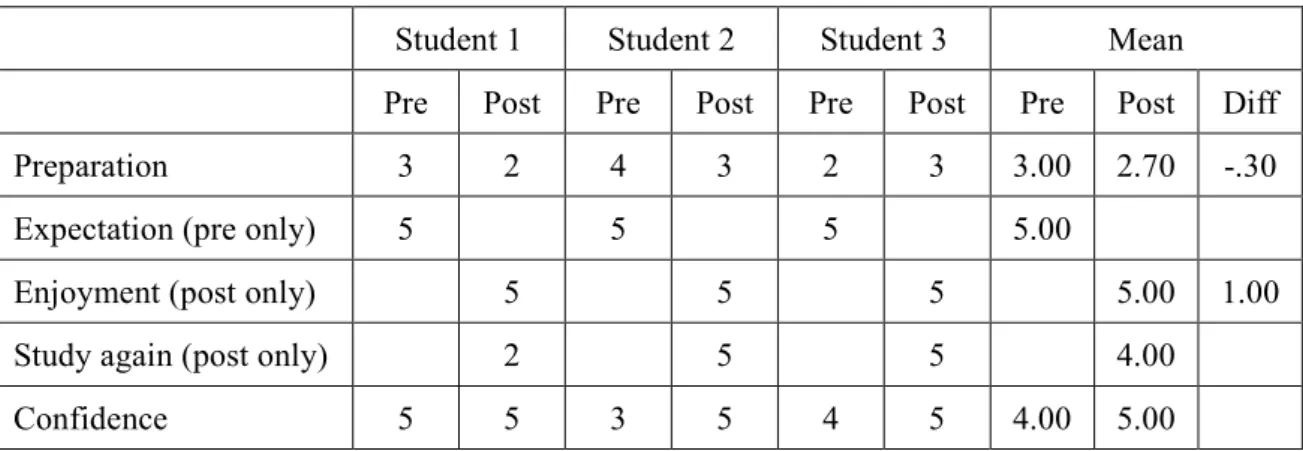
(13) no change. This result may mean that in their minds they had already acquired a certain level of reading skill (level 4 or 5) before studying abroad that was sufficient to cope with their heavy reading load during their study abroad. Student 3, who had the highest TOEFL score and improved the most, also had the highest gain in self-perceived reading ability. Although each student’s Reading score increased, Student 3’s score (4 points) was the only one that exceeded the Reading section SEM of 3.35. This observation is contrary to previous studies (e.g., Freed, 1995) that it is the lower ability learners who tend to improve more. Considering, however, that this student was the most active user of language learning strategies, this result may not be surprising. Student 2 and Student 3 both reported self-perceived improvement in their writing ability, which was consistent with their posttest TOEFL scores, gains of 7 and 9 points respectively. Student 1 did not perceive any improvement although his TOEFL score increased 1 point. However, as the Writing section SEM is 2.76 points, 1 point is not necessarily indicative of actual improvement. Writing is the only section for which all three students’ self-perceived improvement and actual improvement aligned with their posttest TOEFL scores. Table 5. Self-Perceived English Ability Student 1. Student 2. Student 3. Mean. Pre. Post. Diff. Pre. Post. Diff. Pre. Post. Diff. Pre. Post. Diff. Reading. 5. 5. 0. 4. 4. 0. 4. 5. 1. 4.33. 4.67. 0.33. Listening. 1. 5. 4. 2. 4. 2. 3. 5. 2. 2.00. 4.67. 2.67. Speaking. 2. 3. 1. 1. 4. 3. 2. 4. 2. 1.67. 3.67. 2.00. Writing. 3. 3. 0. 3. 4. 1. 3. 5. 2. 3.00. 4.00. 1.00. 2.75. 4.00. 1.25. 3.33. 4.00. 1.50. 3.00. 4.75. 2.00. 3.03. 4.25. 1.22. Mean. Note: The scale ranged from Strongly Agree (5) to Strongly Disagree (1) concerning the following statements: “I can read English well” (Reading). “I can understand spoken English well” (Listening). “I can speak English well” (Speaking). “I can write English well.”. 6.4 Feelings about Studying Abroad Before and After Table 6 summarizes the results of the pre-departure and reentry questionnaires regarding the student’s feelings about studying abroad. As above, the students marked their 15.
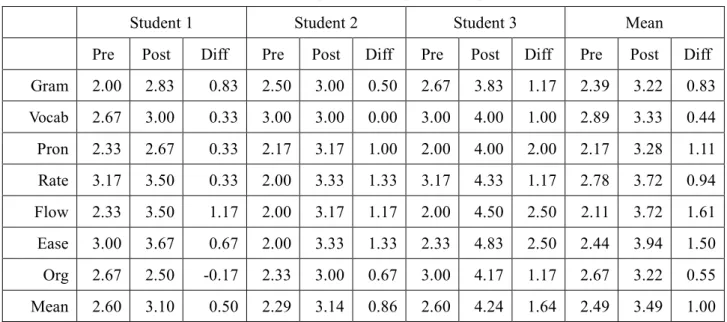
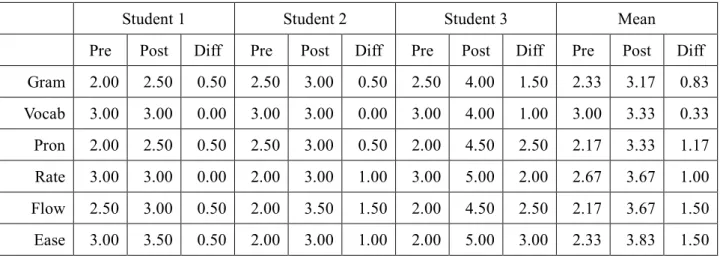
(14) responses on a 5-point scale indicating how closely they agreed or disagreed with the statements (see Appendices I & II). As a group, the students expressed a strong positive attitude toward living and studying abroad. However, scores were lower in how well they felt they had been prepared to study abroad. Informal feedback from the students indicated that living and studying abroad were more difficult than they expected. Nevertheless, they persevered and by the end of their sojourn, they felt positive and confident. Table 6. Feelings about Studying Abroad Student 1. Student 2. Student 3. Mean. Pre. Post. Pre. Post. Pre. Post. Pre. Post. Diff. Preparation. 3. 2. 4. 3. 2. 3. 3.00. 2.70. -.30. Expectation (pre only). 5. 1.00. 5. 5. 5.00. Enjoyment (post only). 5. 5. 5. 5.00. Study again (post only). 2. 5. 5. 4.00. Confidence. 5. 5. 3. 5. 4. 5. 4.00. 5.00. 6.5 Effect of Study Abroad on Speaking Ability Tables 7-1, 7-2, 7-3, and 7-4 compare the results of the pre- and post-interviews. Seven variables were evaluated on a scale of 1 (poor) to 5 (excellent) by two experienced university English teachers, one native English speaker and one Japanese. The iBT Next Generation TOEFL Test Independent Speaking Rubrics (ETS, 2004) and the analysis schemes of Freed, So, and Lazar (2003), Wood (2007), and Yashima and Viswat (1997) were used for reference. The seven variables were grammar, vocabulary, pronunciation, speech rate, flow (rhythm and phrasing), ease of expression (not tense, projection of confidence, etc.), and organization. After consulting the ETS Rubrics and the other analysis schemes, the two raters compared their scoring of two of the nine samples to coordinate their understanding of the evaluation criteria. The results displayed considerable individual differences in speaking ability. While all three students improved one level7 or more on flow, only Students 2 and 3 improved one 7. “Level” is defined here as an increase of 1.00 or more points between the pretest and posttest on the 5-point. 16.
(15) level or more on pronunciation, speech rate, and ease of expression. Only one student (Student 3) improved one level or more on grammar,8 vocabulary, and organization. Student 1’s score on organization actually decreased slightly (-0.17), but not enough to indicate a serious drop in ability. Flow and ease of expression were the criteria with the greatest average gain, perhaps reflecting the positive results of the reentry Self-Perceived English Ability and Feelings about Studying Abroad questionnaires reported above. The gains for Students 2 and 3, whose mean total gains were 0.86 and 1.64 respectively, contrast with Student 1, whose mean total gain was 0.50. This gap may reflect the effort Student 1 put into learning and using Swedish outside of class, in contrast to Students 2 and 3, who reported using English. It is important to note that the amount of English used outside of class was not a variable investigated in this study but could be investigated in future research. According to the European Commission, 89% of Swedes reported that they speak English well enough “in order to be able to have a conversation” (European Commission, 2006. p.12). Table 7-1. Overall Evaluation of Speaking Samples for Topics 1, 2, and 3 (Means) Student 1 Pre. Post. Gram. 2.00. 2.83. Vocab. 2.67. Pron. Student 2 Diff. Student 3. Mean. Pre. Post. Diff. Pre. Post. Diff. Pre. Post. Diff. 0.83. 2.50. 3.00. 0.50. 2.67. 3.83. 1.17. 2.39. 3.22. 0.83. 3.00. 0.33. 3.00. 3.00. 0.00. 3.00. 4.00. 1.00. 2.89. 3.33. 0.44. 2.33. 2.67. 0.33. 2.17. 3.17. 1.00. 2.00. 4.00. 2.00. 2.17. 3.28. 1.11. Rate. 3.17. 3.50. 0.33. 2.00. 3.33. 1.33. 3.17. 4.33. 1.17. 2.78. 3.72. 0.94. Flow. 2.33. 3.50. 1.17. 2.00. 3.17. 1.17. 2.00. 4.50. 2.50. 2.11. 3.72. 1.61. Ease. 3.00. 3.67. 0.67. 2.00. 3.33. 1.33. 2.33. 4.83. 2.50. 2.44. 3.94. 1.50. Org. 2.67. 2.50. -0.17. 2.33. 3.00. 0.67. 3.00. 4.17. 1.17. 2.67. 3.22. 0.55. Mean. 2.60. 3.10. 0.50. 2.29. 3.14. 0.86. 2.60. 4.24. 1.64. 2.49. 3.49. 1.00. Note: Each pre- and posttest score above is the average of the mean scores that appear in Tables 7-2, 7-3, and 7-4 below. The scale ranged from 1 (poor) to 5 (excellent).. scale explained above. 8. Factors affecting lack of improvement in grammar are explained below in the section on writing ability.. 17.
(16) Tables 7-2, 7-3, and 7-4 highlight the degree of variation among the three students for each topic. On Topic 1 (Table 7-2), Student 1 improved one level or more on all seven criteria, and Student 2 improved one level or more on four criteria. In contrast, Student 1 did not improve more than 0.50 on any criteria. Student 3 had the greatest gains (in the 1.00 to 3.00 range) compared to Student 1, whose gains were smaller (in the 0.00 to 0.50 range). The mean score for each student (0.29, 0.71, 1.93 respectively) clearly reflect strong individual variation despite the relatively closeness of their official TOEFL Speaking Test scores (19, 18, 22). On Topic 2 (Table 7-3), the three students showed gains across the board for almost all criteria. Students 1 and 3 improved one level or more on five criteria, and Student 2 improved one level or more on six criteria. The mean scores for each student (1.00, 1.07, and 1.29 respectively) showed less individual variation compared to Topic 1, and again flow and ease of expression on average were the greatest areas of improvement. Student 1 in particular showed strong improvement in his mean score, which increased from 0.29 to 1.00. Topic 2 was “What aspects of Japan such as people, culture, nature, industry, and social system would you like to introduce to foreigners?” In the pretest, Student 1 struggled to come up with something to say. In the posttest, however, he enthusiastically explained in detail with several examples of cross-cultural differences he personally encountered while abroad. This observation reflects that personal connection and prior experience can affect how fluently a speaker can talk about a topic. Thus, the improved performance of Student 1 on this particular question may not necessarily indicate only greater English ability. In oral interviews, it is important to use questions that all the examinees can respond to on an equal footing regardless of background or prior knowledge. Table 7-2. Evaluation of the Speaking Samples for Topic 1 (Why study abroad?) Student 1. Student 2. Student 3. Mean. Pre. Post. Diff. Pre. Post. Diff. Pre. Post. Diff. Pre. Post. Diff. Gram. 2.00. 2.50. 0.50. 2.50. 3.00. 0.50. 2.50. 4.00. 1.50. 2.33. 3.17. 0.83. Vocab. 3.00. 3.00. 0.00. 3.00. 3.00. 0.00. 3.00. 4.00. 1.00. 3.00. 3.33. 0.33. Pron. 2.00. 2.50. 0.50. 2.50. 3.00. 0.50. 2.00. 4.50. 2.50. 2.17. 3.33. 1.17. Rate. 3.00. 3.00. 0.00. 2.00. 3.00. 1.00. 3.00. 5.00. 2.00. 2.67. 3.67. 1.00. Flow. 2.50. 3.00. 0.50. 2.00. 3.50. 1.50. 2.00. 4.50. 2.50. 2.17. 3.67. 1.50. Ease. 3.00. 3.50. 0.50. 2.00. 3.00. 1.00. 2.00. 5.00. 3.00. 2.33. 3.83. 1.50. 18.
(17) Org. 2.00. 2.00. 0.00. 1.50. 2.00. 0.50. 3.00. 4.00. 1.00. 2.17. 2.67. 0.50. Mean. 2.50. 2.79. 0.29. 2.21. 2.93. 0.71. 2.50. 4.43. 1.93. 2.40. 3.38. 0.98. Note: The average score of two raters on a scale of 1-5 (1= poor, 5= excellent).. Table 7-3. Evaluation of the Speaking Samples for Topic 2 (Introduce Japan) Student 1. Student 2. Student 3. Mean. Pre. Post. Diff. Pre. Post. Diff. Pre. Post. Diff. Pre. Post. Diff. Gram. 2.00. 3.00. 1.00. 2.00. 3.00. 1.00. 3.00. 3.50. 0.50. 2.33. 3.17. 0.83. Vocab. 2.00. 3.00. 1.00. 3.00. 3.00. 0.00. 3.00. 4.00. 1.00. 2.67. 3.33. 0.67. Pron. 2.50. 3.50. 1.00. 2.00. 3.50. 1.50. 2.00. 3.50. 1.50. 2.17. 3.50. 1.33. Rate. 3.50. 4.00. 0.50. 2.00. 4.00. 2.00. 3.50. 4.00. 0.50. 3.00. 4.00. 1.00. Flow. 2.00. 4.00. 2.00. 2.00. 3.00. 1.00. 2.00. 5.00. 3.00. 2.00. 4.00. 2.00. Ease. 3.00. 4.00. 1.00. 2.00. 3.00. 1.00. 3.00. 4.50. 1.50. 2.67. 3.83. 1.17. Org. 3.00. 3.50. 0.50. 2.00. 3.00. 1.00. 3.00. 4.00. 1.00. 2.67. 3.50. 0.83. Mean. 2.57. 3.57. 1.00. 2.14. 3.21. 1.07. 2.79. 4.07. 1.29. 2.50. 3.62. 1.12. Note: The average score of two raters on a scale of 1-5 (1= poor, 5= excellent).. Table 7-4. Evaluation of the Speaking Samples for Topic 3 (Money for space exploration) Student 1. Student 2. Student 3. Mean. Pre. Post. Diff. Pre. Post. Diff. Pre. Post. Diff. Pre. Post. Diff. Gram. 2.00. 3.00. 1.00. 3.00. 3.00. 0.00. 2.50. 4.00. 1.50. 2.50. 3.33. 0.83. Vocab. 3.00. 3.00. 0.00. 3.00. 3.00. 0.00. 3.00. 4.00. 1.00. 3.00. 3.33. 0.33. Pron. 2.50. 2.00. -0.50. 2.00. 3.00. 1.00. 2.00. 4.00. 2.00. 2.17. 3.00. 0.83. Rate. 3.00. 3.50. 0.50. 2.00. 3.00. 1.00. 3.00. 4.00. 1.00. 2.67. 3.50. 0.83. Flow. 2.50. 3.50. 1.00. 2.00. 3.00. 1.00. 2.00. 4.00. 2.00. 2.17. 3.50. 1.33. Ease. 3.00. 3.50. 0.50. 2.00. 4.00. 2.00. 2.00. 5.00. 3.00. 2.33. 4.17. 1.83. Org. 3.00. 2.00. -1.00. 3.50. 4.00. 0.50. 3.00. 4.50. 1.50. 3.17. 3.50. 0.33. Mean. 2.71. 2.93. 0.21. 2.50. 3.29. 0.79. 2.50. 4.21. 1.71. 2.57. 3.48. 0.90. Note: The average score of two raters on a scale of 1-5 (1= poor, 5= excellent).. On Topic 3 (Table 7-4), the range in individual variation was evident in the mean scores (0.21, 0.79, 1.71), which were similar to those for Topic 1. Student 3 improved one level or 19.
(18) more on 7 criteria. Student 2 improved one level or more on 4 criteria. Student 1 improved one level or more on only 2 criteria, and his score on organization actually decreased one level. Again, flow and ease of expression were the criteria with the greatest average gains. Student 2 in particular demonstrated remarkable improvements as can be seen in his pre- and post-responses to “Should money be spent on space exploration such as a space station and Japanese Hayabusa Mission? Why or why not?”): Pre-interview I think man money shouldn’t be spent on space exploration such as space station. First, money should be spent on other things for example, wealth, education and so on, in addition to that, I think space exploration don’t give us good evaluate… valuable… things, I think this is the, space exploration is waste of money. Post-interview Some people would say that much money are spent on space exploration now, and it should not be spent such like waste stuff. But, in my opinion, such kind of money should be spent because … for following reasons. First of all, someday, we cannot live in this our planet anymore, and we should go out, and we should live in other planet. In order to do that, we should explore space, and we should find some place where we can live. And second reason, if we explore space, maybe we can find new animal, I think it’s fun, and also we can find new material, and we can make new medicine or technology by exploring space. I think it is really good thing to explore space to improve our technology. For example, if we can find new stuff, new material in other space, in other planet, we can use this material in order to make new medicine, and we can help some people who are suffer from some disease which we cannot cure now. So I think we should spend some money, not much money, but some money, to explore space, and I hope it will help people and it is good things in order to live for long time for us. Tables 8-1, 8-2, and 8-3 compare the results of the pre- and post-interviews on measures of fluency. Eight variables were evaluated: dysfluencies (Wood, 2007), duration (length of time spoken in minutes and seconds), word count per minute, and mean number of syllables 20.
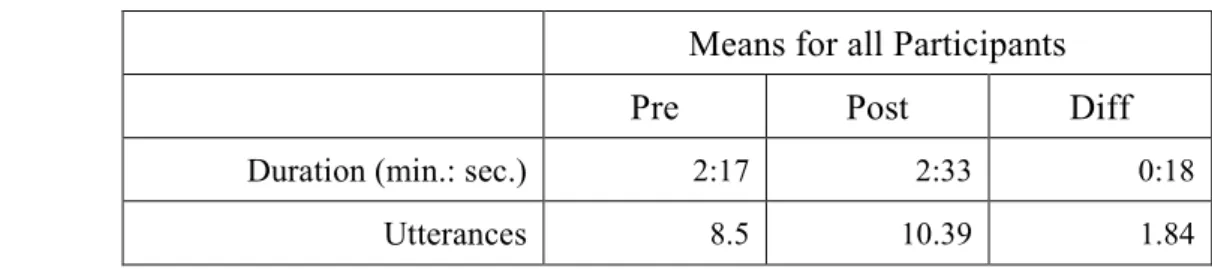
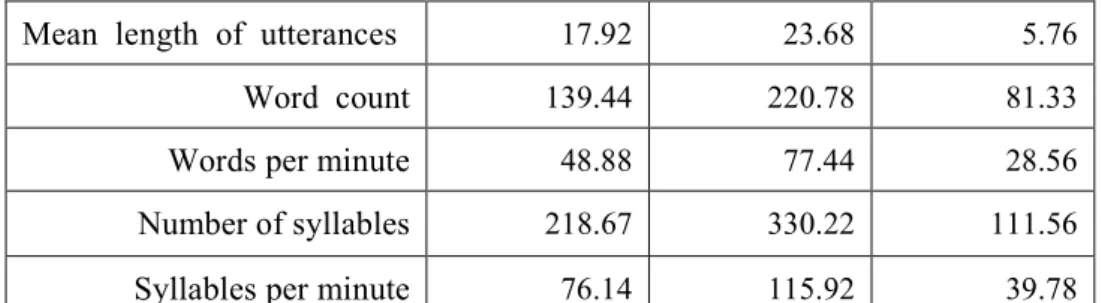
(19) spoken per minute. Dysfluency refers to interruptions in speech such as false starts, hesitations, pauses, repetitions of words or syllables, prolongation of sounds, and insertions of “uh” and other fillers. Fewer dysfluencies indicate greater fluency. Syllable count per minute is included because it is a more objective measure of fluency than words per minute considering that words can have one to five or more syllables. Table 8-1. Mean Number of Words between Dysfluencies for Topics 1, 2, and 3 Student 1. Student 2. Student 3. Mean. Pre. Post. Diff. Pre. Post. Diff. Pre. Post. Diff. Pre. Post. Diff. 9.84. 10.54. 0.70. 3.57. 13.16. 9.59. 4.83. 15.52. 10.69. 6.08. 13.07. 6.99. The results displayed in Table 8-1 showed that each student had fewer dysfluencies in the posttests, indicating greater fluency. However, there was a considerable gap between Student 1, who had a gain of only 0.70 words between dysfluencies, and the other two students, who had gains of 9.30 and 13.08. The mean number of words between dysfluencies showed a striking improvement for Student 2 (from 3.57 to 13.16 words) and Student 3 (from 4.83 to 15.82 words). Table 8-2 shows that overall there was a substantial gain in fluency for the participants as a group. They spoke longer before stopping, and their utterances9 were longer. They spoke at a faster rate of speech, measured as both number of words and number of syllables per minute. Although the number of utterances increased only slightly, they were longer on average by about 30 percent. Fewer dysfluencies combined with longer utterances contribute to a higher assessment of a speaker’s degree of fluency. Table 8-2. Fluency: Combined Data for Topics 1, 2, and 3. Means for all Participants Pre. 9. Post. Diff. Duration (min.: sec.). 2:17. 2:33. 0:18. Utterances. 8.5. 10.39. 1.84. “Utterance” refers to a string of speech bounded by silence, similar to phrases and clauses found in written. text.. 21.
(20) Mean length of utterances. 17.92. 23.68. 5.76. Word count. 139.44. 220.78. 81.33. Words per minute. 48.88. 77.44. 28.56. Number of syllables. 218.67. 330.22. 111.56. Syllables per minute. 76.14. 115.92. 39.78. Table 8-3. Fluency: Combined Data for Topics 1, 2, and 3 (Means). Student 1 Pre. Post. Student 2 Diff. Pre. Post. Student 3 Diff. Pre. Post. Diff. Duration. 3:32. 3:14. -0:18. 1:32. 3:00. 0:39. 1:47. 1:26. -0:21. Word count. 252.67. 246.00. -6.67. 54.67. 188.67. 134.00. 111.00. 227.67. 116.67. WPM. 71.14. 76.10. 4.96. 35.86. 62.89. 27.03. 39.65. 93.34. 53.69. Syllables. 394.67. 370.33. -24.33. 80.33. 271.33. 191.00. 181.00. 349.00. 168.00. Syllables PM. 111.16. 114.47. 3.31. 52.54. 90.44. 37.90. 64.71. 142.84. 78.13. Table 8-3 shows the degree of individual variation in fluency. Student 1 showed minimal gains in only 2 of the 5 categories. In contrast, Students 2 and 3 showed gains in all categories. Among the three participants, Student 2 had the greatest gains in duration (0.39), word count (134.00), and number of syllables (191.00), whereas Student 3 had the greatest gains in words per minute (53.69) and syllables per minute (78.13). Despite the lack of progress in these measures of fluency, Student 1 was able to improve his speaking ability in other ways as indicated in Table 7-3 above. As mentioned above, one explanation for the smaller gains by Student 1 could be that he put more time into studying and using Swedish than the other students, which left less time for English. 6.6 Effect of Study Abroad on Writing Ability The pre-departure and reentry writing samples were evaluated on grammar, vocabulary, expression 10 , organization, fluency and sentence complexity. The iBT Next Generation TOEFL Test Independent Writing Rubrics (ETS, 2008) were used for reference. After 10. In this study, the term “expression” is used to cover the criteria clarity, coherence, facility in the use of. language, and syntactic variety.. 22.
(21) consulting the ETS Rubrics, the two raters compared their scoring on two of the six samples to coordinate their understanding of the rubric criteria. The data represent the average score of the two raters on a scale of 1-5 (1= poor, 5= excellent). Table 9-1. Evaluation of the Writing Samples: Combined Data for Topics 1 and 2 (Means) Student 1. Student 2. Student 3. Mean. Pre. Post. Diff. Pre. Post. Diff. Pre. Post. Diff. Pre. Post. Diff. Gram. 2.75. 2.25. -0.50. 3.75. 3.00. -0.75. 3.50. 3.50. 0.00. 3.33. 2.92. -0.42. Vocab. 2.50. 3.00. 0.50. 3.00. 3.75. 0.75. 3.50. 4.00. 0.50. 3.00. 3.58. 0.58. Expr. 3.75. 3.25. -0.50. 4.00. 4.25. 0.25. 3.50. 5.00. 1.50. 3.75. 4.17. 0.42. Org. 4.25. 3.50. -0.75. 3.75. 5.00. 1.25. 4.50. 4.50. 0.00. 4.17. 4.33. 0.17. Mean. 3.31. 3.00. -0.31. 3.63. 4.00. 0.37. 3.75. 4.25. 0.50. 3.56. 3.75. 0.19. Table 9-1 displays the overall results for each participant for grammar, vocabulary, expression, and organization. Student 1 showed a gain in only one area, in contrast to Students 2 and 3, who made gains in three areas. For all the students, grammar scores dropped or showed no change, in contrast to vocabulary scores, which increased for each student. Little or no improvement in grammar is a common finding in the study abroad research literature (e.g., Freed 1995, 1998a, 1998b; Renna-Suzuki, 2006; Yashima & Viswat, 1997). In a review of this research, Collentine (2009) concluded that grammar tends not to improve because of the “sociocognitive and socio-cultural pressures that learners face in the SA [(study abroad)] context, a situation that sends many more messages to learners than does the AH [(at home)] context as to the complete repertoire of skills and behaviors one needs to be communicatively functional” (Collentine, 2009, p.226). In other words, while studying abroad, learners discover it is often more important to be able to communicate and fit in than to speak and write without making mistakes. As for organization, Student 2 improved the most (1.25 points), more than one rank higher, in contrast to Student 1 (-0.75 points) and Student 3 (0.00), who showed no gain. The largest gain observed in any area by any participant was by Student 3, who gained 1.50 points in expression. Comparing the overall improvement in writing, Student 1 actually showed a slight decrease (-0.31 points), in contrast to Students 2 (0.37 points) and Student 3 (0.50), both of whom moved up one rank (from rank 3 to rank 4) on the 5-point rating scale. 23.
(22) Table 9-2. Evaluation of the Writing Sample Topic 1 (“Describe an event...”) Student 1. Student 2. Student 3. Pre. Post. Diff. Pre. Post. Diff. Pre. Post. Gram. 2.50. 2.00. -0.50. 3.50. 3.00. -0.50. 3.00. 3.50. Vocab. 2.00. 3.00. 1.00. 3.00. 3.50. 0.50. 3.00. Expr. 3.50. 3.00. -0.50. 4.00. 4.50. 0.50. Org. 4.00. 3.00. -1.00. 3.00. 5.00. Mean. 3.00. 2.75. -0.25. 3.38. 4.00. Mean Diff. Pre. Post. Diff. 0.50 3. 2.83. -0.17. 4.00. 1.00 2.67. 3.5. 0.83. 3.50. 5.00. 1.50 3.67. 4.17. 0.50. 2.00. 5.00. 4.00. -1.00 4.00. 4.00. 0.00. 0.63. 3.63. 4.13. 0.50 3.34. 3.63. 0.29. Table 9-3. Evaluation of the Writing Sample Topic 2 (“Japanese companies abroad”) Student 1. Student 2. Student 3. Mean. Gram. 3.00. 2.50. -0.50. 4.00. 3.00. -1.00. 4.00. 3.50. -0.50 3.67. 3.00. -0.67. Vocab. 3.00. 3.00. 0.00. 3.00. 4.00. 1.00. 4.00. 4.00. 0.00 3.33. 3.67. 0.33. Expr. 4.00. 3.50. -0.50. 4.00. 4.00. 0.00. 3.50. 5.00. 1.50 3.83. 4.17. 0.33. Org. 4.50. 4.00. -0.50. 4.50. 5.00. 0.50. 4.00. 5.00. 1.00 4.33. 4.67. 0.33. Mean. 3.63. 3.25. -0.38. 3.88. 4.00. 0.13. 3.88. 4.38. 0.50 3.80. 3.88. 0.08. Tables 9-2 and 9-3 display the individual differences in the writing samples. Student 3, who had the highest post-TOEFL Writing Test score, had the greatest gains in expression and organization. Student 3 was the only one to have a slight gain in grammar. However, this gain was seen only in Topic 1 (0.50) but not in Topic 2 (-0.50), meaning consistent improvement was not demonstrated. Although Students 1 and 2 had identical post-TOEFL Writing Test scores, Student 2 had gains in three categories for Topic 1 (vocabulary, expression, organization) and two categories for Topic 2 (vocabulary, organization). In contrast, Student 1 had gains in only one category for Topic 1 (vocabulary) and no gains for Topic 2. Table 10 displays the results for each participant for fluency and sentence complexity. The writing samples were evaluated on number of words written, number of sentences written, sentence length, number of T-units, and mean T-unit length. Student 1 showed a gain only in two areas (sentence length and T-unit length) and decreased in fluency as measured by the number of words written. Student 2 showed gains in three areas: word count, sentence length, and especially mean sentence length (7.30). Student 3 showed gains in all areas, especially word count. All students showed gains in sentence complexity as measured by mean T-unit 24.
(23) length. Although previous research has found that study abroad tends to have a positive effect on writing fluency (Freed, So, & Lazar, 2003), the results of the present study are inconclusive. Table 10. Writing Fluency and Sentence Complexity: Combined Data for Topics 1 and 2. Means Student 1 Pre Word count. Post. Student 2 Diff. Pre. -15.00 152.00. Post 204.00. Student 3 Diff. Pre. 52.00 151.50. Post. Diff. 220.50. 69.00. 169.50. 154.50. Sentences. 15.00. 11.00. -4.00. 13.50. 11.00. -2.50. 10.00. 13.00. 3.00. Sentence length. 11.35. 13.15. 1.80. 11.20. 18.50. 7.30. 15.30. 16.90. 1.60. T-units. 14.50. 11.00. -3.50. 13.50. 11.00. -2.50. 10.00. 14.00. 4.00. Mean T-unit length. 11.52. 14.03. 2.51. 11.20. 18.44. 7.24. 15.23. 24.16. 8.93. Note: This table displays the means for the pooled data of the pretest and posttest writing samples.. Conclusions This case study examined the impact of study abroad on the English language ability of three Japanese university students who participated in a 10-month study abroad program at an English medium academic program at a university in Sweden. The conclusions for each research question are summarized below. (1) Did the TOEFL scores improve? As explained above, the total scores on average showed a substantial gain of 15 points. More importantly, each participant’s increase in total score exceeded or approached the 98% confidence level, which is a gain equivalent to two SEMs (5.64 x 2 = 11.28 points) according to ETS (2011). However, as noted by Freed, So, and Lazar (2003) and LoCastro (1994) variations in context and individual differences can influence the acquisition of certain linguistic features, making it difficult to draw generalizable conclusions. For example, Student 1 put time and effort into learning and using Swedish, whereas Student 2 focused on using English, yet Student 1’s TOEFL score increased 14 points, whereas Student 2’s score increased 11 points. Nevertheless, all participants showed improvement in English as measured by the TOEFL despite being in a country where English was not the dominant language. Nevertheless, the sample size is too small to be tested for statistical significance as noted above. (2) Was their use of learning strategies while abroad associated with their improvement 25.
(24) in English ability? The total mean score for the participants (Table 4) ranged from 3.11 to 3.50 on the 5-point scale indicating that strategy use on the whole was only “somewhat true” for each participant. As there were only three participants in this study and there was considerable individual variation, the results are inconclusive. Further research with a larger number of participants is needed. (3) Did participants’ self-perception of their English ability change? All participants indicated increases in their self-perceived ability, especially in speaking and listening. Such results are common in the study abroad literature. For example, the findings of the present study are similar to Eguchi’s (2010) finding that “29 out of 30 [university students] thought their overall language skills improved... [reporting]... greater oral skills, such as pronunciation, listening, and communicating rather than grammar, reading, or writing” (Eguchi, 2010, p. 39). Similarly, Sasaki’s (2007) participants also expressed greater confidence and higher motivation, which Sasaki suggested could be attributed to sociocultural factors rather than actual improvement in their writing ability. These sociocultural factors include, for example, being exposed to good role models and making friends with English-speaking classmates. Oral interviews with the three participants in the present study upon their return to Japan suggested that making friends with English-speaking classmates may have contributed to their confidence and higher motivation. In addition, having overcome difficulties adjusting to their sojourn abroad may have made them “more mature as individuals” and “more confident as whole persons” (Sasaki, 2007, p. 615). (4) Did the participants’ feelings about studying abroad change? As a group, the students expressed a strong positive attitude toward living and studying abroad. Although living and studying abroad was more difficult than they expected, by the end of their sojourn, they felt positive and confident. As with self-perception of gains in foreign language ability, such results are common in the study abroad literature (e.g., Dewey, 2007; DuFon & Churchill, 2006). For example, Chieffo and Griffiths (2004) reported “the data clearly demonstrate that the students who spent the month abroad were more confident in their levels of intercultural awareness and functional knowledge than their peers who remained on campus. Additionally, they engaged in more internationally-minded activities” (Chieffo & Griffiths, 2004, p. 174). (5) Did the participants’ speaking ability improve? As measured by TOEFL, all the students improved. However, the speaking samples collected specifically for this study showed considerable individual variation, indicating the existence of areas where each 26.
(25) participant’s speaking ability did or did not improve. Among the five criteria investigated, only flow and ease of expression were the ones where all three participants showed consistent improvement. (6) Did the participants’ writing ability improve? As measured by TOEFL, only two participants improved. The writing samples collected specifically for this study illustrated in detail in which areas each participants’ writing ability did or did not improve. As with speaking, there was considerable individual variation. Among the seven criteria investigated, only sentence complexity showed gains for all three participants. Overall, the findings above suggest that study abroad in an English-medium academic program in a country where English is not the dominant language can have positive objective and subjective outcomes on English language learning, but it must be noted that positive outcomes were not observed in all learners in all skill areas. What other researchers have found about the impact of study abroad where the dominant language of the country and the language of the study abroad program are different also applies to this situation, but further research with more participants is needed.. Limitations and Future Research Local language vs. English in daily life. As noted above, the amount of English used outside of class in daily life was not a variable investigated in this study. Because the participants were studying in a country where English was not the dominant language, it is important to consider how this variable could have affected the development of their English ability. Future research also needs to consider possible differences in studying in Englishmedium programs in countries where a larger percentage of the population speak English as a second or foreign language (e.g., Sweden 89%, the Netherlands 87%) with countries where fewer people do (e.g., France 36%, Italy 29%) (European Commission, 2006). Speech and Writing Samples. The participants’ performance on the independent speech and writing samples may have been influenced by their personal experiences or background knowledge of the topics. This variable might have biased the results. Performance on a particular question is a reflection of more than simply English ability. Future research could explore whether requiring all participants to respond to the same questions or giving them the option of choosing which questions to answer affects the quality of their performance. 27.
(26) Another issue to investigate is what may account for discrepancies in the TOEFL writing scores versus the independently assessed speaking and writing assessments. Interval between pretests and posttests. The interval between the TOEFL pretests and posttests were different for each participant: 14, 17, and 21 months. Ideally, the intervals would all have been the same, but as explained above in section 6.1, this variation may not have affected the results. Nevertheless, there is a possibility that it could have had some effect. Language Learning Strategies. This study surveyed the three participants to find out which language learning strategies they used, but the small sample size did not allow for generalizations about which strategies associated with better or worse results. Future research, with a larger sample size, could compare groups of students using different strategies with a control group to investigate which strategies are associated with a positive effect on TOEFL performance.. Acknowledgments The author would like to thank Professor Melvin Andrade for helping score the speech and writing samples and assisting with editing the English manuscript. In addition, I am grateful to the anonymous reviewers for their valuable advice and helpful comments. References American Exam Services. (2014). TOEFL scores: USA Universities. Retrieved March 20, 2016 from http://www.americanexamservices.com/about-the-toefl/toefl-scores-usa -universities Callen, B. (1999). Cross-cultural capability: The student-diary as a research tool. In D. Killick and M. Parry (Eds.) Languages for Cross-Cultural Capability. Promoting the Discipline: Marking Boundaries & Crossing Borders, (pp. 241-248). UK: Leeds Metropolitan University. Chieffo, L., & Griffiths, L. (2004). Large-scale assessment of student attitudes after a short-term study abroad program. Frontiers: The Interdisciplinary Journal of Study Abroad, 10, 165-177. Collentine, J. (2009). Study abroad research: Findings, implications, and future directions. In M. H. Long & C. J. Doughty (Eds.), The Handbook of Language Teaching, (pp. 21828.
(27) 233). Malden, MA: Blackwell. Dewey, D. P. (2007, Oct.) Language learning during study abroad: What we know and what we have yet to Learn. Japanese Language and Literature, 41(2), 245-269. DuFon, M. A. & Churchill, E. (Eds.) (2006). Language Learners in Study Abroad Contexts. Clevedon, UK: Multilingual Matters. Educational Testing Service. (n.d.) TOEFL ITP: Reliability and SEM. TOEFL ITP. Retrieved from https://www.ets.org/s/toefl_itp/pdf/toefl_itp_score.pdf Educational Testing Service. (2004). iBT Next Generation TOEFL Test Independent Speaking Rubrics. (Scoring. Standards).. Retrieved. from. https://www.ets.org/Media/Tests/TOEFL/pdf/Speaking_Rubrics.pdf Educational Testing Service. (2005). Setting the Final Cut Scores. Retrieved from https://www.ets.org/Media/Tests/TOEFL/pdf/setting_final_scores.pdf Educational Testing Service. (2008). iBT Next Generation TOEFL Test Independent Writing Rubrics (Scoring Standards). Retrieved from https://www.ets.org/Media/Tests/TOEFL /pdf /Writing_Rubrics.pdf Educational Testing Service. (2011). Reliability and Comparability of TOEFL iBT Scores. Insight, 1(3). Retrieved from https://www.ets.org/s/toefl/pdf/toefl_ibt_research_s1v3.pdf Eguchi, H. (2010). The effects of a short-term overseas English Program for Hokusei Gakuen University English department students. Hokusei Ronshu, 47(2), 33-49. Ellis, R. (1994). The study of second language acquisition. Oxford: Oxford University Press. European Commission. (2006). Europeans and their Languages. Special Eurobarometer, 243. Retrieved from http://ec.europa.eu/public_opinion/archives/ebs/ebs_243_en.pdf European Commission. (2016, March 18). Higher education in Europe: What language can I study. in?. Retrieved. from. http://ec.europa.eu/education/study-in-europe/planning. -studies/european-higher-education_en.htm Freed, B. (1995). What makes us think that students who study abroad become fluent? In B. F. Freed, Second language acquisition in a study abroad context, (pp. 123-148). Philadelphia: John Benjamins. Freed, B. (1998a). An overview of issues and research in language learning in a study abroad setting. Frontiers: The Interdisciplinary Journal of Study Abroad, 4(4), 31-60. Freed, B. (1998b). Introduction (Special issue on language learning in a study abroad context). Frontiers: The Interdisciplinary Journal of Study Abroad. 4(4), iv-viii. 29.
(28) Freed, B., So, S., & Lazar, N. (2003). Language learning abroad: How do gains in written fluency compare with gains in oral fluency in French as a second language? ADFL Bulletin, 3, 34-40. Retrieved from http://www.adfl.org/bulletin/V34N3/343034.htm Griffiths, C. (2003). Patterns of language learning strategy use. System, 31, 367-383. Griffiths, C. (2004). Language Learning Strategies: Theory and Research. Occasional Paper No. 1 (School of Foundations Studies. AIS St Helens, Auckland, New Zealand). Retrieved from http://crie.org.nz/research-papers/c_griffiths_op1.pdf Japan Study Support: University Degree Courses in English. (n.d.). Retrieved Dec. 12, 2015 from http://www.jpss.jp/en/univ/english/ Kimura, K. (2007). The influence of staying abroad on learning strategies. Shobi Gakuen University Bulletin of Policy and Management, 13, 1-12. Kohro, Y. (2001). A pilot study of the linguistic impact of study abroad experiences on the writing of Japanese college ESL learners in America. JACET Bulletin, 33, 57-72. LoCastro, V. (1994). Language learning strategies and learning environments. TESOL Quarterly, 28(2), 409-414. Matsumoto, K. (2011). The effect of motivation and proficiency on strategy use of Japanese university students (Master’s thesis). Retrieved from Soka University Repository, Vol. 33. Retrieved from http://libir.soka.ac.jp/dspace/bitstream/10911/3530/1/dk33-381.pdf Ministry of Education, Culture, Sports, Science and Technology. (2015). Global 30 Course List.. Retrieved. March. 20,. 2016. from. https://www.uni.international.mext.go.jp/documents/g30courses.pdf Ministry of Education, Culture, Sports, Science and Technology. (2016). Top 13 universities in Japan offering degree programs in English. Retrieved March 20, 2016 from http://www.uni.international.mext.go.jp. Morita, M. (2010). How does a short term study abroad influence language learning strategies? Faculty of Literature & Social Sciences, Yamagata University Annual Research Report, 7, 23-36. Okamoto, D. (2002). Summer intensive English study abroad program 2001: A case study. Journal of Aomori Public College, 7(2), 2-23. Oxford, R. L. (1990). Language learning strategies: What every teacher should know. Boston: Heinle & Heinle. Oxford, R. (1994, October). Language Learning Strategies: An Update. Retrieved from 30.
(29) http://www.ericdigests.org/1995-2/update.htm Oxford, R. L., Shishido, M., & Ban, N. (1994). Gengo gakushuu sutorateji: gaikokugo kyoushi ga shitte okanakereba naranai koto [Language learning strategies: What every teacher should know]. Tokyo: Bonjinsha. Paige, M., Cohen, A. D., & Shively, R. (2004). Assessing the impact of a strategies-based curriculum on language and culture learning abroad. Frontiers: The Interdisciplinary Journal of Study Abroad, 10, 253-276. Renna-Suzuki, O. (2006). The effects of a study-abroad program on English proficiency and intercultural adaptability: A re-examination of a short-term study-abroad program in Australia. The Bulletin of St. Margaret's Junior College, 38, 37-47. Sasaki, M. (2007). Effects of study-abroad experiences on EFL writers: A multiple-data analysis Modern Language Journal, 91(4), 602-620. Study abroad: Where to study in Europe... in English (2012, August 3), The Telegraph (UK). Retrieved. from. http://www.telegraph.co.uk/education/universityeducation/9447458. /Study-abroad-Where-to-study-in-Europe...-in-English.html Sundermann, G., & Kroll, J. (2009). When study-abroad experience fails to deliver: The internal resources threshold effect. Applied Psycholinguistics, 30(1), 79-99. Takeda, A. (1998). A study of learning motivation and learning strategies in the Overseas English Training Program. Bulletin of Mukogawa Women’s University. Humanities and Social Sciences, 46, 11-18. Tanaka, K., & Ellis, R. (2003). Study-abroad, language proficiency, and learner beliefs about language learning. JALT Journal, 25(1), 63-85. Wood, D. (2007). Mastering the English formula: Fluency development of Japanese learners in a study abroad context. JALT Journal, 29(2), 209-230. Yashima, T., & Viswat, L. (1997). Acquisition of “fluency” in L2 through an overseas study program. JACET Bulletin, 28, 193-206. Yokohama National University. (2016). All-English Programs. Retrieved March 20, 2016 from http://www.ynu.ac.jp/english/exam/allenglish.html.. 31.
(30) Appendix I Pre-Departure Questionnaire To help us understand the students in our Study Abroad Program and to provide better assistance to them in the future, we would appreciate it if you could answer a few questions about your English ability and feelings about studying abroad. This data will be combined with the data of other students and be part of a research report, but your name and personal information will be kept private. Thank you very much for your cooperation. Your participation will be a big help to us. Name:. Today’s date:. Age: Year in school:. Major:. TOEFL score: R_____L_____S_____W_____Total_______. Date taken:. ********************************************************************************. Instruction: Circle the number that best expresses your opinion according to the following scale: Strongly agree. 5. 4. 3. 2. 1. Strongly disagree. Your opinion of your English ability: 1. I can read English well.. 5. 4. 3. 2. 1. 2. I can understand spoken English well.. 5. 4. 3. 2. 1. 3. I can speak English well.. 5. 4. 3. 2. 1. 4. I can write English well.. 5. 4. 3. 2. 1. 5. I am well prepared to study abroad.. 5. 4. 3. 2. 1. 6. I am looking forward to studying abroad.. 5. 4. 3. 2. 1. 7. I have confidence in my ability to live in a. 5. 4. 3. 2. 1. Your feeling about studying abroad:. foreign country.. 32.
(31) Appendix II Reentry Questionnaire To help us understand the students in our Study Abroad Program and to provide better assistance to them in the future, we would appreciate it if you could answer a few questions about your English ability and feelings about studying abroad. This data will be combined with the data of other students and be part of a research report, but your name and personal information will be kept private. Thank you very much for your cooperation. Your participation will be a big help to us. Name: TOEFL score:. Today’s date: R_____L_____S_____W_____Total_______. Date taken:. Date you returned to Japan: **************************************************************************. Instructions: Circle the number that best expresses your opinion according to the following scale: Strongly agree. 5. 4. 3. 2. 1. Strongly disagree. Your opinion of your English ability after returning to Japan: 1.. I can read English well.. 5. 4. 3. 2. 1. 2.. I can understand spoken English well.. 5. 4. 3. 2. 1. 3.. I can speak English well.. 5. 4. 3. 2. 1. 4.. I can write English well.. 5. 4. 3. 2. 1. 5. 4. 3. 2. 1. 6a. I enjoyed studying abroad.. 5. 4. 3. 2. 1. 6b. I would like to study abroad again if possible.. 5. 4. 3. 2. 1. 7.. 5. 4. 3. 2. 1. Your feeling about studying abroad after returning to Japan: 5.. I was well prepared to study abroad.. I have confidence in my ability to live in a foreign country.. **************************************************************************. Please explain below how you have studied English since returning to Japan:. 33.
(32)
図


+7

関連したドキュメント
It turned out that there was little need for writing in Japanese, and writing as They-code (Gumpers 1982 ) other than those who work in Japanese language was not verified.
The number of international students at Kanazawa University is increasing every year, and the necessity of improving the international students' Japanese writing skills,
熱力学計算によれば、この地下水中において安定なのは FeSe 2 (cr)で、Se 濃度はこの固相の 溶解度である 10 -9 ~10 -8 mol dm
Results indicated three key findings: seventy percent of university students who had an Instagram account were using the account during the study; the level of life satisfaction
静岡大学 静岡キャンパス 静岡大学 浜松キャンパス 静岡県立大学 静岡県立大学短期大学部 東海大学 清水キャンパス
The fact that Japanese links inclusion and partial inclusion is hardly evidence that the IN/ON continuum is deeply relevant, since functional considerations naturally link the
静岡大学 静岡キャンパス 静岡大学 浜松キャンパス 静岡県立大学 静岡県立大学短期大学部 東海大学 清水キャンパス
[r]
