Obligations
journal or
publication title
International review of business
number
17
page range
61-86
year
2017-03
1. Introduction
In January 2016, the Policy Board of the Bank of Japan introduced its policy of Introduction of “Quantitative and Qualitative Monetary Easing with a Negative Interest Rate” (QQE with a Negative Interest Rate) in order to achieve price stability. Under the policy, the Bank would pursue monetary easing with consideration of three dimensions: quantity, quality, and interest rate. One of these dimensions, the interest rate, applies a negative interest rate of -0.1% to current accounts that financial institutions hold at the Bank. The adoption of a negative interest rate affects the Japanese Yen London Interbank Offered Rate (JPY LIBOR) and interest rates on Japanese government bonds. Recently, these have also become negative.
The Japanese accounting standard for retirement benefits, ASBJ Statement No.26: Accounting Standard for Retirement Benefits (ASBJ Statement 26), states that the discount
Eriko KASAOKA*
Abstract
In January 2016, the Policy Board of the Bank of Japan introduced its policy of Introduction of “Quantitative and Qualitative Monetary Easing with
a Negative Interest Rate”in order to achieve price stability. Under the policy, the Bank would pursue monetary easing with consideration of three dimensions: quantity, quality, and interest rate. One of the dimensions, the interest rate, applies a negative interest rate of -0.1% to current accounts that financial institutions hold at the Bank. The adoption of a negative interest rate affects the Japanese Yen London Interbank Offered Rate and interest rates on Japanese government bonds; recently, these have also become negative. In accordance with the introduction of the policy, the Accounting Standards Board of Japan discussed the adoption of a negative interest rate for a discount rate to calculate defined benefit obligations, and decided to allow firms to adopt a negative discount rate based on yields on safe and secure long bonds or set a lower limit of 0%. Changes in the discount rate have a significant effect on the amount of defined benefit obligations. Therefore, the aim of this paper is to investigate the effect of changes in discount rates on financial statements with specific attention to the impact of negative interest rates on the calculation of defined benefit obligations.
Keywords: Negative interest rate, Discount rate, Defined benefit obligations, Actuarial gains and losses
rate on defined benefit plans shall be determined based on yields on safe and secure long bonds. These include government bonds, government agency securities, and high-grade corporate bonds (ASBJ Statement 26, par.20). Kasaoka (2014) shows that the average discount rate Japanese firms adopt is linked to yields on 10- to 20-year Japanese government bonds. Responding to the introduction of QQE with a Negative Interest Rate, the Accounting Standards Board of Japan (ASBJ) discussed the adoption of a negative interest rate for a discount rate and issued the summary of the proceedings, “An Exhibit of ASBJ Proceedings Summary (Remit (4) Response to an Accounting Issue on a Negative Interest Rate)” (ASBJ proceedings summary) in March 2016. The Board mentions that it would be necessary to have further discussion; however, as of the accounting period for fiscal 2015, the rules allow firms to adopt a negative discount rate based on yields on safe and secure long bonds, or set a lower limit of 0% (ASBJ proceedings summary, Discussion). Changes in the discount rate have a significant effect on the amount of defined benefit obligations. In association with the decrease of yields on Japanese government bonds, Japanese firms tend to decrease their discount rates, which lead to an increase of defined benefit obligations for fiscal 2015. Several firms have adopted negative discount rates for their defined benefit plans. The aims of this paper are therefore twofold. First, it is to investigate whether there is an effect on financial statements from changes in discount rates, with specific attention to the impact of negative interest rates on the calculation of defined benefit obligations. Second, it is to determine whether firms with discount rates of 0% or less display different tendencies in various financial statement items — including defined benefit plan items — than those with rates of more than 0%, because of the potential negative impact of a decline in discount rates on their financial statements.
2. Quantitative and Qualitative Monetary Easing with a Negative Interest Rate
The Policy Board of the Bank of Japan introduced in April 2013 the first QQE, Introduction of “Quantitative and Qualitative Monetary Easing” (The first QQE) to raise the consumer price index at a 2% annual rate with a goal of price stability. The main purpose of monetary policy is to control real interest rates at a proper level to promote sustainable economic growth, and lower the rate of unemployment. Japanese interest rates have been close to 0% due to the long recession and deflation.1 To increase real interestrates, the policy calls for (a) adopting “monetary base control” instead of the uncollateralized overnight call rate as a main operating target for money market operations, and (b) purchasing Japanese government bonds, exchange-traded funds, and Japan real estate
1 Harada, Y. (2016). “The Policy Intention and the Effects of Negative Interest Rate,” Kigyo Kaikei, Vol.68, No.10, pp.1320-1321.
investment trusts at a certain annual pace within certain guidelines (The first QQE, par.1. (1)). In October 2014, the Board also issued Expansion of the Quantitative and Qualitative Monetary Easing, which states the Board’s intention to accelerate the pace of increase in the monetary base and increase these asset purchases.
QQE with a Negative Interest Rate was introduced in January 2016 based on the same goal, (i.e., price stability) as the QQEs issued in 2013 and 2014 by the Policy Board of the Bank of Japan. The policy has three dimensions for pursuing monetary easing; quantity, quality, and interest rates. The quantity dimension entails increasing the monetary base at an annual pace of about 80 trillion yen for money market operations (QQE with a Negative Interest Rate, par.1.(2)). The quality dimension comprises purchasing Japanese government bonds, exchange-traded funds, Japan real estate investment trusts, CP, and corporate bonds at a certain annual pace within certain guidelines to increase these asset amounts (QQE with a Negative Interest Rate, par.1.(3)). The interest rate applies a negative interest rate of -0.1% to current accounts that financial institutions hold at the Bank. It has been effective since February 16, 2016 (QQE with a Negative Interest Rate, par.1.(1)). The JPY LIBOR and interest rates on Japanese government bonds have become negative owing to the adoption of a negative interest rate.
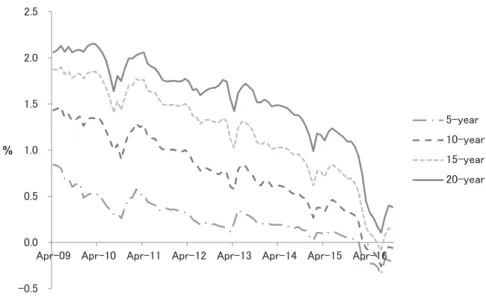
Figure 1 shows the average monthly interest rates on 5-, 10-, 15-, and 20-year government bonds from 2009, the year firms were required to review their discount rates annually, through the latest year, 2016, for which data are available. The Ministry of
Figure 1. Monthly Interest Rates on Government Bonds from 2009 to 2016
Source: Ministry of Finance Japan, “Interest Rate,” http://www.mof.go.jp/ english/jgbs/reference/interest_rate/index.htm.
Finance Japan defines the interest rate as “a semiannual compound interest rate on a constant maturity basis calculated on prevailing prices of fixed income Japanese government bonds in the secondary market at the market closing time”.2
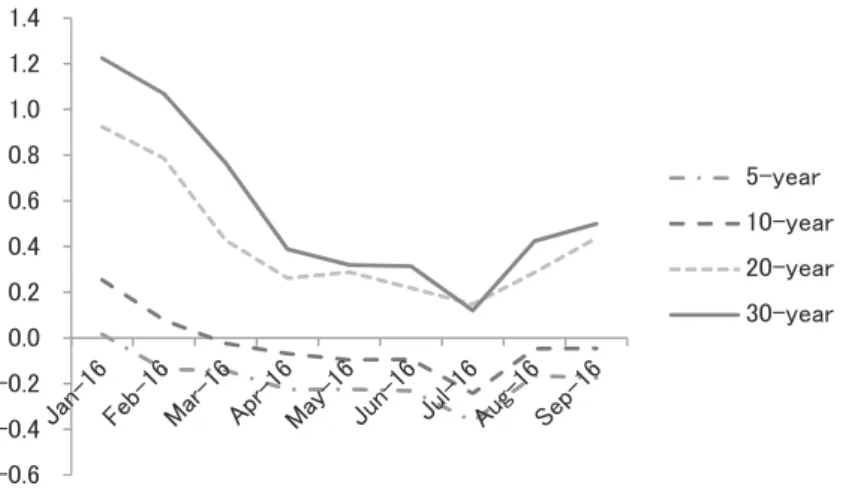
The figure indicates that average interest rates on all government bonds have decreased since April 2009. Recently, average interest rates on 5-, 10-, and 15-year government bonds have become negative. The detail of the recent movement in rates may be seen in Figure 2, which shows daily rates on government bonds from January to September 2016. The figure shows that interest rates on 5- and 10-year government bonds became negative in February 2016. The introduction of QQE with a Negative Interest Rate must have had a significant effect on the movement of interest rates on government bonds. There is a possibility that several firms have adopted negative discount rates to calculate defined benefit obligations in accordance with the interest rates on government bonds.
Recently Japan’s economy has been on track to recovery, cycling positively from income to spending in both the household and corporate sectors. However, there are several risks that might have negative effects on the underlying trend in inflation, such as the decline in crude oil prices and uncertainty in emerging and commodity-exporting economies, especially
Figure 2. Daily Interest Rates on Government Bonds from January to September 2016
Source: Ministry of Finance Japan, “Interest Rate,” http://www.mof.go.jp/ english/jgbs/reference/interest_rate/index.htm.
2 Ministry of Finance Japan, “Interest Rate (Q&A),” http://www.mof.go.jp/english/jgbs/reference/interest_ rate/qa.htm.
the Chinese economy. QQE with a Negative Interest Rate was introduced to preempt these risks, as well as to improve business confidence and reverse a deflationary mindset (QQE with a Negative Interest Rate, par.2). It is intended to promote corporate capital investment and increase bank loan demand.3
3. Setting Rules for Discount Rates
3.1 The Requirements of Setting a Discount Rate
ASBJ Statement 26 requires firms to determine the discount rate on defined benefit plans based on yields on safe and secure long bonds. These bonds include government bonds, government agency securities, and high-grade corporate bonds (ASBJ Statement 26, par.20). ASBJ Guidance No. 25: Guidance on Accounting Standard for Retirement Benefits (ASBJ Guidance 25) states that high-grade corporate bonds are bonds assigned an AA rating or better by several credit-rating agencies (ASBJ Guidance 25, par.24).4
The Guidance also states that discount rates have to reflect the estimated remaining period of each retirement benefit payment. To discount the estimated defined benefit obligations to present value, a firm can use (a) a single weighted average discount rate calculated based on the estimated remaining period and the amounts of each retirement benefit payment, or (b) multiple discount rates based on the estimated remaining period of each benefit payment (ASBJ Guidance 25, par.24). Guidance for Mathematical Practice on Accounting Standards for Retirement Benefits (Guidance for Mathematical Practice), which aims to provide reliable information on retirement benefits to users, states that it is important to take into account a yield curve when a firm determines the discount rate in accordance with paragraph 24 in ASBJ Guidance 25 (Guidance for Mathematical Practice, par.3.2).5
ASBJ Guidance 25 allows firms to adopt the principle of changes in discount rate, an approach for determining whether a firm revises the discount rate or not. The guidance states the discount rate is required to be revised when defined benefit obligations as measured using a discount rate at the end of the year are compared to those at the end of the previous year, and this amount exceeds 10% of the previous year’s obligations (ASBJ Guidance 25, par.30). Therefore, a firm does not have to change the discount rate when such a change would not have a significant effect on the amount of defined benefit
3 Harada, Y. (2016). op. cit., p.1322.
4 ASBJ states that a discount rate should reflect only the time value of money. Therefore, the rate shall be close to a risk-free rate (ASBJ Guidance 25, par.95).
5 The Guidance for Mathematical Practice defines the yield curve as a curve representing several yields on discount bonds with different period lengths. To estimate the yield curve, a firm (1) selects a universe of market data on corporate and government bonds, and (2) adopts a well-known model such as Nelson-Siegel or Svenson (Guidance for Mathematical Practice, par.3.2.1).
obligations.
When a firm changes the discount rate, actuarial gains and losses occur. The actuarial gains and losses are caused by (a) a difference between the actual return on plan assets during a period and the expected return on plan assets for that period, (b) a difference between the actual rate in calculating defined benefit obligations during a period and the estimated rate for that period, and (c) a modification of estimated rates (ASBJ Statement 26, par.11). Changes in discount rates are classified into item (c). The actuarial gains and losses are recognized as a component of defined benefit cost and can be recognized over the average remaining service years of employees. Actuarial gains and losses not recognized in the period are shown as unrecognized actuarial gain or loss in other comprehensive income in net assets (ASBJ Statement 26, par.24). A decrease in a discount rate increases the amounts of defined benefit obligations and defined benefit cost.
3.2 The Treatment for a Negative Interest Rate
In response to the issuance of the policy of QQE with a Negative Interest Rate, ASBJ discussed in March 2016 the determination of a discount rate for the calculation of defined benefit obligations. The board issued ASBJ proceedings summary. The main issue of the discussion was, when yields on government bonds are negative, whether a firm should (a) adopt a negative discount rate, (b) set a lower limit of 0%, or (c) adopt a positive rate.
The ASBJ proceedings summary indicates several reasons for supporting each alternative. The reasons for allowing adoption of a negative interest rate are as follows (ASBJ proceedings summary, Discussion):
(a) ASBJ Statement 26 indicates that a firm should determine the discount rate based on the market yields at the end of the year.
(b) The discount rate basically should reflect the time value of money. There is no reason to change the treatment depending on whether government yields are negative or positive.
(c) The amount of defined benefit obligations is the estimated amount that has accrued by the end of the period. The amount can be more than the amount that would be paid at the end of the period.
(d) ASBJ Guidance 25 states that the discount rate should reflect the expected payment period of each retirement benefit (ASBJ Guidance 25, par.24). It is not rational to set the discount rate to 0% for the period when yields on government bonds are negative.
(e) It is not necessary for the discount rate to reflect a rate of return on plan assets; however, the fair value of plan assets at the end of the year usually includes the effect of a negative interest rate. If a firm uses a discount rate set to a lower limit
of 0%, there might be an inconsistency in measurements between assets and liabilities. On the other hand, there are several reasons that support setting the discount rate to a lower limit of 0%, as follows (ASBJ proceedings summary, Discussion):
(a) There is a possibility that a firm will manage plan assets with cash or other financial assets that yield some amount of interest when the yield on a financial asset which it currently invests in becomes negative. It is not necessary to recognize the amount of defined benefit obligations above the level the firm provides to employees at the end of the year.
(b) The system used to calculate the amount of defined benefit obligations might not have a function to calculate amounts based on a negative discount rate.
ASBJ mentions that it would be more consistent for a firm to adopt a negative interest rate when the firm refers to yields on government bonds, which was a main point of ASBJ discussions in the past. However, the board requires further discussion to present its viewpoint on the treatment of a negative interest rate (ASBJ proceedings summary, Discussion).
There are several countries — including Switzerland, Denmark, Germany, and Sweden — which have government bonds with negative interest rates. Given their existence, the IFRS Interpretations Committee has discussed the issue of negative interest rates, but only in International Accounting Standard No.39: Financial Instruments: Recognition and Measurement (IAS39).6 Other accounting standards on retirement benefits including
International Accounting Standard No.19: Employee Benefits (IAS19) and Statement of Financial Accounting Standards No.158: Employers’ Accounting for Defined Benefit Pension and Other Postretirement Plans (SFAS158) do not consider negative interest rates. Also, IAS19 states that a firm shall determine the discount rate by reference to market yields on high quality corporate bonds at the end of the reporting period. If there is no deep market for these bonds, it has to use the market yields on government bonds (IAS19, par.83). Therefore, the situation would be different from that of firms adopting Japanese accounting standards. The rules in the various international accounting standards are also part of the reason why ASBJ decided to allow firms to adopt either a negative interest rate or 0% for fiscal year 2015, given that there is no discussion in international standards pertaining to the case in which yields on government and corporate bonds become negative (ASBJ
6 IFRS Interpretations Committee (2015). Agenda Paper (January), “IAS 39 Financial Instruments:
Recognition and Measurement—Negative interest rates: implication for presentation in the statement of comprehensive income” IFRS Interpretations Committee Meeting (Agenda ref 4). IFRS Interpretations Committee (2016). Agenda Paper (January), “IAS 39 Financial Instruments: Recognition and
Measurement—Separation of an embedded floor from a floating rate host contract in a negative interest rate environment” IFRS Interpretations Committee Meeting (Agenda ref 3).
Figure 3. Yields on Government Bonds from January to September 2016
Source: Ministry of Finance Japan, “Bid Results on Government Bonds,” http://www.mof.go.jp/jgbs/reference/appendix/index.htm.
proceedings summary, Discussion).
4. The Effect of Changes in Discount Rates on Defined Benefit Plan Items
4.1 Discount Rates Japanese Firms Adopt
In accordance with the adoption of QQE with a Negative Interest Rate, the JPY LIBOR and interest rates on Japanese government bonds have become negative. Yields on government bonds also have become negative. Figure 3 shows yields to subscribers of government bonds from January to September 2016. As explained above, Kasaoka (2014) shows that Japanese firms tend to choose their discount rates based on yields on 10- to 20-year government bonds. Therefore, several firms might choose 0% or negative interest rates as their discount rates in fiscal 2015.
Figure 4 shows the range of discount rates Japanese firms adopt from fiscal 2009 to 2015. Firms adopting Japanese accounting standards on retirement benefits are selected. Firms that have been excluded are those either (a) are in the finance industry, (b) had accounting periods of less than 12 months, or (c) did not disclose discount rates or the amount of defined benefit obligations. The numbers of sample firms from fiscal 2009 to 2015 are 1,821, 1,824, 1,826, 1,842, 1,849, 1,854, and 1,859, respectively. This paper aims to investigate the effect of changes in discount rates on financial statements with specific attention to the impact of negative interest rates. Therefore, when a firm indicates the range of discount rates it adopts, the lowest discount rate is used for Figure 4. The financial data used in this study were collected from Nikkei Economic Electronic Databank System
(2016), which is provided by the Nikkei Digital Media, Inc.
The figure indicates that firms tend to adopt 1.5% to 2.0% discount rates from fiscal 2009 to 2011; 1.0% to 1.5% in fiscal 2012 and 2013; 0.5% to 1.0% in fiscal 2014; and 0% to 0.5% in fiscal 2015. The average discount rate decreases every year owing to the decline of interest rates on government bonds, as shown in Figure 1. No firm adopts discount rates of less than 0% until fiscal 2013. There are three firms adopting a 0% discount rate in fiscal 2014, and 179 firms adopting a 0% rate and 25 firms adopting rates of less than 0% in fiscal 2015.
Table 1 shows the industry classification of firms adopting discount rates of 0% or less
Table 1. Industry Classification for Firms Adopting Discount Rates of 0% or Less
Industry Classification No. of Firms
0% Less Than 0%
Foods 6
Textiles 2
Pulp and Paper 2
Chemicals 9
Drugs 1
Oil 1
Rubber 1
Ceramics 4 1
Iron and Steel 4
Non-Ferrous Refining 11 3 Machinery 11 3 Electrical Equipment 19 1 Shipbuilding 1 Automobiles 7 Transportation Equipment 3 Precision Equipment 3 Other Manufacturing 10 Fishries 1 Construction 19 3 Trading 26 3 Retailing 5 3 Real Estate 3 1 Railroad 4 Trucking 2 2 Shipping 1 Warehouse 2 1 Utilities - Electric 1 Services 20 4
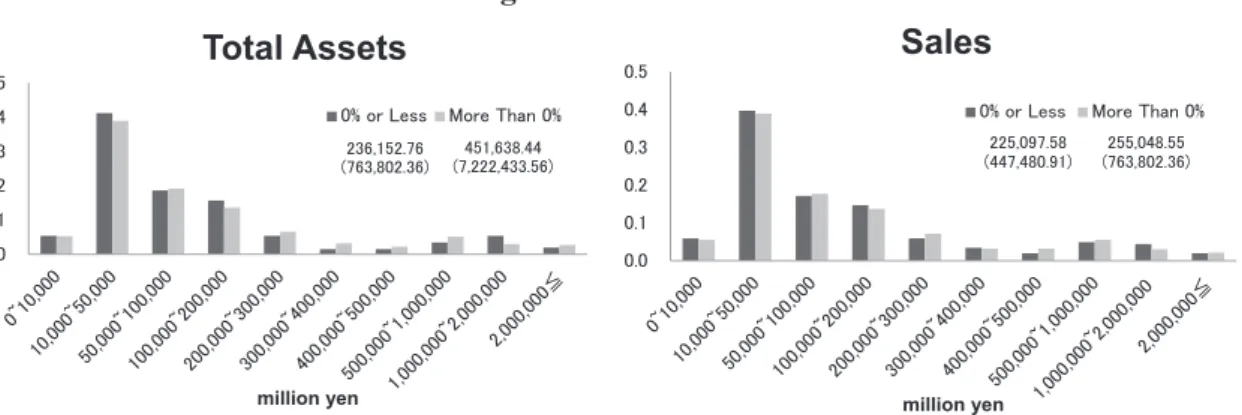
Figure 5. Firm Size
Notes: The numbers in the figure show the average amount, with the standard deviation shown below in parentheses; significance level: <<</>>>1%, <</>>5%, </>10%.
in fiscal 2015. In the electrical equipment, construction, trading, and services industries, more than 20 firms adopt discount rates of 0% or less. About half the firms adopting discount rates of 0% or less were established before 1950, which is a higher ratio than the 45% of firms adopting rates of more than 0%.
Figure 5 shows the discount rates used by firm size, as determined by total assets and sales. The average total assets for firms with discount rates of 0% or less is 236,153 million yen. For those more than 0%, it is 451,638 million yen. As for sales, firms with discount rates of 0% or less averaged 225,098 million yen. Those more than 0% averaged 255,049 million yen. The t-test is employed to compare the means of these two groups. The result shows no significant difference between firms with discount rates of 0% or less and those more than 0%.
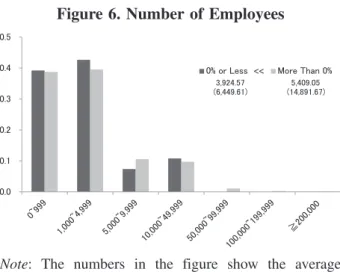
Figure 6 shows the ratio of the number of firms to total firms as broken down by number of employees. The t-test indicates a significant difference between firms with discount rates of 0% or less and those with rates of more than 0% at the 5% level. The figure shows that, for firms adopting rates of 0% or less, the ratios for firms with employees of 5,000 or less are higher than that for firms with rates of more than 0%.
4.2 Changes in Discount Rates and the Effect on Defined Benefit Plan Items
As shown in Figure 4, the average discount rate Japanese firms adopt decreases every year. Discount rates also decrease for many firms from fiscal 2014 to 2015. Changes in discount rates affect amounts of defined benefit obligations and defined benefit cost.
Figure 7 indicates the relationship between changes in discount rates and the amount of defined benefit obligations for firms with discount rates of 0% or less and those with rates of more than 0% from fiscal 2014 to 2015. Firms for which data are available for both fiscal 2014 and 2015 are selected.
The figure for firms with discount rates of 0% or less shows most firms increase the amount of defined benefit obligations in accordance with the decline in their discount rates.
Figure 6. Number of Employees
Note: The numbers in the figure show the average amount, with the standard deviation shown below in parentheses; significance level: <<</>>>1%, <</>>5%, </>10%.
Figure 7. Changes in Discount Rates and Defined Benefit Obligations
There is one firm decreasing the amount of defined benefit obligations to 60% despite the decline in the discount rate; the defined benefit plan for current employees changes to a defined contribution plan in fiscal 2015. The smaller number of firms that decrease their amounts of defined benefit obligations either return a large amount of the substitutional part of one of the defined benefit plans (namely, Employees’ Pension Fund) to the government7,
or experience a significant impact from changing accounting policies on retirement benefits.8
As for firms with discount rates of more than 0%, those that decrease their amounts of defined benefit obligations at a high level do so for the same reasons as firms with rates of 0% or less. In addition, in several firms, many employees retire during the year or the number of employees is downsized substantially. On the other hand, there are several firms which significantly increase their defined benefit obligations. In these firms, the amount of unrecognized actuarial gain or loss increases from the previous year, which includes the effect of changes in discount rates, or mergers with other firms. The range of ratios indicates most firms with discount rates of 0% or less recording changes between 0% and 20%, while those with rates of more than 0% have changes between -20% and 40%. Therefore, firms with discount rates of 0% or less might experience a smaller negative
7 The pension asset amount for Employees’ Pension Fund consists of a “substitutional part” — which is the earnings-related part of employees’ pension insurance that can be managed by the government or the firm — and the firm-specific part. Many firms have returned the substitutional part to the government to reduce the risk on pension asset management.
8 ASBJ Statement 26 and ASBJ Guidance 25 were issued in 2012. There are three main changes in these accounting standards from the previous rules. They are (a) the recognition of unrecognized obligations on the balance sheet, (b) determination of defined benefit obligations and current service cost, and (c) the expansion of disclosures on retirement benefits on footnotes. The effective dates of amendments relating to (a) and (c) are from the end of annual periods beginning on or after April 1, 2013; for (b), it is from the beginning of annual periods beginning on or after April 1, 2014 (ASBJ Statement 26, pars.34, 35). Therefore, several firms change their accounting policies on amendments relating to (b) in fiscal 2015. The amendments include a method of attributing expected benefit to a period, and a method of estimating discount rates. As for the attribution method of expected benefit to a period, firms were required to adopt straight-line basis in principle under the previous accounting standard, Statement
on Establishing Accounting Standard for Retirement Benefits (Statement on Establishing Accounting
Standard for Retirement Benefits, par.4.2.(2)). ASBJ Statement 26 currently allows firms to adopt either a straight-line basis or benefit formula basis (ASBJ Statement 26, pars.19). With regard to discount rates, under the previous accounting standard, Practical Guidance on Accounting for Retirement
Benefits, firms were allowed to use the period approximating the expected average remaining working lives of employees to determine the discount rate in practice (Practical Guidance on Accounting for
Retirement Benefits, par.1.11). However, ASBJ Guidance 25 states that “discount rates have to reflect the estimated remaining period of each retirement benefit payment.” To calculate the defined benefit obligations, a firm can use (a) a single weighted average discount rate calculated with consideration of the estimated remaining period and the amounts of each retirement benefit payment, or (b) multiple discount rates based on the estimated remaining period of each benefit payment (ASBJ Guidance 25, par.24). The changes of these accounting policies increase or decrease a firm’s defined benefit obligations.
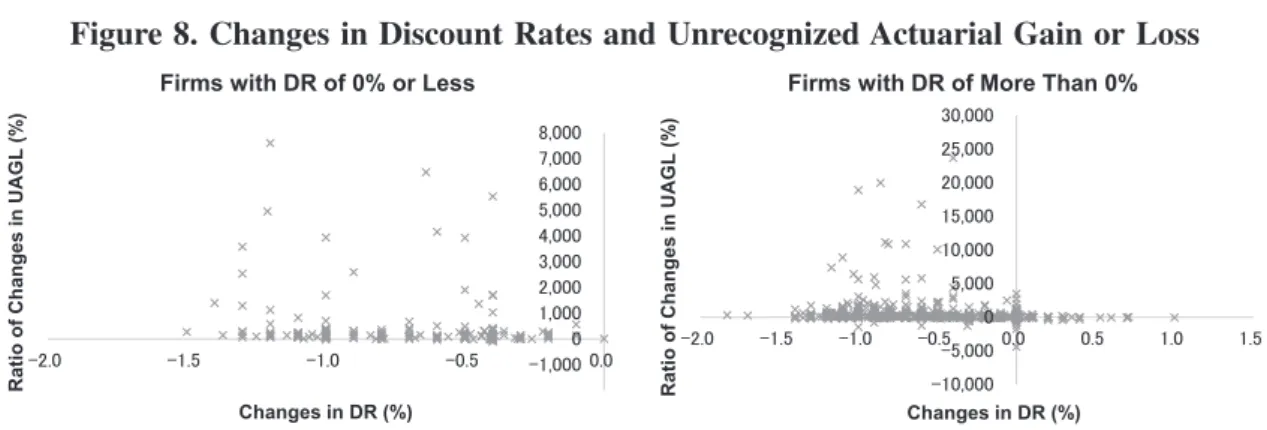
Figure 8. Changes in Discount Rates and Unrecognized Actuarial Gain or Loss
DR = discount rate, UAGL = unrecognized actuarial gain or loss
impact from changes in discount rates than those with rates of more than 0%.
Figure 8 indicates the relationship between changes in discount rates and the amount of unrecognized actuarial gain or loss. Most firms increase the amount of unrecognized actuarial gain or loss from fiscal 2014 to 2015. About 5% of firms with discount rates of 0% or less decrease the amount of unrecognized actuarial gain or loss, and all of these firms decrease their discount rates. As explained in Section 3.1, actuarial gains and losses are caused by (a) a difference between the actual return on plan assets and the expected return on plan assets, (b) a difference between the actual rate in calculating defined benefit obligations and the estimated rate, and (c) a modification of estimated rates. Therefore, these firms decrease the amount of unrecognized actuarial gain or loss because of a reason other than a modification of estimated rates, which would have the effect of increasing unrecognized actuarial gain or loss. On the other hand, 25% of firms with discount rates of more than 0% decrease the amount of unrecognized actuarial gain or loss. Some 43% of these firms decrease their discount rates, 50% have no change, and only 7% increase the rates. Firms which have a significant change in the amount of unrecognized actuarial gain or loss disclose unrecognized gain or a small amount of unrecognized loss in fiscal 2014.
As a part of defined benefit cost, actuarial gains and losses are also affected by a change in discount rates. When these gains or losses are recognized as a part of defined benefit cost, the cost can be spread within the average remaining service life of employees. Firms are also allowed to recognize the cost from the next fiscal year (ASBJ Statement 26, par.25). Therefore, the relationship between changes in discount rates and actuarial gains and losses are not treated in this section.
5. The Effect of Defined Benefit Plan and Other Financial Statement Items on
the Determination of Discount Rates
Several research papers show a relationship between financial statement items including those relating to defined benefit plans and the determination of discount rates. As explained in Section 4.2, a decline in discount rates has a negative impact on defined benefit obligations and defined benefit cost. Many research papers indicate that firms manipulate their discount rates for earnings management, i.e., their selection of rates has a positive effect on earnings. Adopting a negative discount rate increases the amount of defined benefit obligations at present value, and this amount exceeds the estimated accrual at the end of the period. Therefore, firms with discount rates of 0% or less might have better financial positions and earnings than those with discount rates of more than 0%. This section shows financial ratios related to defined benefit plans, leverage, and profitability broken down by firms with discount rates of 0% or less and those with rates of more than 0%, with the objective of determining whether firms in the two discount rates groupings display different tendencies. The relationships between these ratios and discount rates for firms with discount rates of 0% or less are also shown to examine whether there are correlations between these items.
5.1 The Effect of Defined Benefit Plan Items on the Determination of Discount Rates
Changes in discount rates have a significant effect on firms’ financial statements. Okumura (2005) shows that, under certain conditions, if a firm increases the discount rate one point, from 3% to 4%, the amount of defined benefit obligations drops by 23%. Kasaoka (2015) collects data on sensitivity analysis of Japanese firms adopting International Financial Reporting Standards which shows the effect of changes in discount rates on the amount of defined benefit obligations. The results indicate that when firms decrease their discount rates by 0.5 points, the amount of defined benefit obligations increases by 6.5% on average. Firms can determine their discount rates at their discretion. Therefore, there is a possibility that firms determine their discount rates based on their pension management situation, financial positions, and earnings owing to the significant impact of changes in discount rates on financial statements.
There are several papers which examine if firms change their discount rates for earnings management. An increase in a discount rate decreases the amounts of defined benefit obligations and defined benefit cost. Therefore, a firm can improve its pension funding and reduce its pension payment for the period and, as a result, improve its financial position and earnings. Newell et al. (2002), Blankley and Tang (1995), and Butt (2012) show that a change in actuarial assumptions, including that for a discount rate, is positively correlated to a change in pension funding status. Blankley et al. (2003) examines the effect of changes in discount rates on future defined benefit cost and concludes that, when a firm decreases the
discount rate in response to market conditions, the change in the discount rate increases defined benefit cost significantly over the next two years.
Gopalakrishnan and Sugrue (1995), Asthana (1999), and Okumura (2005) indicate that firms with relatively low funded status tend to choose higher discount rates to decrease defined benefit obligations and defined benefit cost for earnings management. Barth et al. (1993) examine the relationship between defined benefit plan components and share prices. They find that defined benefit obligations are an important factor in explaining share prices. With regard to defined benefit cost, the coefficients on components of defined benefit cost are significant in several years only when they are examined separately from other defined benefit plan components, defined benefit obligations and plan assets. Picconi (2006) employs Fama-MacBeth regressions to investigate if the market responds to the magnitude of defined benefit plan items which may affect future long-term earnings. The paper concludes defined benefit obligations are predictive of future returns. Kasaoka (2014) shows the effect of defined benefit liability, defined benefit cost, and unrecognized obligations on share prices, and finds all components are significant. If defined benefit plan components have a significant effect on share prices, firms might use their discount rates to manipulate earnings. Given these prior researches and the effect of changes in discount rates on financial statements, firms with discount rates of 0% or less might have better pension funding, financial positions, and higher earnings sufficient to offset the negative effects from the changes in discount rates. Therefore, the following hypotheses are employed:
H1: firms with better pension funding status adopt discount rates of 0% or less.
H2: firms with a smaller impact on their financial position from pension deficits adopt discount rates of 0% or less.
H3: firms with a smaller impact on their financial position from unrecognized obligations adopt discount rates of 0% or less.
H4: firms with a smaller impact on their earnings from defined benefit cost adopt discount rates of 0% or less.
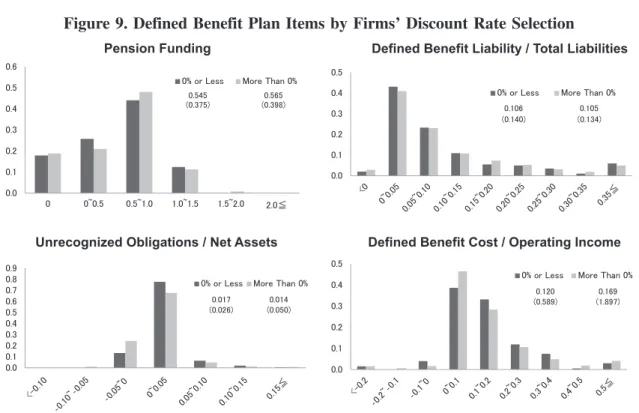
Pension funding, the ratio of defined benefit liability to total liabilities, the ratio of unrecognized obligations to net assets, and the ratio of defined benefit cost to operating income for firms with discount rates of 0% or less are compared with those with rates of more than 0% to see if they display different tendencies. Figure 9 shows the results of these comparisons.
There is no significant difference between firms with discount rates of 0% or less and those with rates of more than 0%. The details of Figure 9 show that, with respect to firms with discount rates of 0% or less, the ratio of firms with 0% to 50% pension funding status to total firms is higher than when firms with rates of more than 0% are examined. Similarly, the ratio of firms with rates of 0% or less where defined benefit cost has a greater effect on
Figure 9. Defined Benefit Plan Items by Firms’ Discount Rate Selection
Pension Funding = plan assets / defined benefit obligations, Defined Benefit Liability / Total Liabilities = defined benefit liability / (total liabilities – defined benefit liability), Unrecognized Obligations / Net Assets = unrecognized obligations / (net assets + unrecognized obligations), defined benefit cost = defined benefit cost / (operating cost + defined benefit cost)
Notes: The numbers in the figure show the average amount, with the standard deviation shown below in parentheses; significance level: <<</>>>1%, <</>>5%, </>10%.
operating income to total firms is higher than the ratio for firms with rates of more than 0%. Therefore, firms’ pension funding status, financial positions, and earnings do not affect the determination of discount rates.
Figure 10 shows the relationships between discount rates and defined benefit plan items for firms with discount rates of 0% or less to investigate if tendencies can be discerned in these relationships.
Some 88% of firms adopt discount rates of 0%, and the range of ratios on defined benefit plan items for these firms is wide. These firms might adopt a 0% discount rate to reduce the adverse effect that would occur if the change were to negative discount rates. In other words, the 0% rate they adopt might not be their best estimate of rates. With regard to firms with negative discount rates, Figure 10 shows that there is no tendency between discount rates and defined benefit plan items.
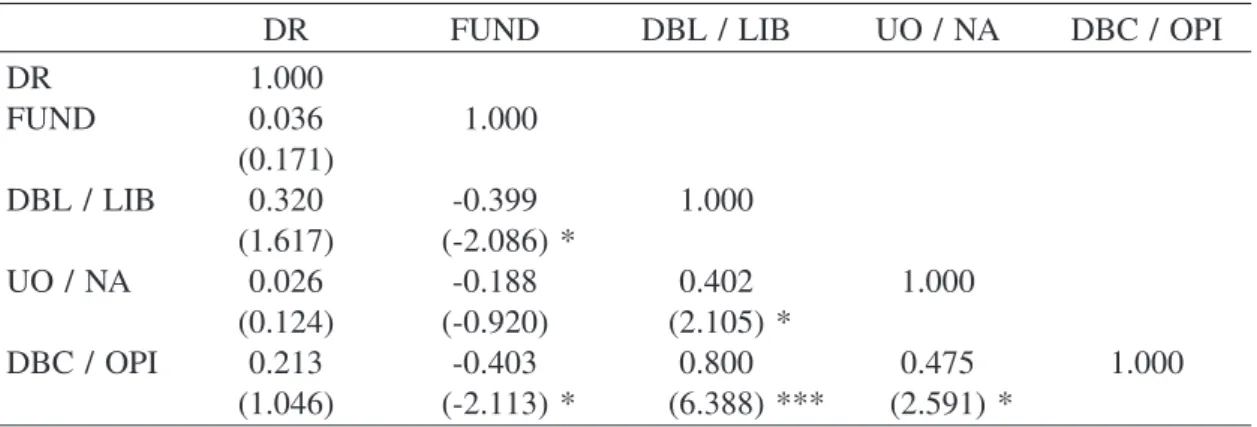
Table 2 indicates correlations between discount rates and defined benefit plan items only for firms with negative discount rates. The results show that there is no correlation between
Table 2. Correlations between Discount Rates and Defined Benefit Plan Items
DR FUND DBL / LIB UO / NA DBC / OPI
DR 1.000 FUND 0.036 1.000 (0.171) DBL / LIB 0.320 -0.399 1.000 (1.617) (-2.086) * UO / NA 0.026 -0.188 0.402 1.000 (0.124) (-0.920) (2.105) * DBC / OPI 0.213 -0.403 0.800 0.475 1.000 (1.046) (-2.113) * (6.388) *** (2.591) *
DR = discount rate, FUND = pension funding, DBL / LIB = defined benefit liability / total liabilities, UO / NA = unrecognized obligations / net assets, DBC / OPI = defined benefit cost / operating income; t-value is shown in parentheses; ***, **, *, † indicate statistical significance at 0.1, 1, 5, 10% levels respectively.
Figure 10. Relationships between Discount Rates and Defined Benefit Plan Items
discount rates and any other items. Other defined benefit plan components are correlated to each other, because they are associated in the calculation. The relationship between pension funding and the ratio of unrecognized obligations to net assets is insignificant. The reason is that most of unrecognized obligations are unrecognized actuarial gain or loss, which is significantly affected by stock and bond prices, and firms can determine the length of the period to amortize the gain or loss.
5.2 The Effect of Other Financial Statement Items on the Determination of Discount Rates
A discount rate is determined at a firm’s discretion. A firm can choose a favorable ratio depending on its financial position and financial results. Morris et al. (1983) find that firms change their actuarial assumptions including discount rates to increase their reported income and decrease liabilities. Houmes and Boylan (2010) investigate the hypothesis that firms tend to choose higher discount rates to reduce the amounts of defined benefit obligations and defined benefit cost owing to the enactment of SFAS158, which requires a firm to recognize fully its funded status, i.e., the difference between defined benefit obligations and plan assets.
Godwin et al. (1996) examine what factors motivate managers to adjust defined benefit obligations and defined benefit cost. They employ changes in leverage, earnings per share, cash flows, tax status, dividends, and the market interest rate as independent variables in their model. They conclude that managers are motivated to increase their discount rates in response to tighter dividend restrictions, lower earnings, higher leverage, and reductions in the tax benefits of pension plans. Asthana (1999) uses factors similar to those of Godwin et al. (1996) and examines whether pension and non-pension financial components are related to firms’ levels of discount rates. The study reveals that firms with higher profitability, greater cash flows from operating activities, lower tax liability, smaller debt, and higher pension funding adopt lower discount rates.
Obinata (2000) employs several independent variables related to leverage, profitability, and cash flows to study what factors affect firms’ choice of discount rates. The ratios used include debt to equity, defined benefit liability to equity, ROE, defined benefit cost to net income before taxes, cash flows from operating activities to equity, and cash flows from investing activities to equity. The variables related to profitability affect the choice of discount rates. Kasaoka (2011) shows the relationship between levels of discount rates and financial statement components including defined benefit plans. The paper indicates that firms with lower profitability, higher leverage, lower pension funding, and lower cash flows from operating activities adopt higher discount rates. Therefore, there is a possibility that firms use their discount rates to improve their financial indicators when their financial
positions become worse.
Based on these prior researches, when a firm has higher leverage, lower profitability, and less cash flows, it tends to choose higher discount rates to reduce the effect of defined benefit plan components on financial statements. Adopting discount rates of 0% or less leads to more defined benefit obligations and defined benefit cost. Therefore, firms with discount rates of 0% or less might ensure sufficient profitability and robust asset composition to sustain the negative effect from changes in discount rates. Therefore, the following hypotheses are employed:
H5: firms with lower debt to equity ratios adopt discount rates of 0% or less. H6: firms with higher ROA and ROE adopt discount rates of 0% or less.
H7: firms with higher cash flows from operating activities adopt discount rates of 0% or less.
H8: firms with higher sales growth adopt discount rates of 0% or less.
As for cash flows from operating activities, an increase in discount rates reduces the defined benefit cost and cash contribution to defined benefit plans. An increase or decrease of cash flows for defined benefit plans is recognized in cash flows from operating activities on the statement of cash flows. Therefore, cash flows from operating activities are employed.
The debt to equity ratio, ROA, ROE, cash flows from operating activities, and sales growth for firms with discount rates of 0% or less are compared with those for firms with rates of more than 0% to see if other financial statement items have a tendency between these two discount rate conditions.
Figure 11 shows the results and indicates that there is a significant difference in ROA and operating cash flows at the 1% and 5% significance levels, respectively. Firms with discount rates of 0% or less have lower profitability and cash flows than those with rates of more than 0%. Firms adopt discount rates of 0% or less not because they have better financial positions and earnings, but rather because yields on government bonds they make reference to are negative.
Figure 12 shows the relationships between discount rates and other financial statement items for firms with discount rates of 0% or less to find if there is a strong correlation between these ratios.
The figure and Table 3, which shows the correlations between discount rates and other financial statement items only for firms with negative discount rates, indicate that the debt to equity ratio and sales growth are negatively related to discount rates. These results indicate that firms with higher leverage adopt lower discount rates, and firms with higher year-over-year increases in sales adopt lower discount rates. Examining all firms adopting both negative and positive discount rates, 5% of firms have sales increases of over 20%, and
Figure 11. Other Financial Statement Items by Firms’ Discount Rate Selection
Debt to Equity Ratio = (total liabilities – defined benefit liability) / (net assets + unrecognized obligations), ROA = (operating income + defined benefit cost) / (total assets – defined benefit asset), ROE = (net income before taxes + defined benefit cost) / (net assets + unrecognized obligations), Cash Flows = (cash flows from operating activities – increase (decrease) in provision for retirement benefits) / (total assets – defined benefit asset), Sales Growth = (sales for the current period – sales for the previous period)/ sales for the previous period.
Notes: The numbers in the figure show the average amount, with the standard deviation shown below in parentheses; significance level: <<</>>>1%, <</>>5%, </>10%.
85% of these firms adopt less-than-1% discount rates. Therefore, firms which expect to increase sales, and as a result earnings as well, tend to choose lower discount rates.
The debt to equity ratio in Figure 12 shows that firms with 0% discount rates tend to have higher debt to equity ratios than those with negative discount rates. These firms might adopt a 0% discount rate to reduce the effect of a change in discount rates on their financial positions.
Figure 12. Relationships between Discount Rates and Other Financial Statement Items
6. Summary and Conclusion
In accordance with the introduction of QQE with a Negative Interest Rate, the JPY LIBOR and interest rates on Japanese government bonds have become negative since February 2016. Given this circumstance, several firms have adopted discount rates of 0% or less. A decline in discount rates increases defined benefit obligations and defined benefit cost, and has a significant effect on financial statements. In addition, adopting a negative discount rate increases the amount of defined benefit obligations at present value, and this amount exceeds the estimated accrual at the end of the period.
Japanese accounting standards require firms to determine their discount rates based on yields on safe and secure long bonds, including government and corporate bonds. The discount rates firms adopt have decreased since fiscal 2009 owing to a decline in yields on Japanese government bonds. Section 4.2 shows that many firms decreased their discount rates from fiscal 2014 to 2015, and most of these firms increased the amounts of defined benefit obligations including unrecognized actuarial gain or loss.
Based on the proposition that firms with discount rates of 0% or less might have sufficient profitability and robust asset composition to sustain the negative impact from changes in discount rates, the relationships between financial statement items including those related to defined benefit plan and the determination of discount rates were examined for firms with discount rates of 0% or less and more than 0%. There was no significant difference between the two groups for the relationship between defined benefit plan items and the discount rates firms adopted. However, for firms with discount rates of 0% or less, the ratio of firms to total firms which have 0% to 50% pension funding status is higher than
Table 3. Correlations between Discount Rates and Other Financial Statement Items
DR DE Ratio ROA ROE Cash Flows Sales Growth
DR 1.000 DE Ratio -0.442 1.000 (-2.286) * ROA 0.072 -0.108 1.000 (0.345) (-0.303) ROE -0.116 0.169 0.770 1.000 (-0.561) (1.048) (5.795) *** Cash Flows -0.044 0.000 0.543 0.212 1.000 (-0.213) (0.197) (3.100) ** (1.042) Sales Growth -0.361 0.089 0.435 0.460 0.356 1.000 (-1.857) † (0.580) (2.315) * (2.482) * (1.828) †
DR = discount rate, DE Ratio = debt to equity ratio; t-value is shown in parentheses; ***, **, *, † indicate statistical significance at 0.1, 1, 5, 10% levels respectively.
those with rates of more than 0%. With regard to the relationship between other financial statement items and the determination of discount rates, for firms with discount rates of 0% of less, the ratios of firms to total firms with lower ROA and cash flows from operating activities were higher than those with rates of more than 0%.
These results show that firms adopting discount rates of 0% or less do not have better profitability or more robust asset composition than those with rates of more than 0%. With respect to correlations between discount rates and other financial statement items specific to firms with negative discount rates, there were negative relationships between discount rates and the debt to equity ratio, as well as sales growth. Firms with higher debt to equity ratios had lower discount rates, demonstrating that firms do not choose their discount rates depending on their financial positions. As for sales growth, firms which increase their sales year-over-year tend to choose lower discount rates.
This paper revealed that firms with discount rates of 0% or less did not choose their discount rates based on their pension funding, financial positions, and earnings. They adopted their discount rates based on yields on government or corporate bonds.
Regarding the impact of changes in discount rates on defined benefit obligations, the range of ratios showed most firms with discount rates of 0% or less recording changes between 0% and 20%; for firms with rates of more than 0%, the changes were between -20% and 40%. The number of employees for firms with discount rates of 0% or less was lower than for those with rates of more than 0%. Therefore, firms with discount rates of 0% or less might have a smaller negative impact from changes in discount rates than those with rates of more than 0%.
References
Accounting Standards Board of Japan (2012). ASBJ Statement No.26: Accounting Standard for Retirement
Benefits, Tokyo: ASBJ.
Accounting Standards Board of Japan (2014). ASBJ Guidance No.25: Guidance on Accounting Standard
for Retirement Benefits, Tokyo: ASBJ.
Accounting Standards Board of Japan (2016). ASBJ Proceedings No.331 (March), “An Exhibit of ASBJ Proceedings Summary (Remit (4) Response to an Accounting Issue on a Negative Interest Rate),” Tokyo: ASBJ.
Asthana, S. (1999). “Determinants of Funding Strategies and Actuarial Choices for Defined-Benefit Pension Plans,” Contemporary Accounting Research, Vol.16, No.1, pp.39-74.
Bank of Japan (2013). Introduction of “Quantitative and Qualitative Monetary Easing”. Bank of Japan (2014). Expansion of the Quantitative and Qualitative Monetary Easing.
Bank of Japan (2016). Introduction of “Quantitative and Qualitative Monetary Easing with a Negative
Interest Rate”.
Barth, M. E., Beaver, W. H. and Landsman, W. R. (1993). “A Structural Analysis of Pension Disclosures Under SFAS 87 and Their Relation to Share Prices,” Financial Analysts Journal, Vol.49, No.1, pp.18-26.
Bauman, M. P. and Shaw, K. W. (2014). “An Analysis of Critical Accounting Estimate Disclosures of Pension Assumptions,” Accounting Horizons, Vol.28, No.4, pp.819-845.
Blankley, A. I., Cottell, P. G. and Hurtt, D. (2010). “An Empirical Examination of Pension Rate Estimates: A Benchmark Approach,” The Journal of Applied Business Research, Vol.26, No.2, pp.1-22.
Blankley, A. I., Cottell, P. G. and McClure, R. H. (2003). “An Examination of the Economic Impact of Pension Rate Reductions on Future Pension Expense, Earnings, and Cash Flows: A Simulation,”
Journal of Business & Economics Research, Vol.1, No.7, pp.33-46.
Blankley, A. I. and Tang, R. Y. W. (1995). “Measuring Pension Liabilities: An Examination of the Funding Levels of Defined Benefit Pension Plans,” Journal of Applied Business Research, Vol.11, No.2, pp.73-83.
Business Accounting Council (1998). Statement on Establishing Accounting Standard for Retirement
Benefits, Tokyo: BAC.
Butt, A. (2012). “Causes of Defined Benefit Pension Scheme Funding Ratio Volatility and Average Contribution Rates,” Annals of Actuarial Science, Vol.6, No.1, pp.76-102.
Financial Accounting Standards Board (2006). Statement of Financial Accounting Standards No.158:
Employers’ Accounting for Defined Benefit Pension and Other Postretirement Plans, Norwalk, CT: FASB.
Godwin, J. H., Goldberg, S. R. and Duchac, J. E. (1996). “An Empirical Analysis of Factors Associated with Changes in Pension-Plan Interest-Rate Assumptions,” Journal of Accounting, Auditing and
Finance, Vol.11, No.2, pp.305-322.
Gopalakrishnan, V. and Sugrue, T. F. (1995). “The Determinants of Actuarial Assumptions under Pension Accounting Disclosures,” Journal of Financial and Strategic Decisions, Vol.8, No.1, pp.35-41.
Harada, Y. (2016). “The Policy Intention and the Effects of Negative Interest Rate”, Kigyo Kaikei, Vol.68, No.10, pp.1320-1327.
Houmes, R. and Boylan, B. (2010). “Has the Adoption of SFAS158 Caused Firms to Underestimate Pension Liability? A Preliminary Study of the Financial Reporting Impact of SFAS158,” Academy of
Accounting and Financial Studies, Vol.14, No.4, pp.55-66.
IFRS Interpretations Committee (2015). Agenda Paper (January), “IAS 39 Financial Instruments:
Recognition and Measurement—Negative interest rates: implication for presentation in the statement of comprehensive income” IFRS Interpretations Committee Meeting (Agenda ref 4).
IFRS Interpretations Committee (2016). Agenda Paper (January), “IAS 39 Financial Instruments:
Recognition and Measurement—Separation of an embedded floor from a floating rate host contract in a negative interest rate environment” IFRS Interpretations Committee Meeting (Agenda ref 3).
International Accounting Standards Board (2003). International Accounting Standard No.39: Financial
Instruments: Recognition and Measurement, London: IASB.
International Accounting Standards Board (2011). International Accounting Standard No.19: Employee
Benefits, London: IASB.
Kasaoka, E. (2011). “Determinants of Changes and Levels in Discount Rates for Defined-Benefit Pension Plans,” International Review of Business, No.11, pp.65-94.
Kasaoka, E. (2014). The Effect of Defined Benefit Liability on Firms’ Valuations in Japan: Comparison of
Japanese GAAP for Retirement Benefits with IAS19, Kwansei Gakuin University Press.
Kasaoka, E. (2015). “The Determination of Discount Rates on Retirement Benefits in Japan,” International
Review of Business, No.15, pp.45-80.
Ministry of Finance Japan, “Bid Results on Government Bonds,” http://www.mof.go.jp/jgbs/reference/ appendix/index.htm. (accessed 12-15-2016)
Ministry of Finance Japan, “Interest Rate,” http://www.mof.go.jp/english/jgbs/reference/interest_rate/index. htm. (accessed 12-15-2016)
Ministry of Finance Japan, “Interest Rate (Q&A),” http://www.mof.go.jp/english/jgbs/reference/interest_rate /qa.htm. (accessed 12-15-2016)
Morris, M. H., Nichols, W. D. and Niehaus, G. R. (1983). “Considerations Driving Interest Rate Assumption Changes,” Financial Analysts Journal, Vol.39, No.6, pp.13-15.
Newell, G. E., Kreuze, J. G. and Hurtt, D. (2002). “Corporate Pension Plans: How Consistent are the Assumptions in Determining Pension Funding Status?” American Journal of Business, Vol.17, No.2, pp.23-30.
Obinata, T. (2000). “Choice of Pension Discount Rate in Financial Accounting and Stock Prices,”
Discussion Paper CIRIE-F-82, University of Tokyo.
Okumura, M. (2005). “Discretion in the Choice of Pension Discount Rate, Projected Benefit Obligation and Stock Price,” The Waseda Commercial Review, No.404, pp.27-49.
Picconi, M. (2006). “The Perils of Pension: Does Pension Accounting Lead Investors and Analysts Astray?,” The Accounting Review, Vol.81, Np.4, pp.925-955.
The Japanese Institute of Certified Public Accountants (2009). JICPA Accounting Practice Committee Report No.13: Practical Guidance on Accounting for Retirement Benefits (Interim Report), Tokyo: JICPA.
The Japanese Society of Certified Pension Actuaries and the Institute of Actuaries of Japan (2014).
Guidance for Mathematical Practice on Accounting Standards for Retirement Benefits.
The Japanese Society of Certified Pension Actuaries and the Institute of Actuaries of Japan (2014).