気候変動が有明海の淡水影響域に与える影響の数値 解析
アブドル, ナッサー アリフィン
https://doi.org/10.15017/1928632
出版情報:Kyushu University, 2017, 博士(工学), 課程博士 バージョン:
権利関係:
By
Abdul Nasser Arifin
A Thesis Submitted
In Partial Fulfillment of the Requirements For the Degree of
Doctor of Engineering
Supervisor
Prof. Shinichiro YANO, Dr. Eng.
To the
DEPARTMENT OF MARITIME ENGINEERING GARDUATE SCHOOL OF ENGINEERING
KYUSHU UNIVERSITY Fukuoka. Japan
August, 2017
i CERTIFICATE
The undersigned hereby certify that they have read and recommended to the Graduate School of Engineering for acceptance of this thesis entitled, “Numerical Analysis of Climate Change Impact on Region of Freshwater Influence in the Ariake Sea, Japan” by Abdul Nasser Arifin in partial fulfillment of the requirements for the degree of Doctor of Engineering.
Dated: August, 2017
Thesis supervisor:
Prof. Shinichiro YANO, Dr. Eng.
Examination Committee:
Prof. Noriaki HASHIMOTO, Dr. Eng.
Prof. Takahiro KUBA, Dr. Eng.
ii
The climate research has been begun since in the early 19th century, according to Intergovernmental Panel on Climate Change (IPCC) report 2008. The anomaly phenomena caused by extreme events as primary climate change indicator in nature such: extreme temperatures, heat waves, precipitation extreme, droughts, change in tropical cyclone activity, and sea level rise in extreme are some of the impacts of climate change.
In the global environments, aquatic ecosystems are the critical component to determine the quality of the environment. In addition to being vital contributors to biodiversity and productivity, they also provide a variety of services for the human.
Aquatic ecosystems have a limited ability to adapt with climate change effect.
However, aquatic systems have been increasingly threatened directly and indirectly by climate change. Alteration of water temperatures will alter water ecosystem significantly. At the marine ecosystem, increased water temperature, precipitation intensity, and longer periods of low flows are projected to exacerbate many forms of water pollution including sediments, nutrients, dissolved organic carbon, pathogens, pesticides, salt and thermal pollution.
The aquatic ecosystem consists of seawater ecosystem and freshwater one. The region of freshwater influences (ROFI) that was proposed for the first time by Simpson is an interfacial area of water between seawater and freshwater. ROFI plays an important role in determining the condition of the marine environment and ecosystem in coastal regions. Related to climate change phenomena, this region becomes a vulnerable area to degradation of water quality due to alteration effects from both sides of seawater and freshwater. In natural of water activity, the physical parameters of water such density and temperature are two components that can play a significant role to determine water quality level in an aquatic environment.
Therefore alteration of water density and water temperature are used as the primary
parameter in this study.
iii
components, water stratification, and adjustment on it causes distribution pattern of chemical and physical components will change vertically and horizontally due to the sensitivity of them caused by fluctuation of water density and water temperature.
Therefore, to see the climate change impact on ROFI, the alteration of baroclinic assessment was used to obtain climate change impact by using several numerical experiment cases relate to climate change indicators.
In the present study, to see the climate change impact on the Ariake Sea ROFI, our study was divided in some chapter in this thesis, and described as follows:
Chapter 1 explains about research background, research problem, research objectives, the scope of the study, and also the overview of the thesis as an introduction.
Chapter 2 shows several previous research related to our study. How the impact of climate change on the aquatic system was showed from some research results that have been conducted by some experts, more than that, the study about ROFI as the primary object of this study was discussed to shows how its vulnerary and potential threat due to climate change impact.
Chapter 3 indicates the numerical analysis conducted to compare an effect of runoff pattern on the baroclinic flow for 20 days in July, 2012. We modify river discharge data by using multiplier factor (0.8-2.0) to make several case conditions.
A comparison among numerical experiments for several extreme floods is considered as a projection of climate change. The result from this study can show that the change of rainfall pattern can change the baroclinic structure in a coastal region of the Ariake Sea.
In Chapter 4, numerical experiments are conducted with the observation data of
river discharge and river water temperature to investigate the baroclinic structure in
ROFIs due to both of salinity stratification and thermal one in several cases that
show the actual water temperature difference (T) between seawater temperature
iv
adaptation for aquatic environment and marine ecosystem in a coastal region to the global warming.
In Chapter 5, an assessment of the climate change effects on thermal stratification in coastal waters is carried out by using data from the Ariake Sea – a semi-enclosed bay in the island of Kyushu, Japan. The river water temperature data after August 2015 at the discharge observation stations of Class-A rivers that feed the bay is used. Numerical simulations are performed on the density stratification in the Ariake Sea to assess the effects of temporal changes in river water temperature on thermal stratification. It is shown that during a summer flood, river water temperature can influence the reproducibility of the development of thermal stratification depending on the river water temperature used, and the reproducibility of the base water temperature differed during the transition to the mixing period.
Effects of river water temperature on the water temperature structure of the sea are indicated.
In Chapter 6, an assessment of potential threat of water temperature alteration effect on the aquatic ecosystem is done. In the following climate change issue, the region of freshwater influences (ROFI) is vulnerable area to degradation of water quality. In this chapter, differences of water temperature in ROFI associated with the global warming effect is conducted by some numerical experimental conditions on water temperature simulation that has an extreme different temperature (T
sr= 10
o oC) in the Ariake Sea. The results show how the global warming can be a problem in aquatic environments and how the distribution pattern of potential threats of water temperature change in seawater–freshwater mixing related to water temperature in aquatic ecosystems. This is important because changes in water temperature have implications for aquatic biota such as seaweed (Nori: Porphyra yezoensis), fish and other organisms, especially in the ROFI. The results can be utilized to determine some methods to mitigate the effects of global warming on aquatic environments and marine ecosystems in coastal regions.
-
v
vi
ABSTRACT ... ii
TABLE OF CONTENTS ... vi
LIST OF FIGURES ... x
LIST OF TABLES ... xiv
CHAPTER 1 INTRODUTION Abstract ... 1
1.1 RESEARCH BACKGROUND ... 2
1.1.1 Climate Change Indicator ... 2
1.1.2 Climate Change Impact to The Aquatic Environment ... 7
1.1.3 Future Risk ... 10
1.2 STUDY AREA ... 15
1.3 THE HEAVY RAINFALL IN 2012 ON KYUSHU ISLAND ... 17
1.4 THE PROBLEMS OF RECENT STUDY ... 19
1.5 RESEARCH OBJECTIVES ... 22
1.6 DISSERTATION ORGANIZATION ... 23
REFERENCES ... 24
CHAPTER 2 LETERATURE REVIEW Abstract ... 27
2.1 INTRODUCTION ... 27
2.2 CLIMATE CHANGES IMPACT ON MARINE
vii
2.4.2 Tidal Straining ... 38
2.5 ARIAKE SEA AND HEAVY RAINFALL EVENTS IN 2012 RESEARCH ... 38
2.6 NUMERICAL SIMULATION AND CLIMATE MODEL ... 41
REFERENCES ... 44
CHAPTER 3 NUMERICAL ANALYSIS OF EFFECTS OF EXTREME FLOOD EVENTS ON BAROCLINIC FLOWS IN THE ARIAKE SEA, JAPAN Abstract ... 47
3.1 BACKGROUND AND RESEARCH OBJECTIVES ... 47
3.2 METHODOLOGY ... 49
3.2.1 Numerical Model ... 49
3.2.2 Numerical Experiment Condition ... 50
3.2.3 Baroclinic Flow Assessment ... 52
3.3 RESULT AND DISCUSSION ... 53
3.3.1 Horizontal Salinity Distribution Pattern ... 53
3.3.2 Vertical Structure of Salinity Stratification ... 55
3.4 CONCLUSION ... 57
REFERENCES ... 58
viii
Abstract ... 59
4.1 INTRODUCTION ... 60
4.2 METHODOLOGY ... 63
4.2.1 Water Temperature and Salinity Data ... 63
4.2.2 Numerical Model ... 64
4.2.3 Numerical Experiment Condition ... 66
4.3 RESULT AND DISCUSSION ... 69
4.4 CONCLUSION ... 74
REFERENCES ... 75
CHAPTER 5 ASSESSING EFFECTS OF TEMPORAL CHANGES IN RIVER WATER TEMPERATURE ON STRATIFICATION IN THE ARIAKE SEA Abstract ... 77
5.1 INTRODUCTION ... 78
5.2 CONTINUOUS OBSERVATION OF RIVER WATER TEMPERATURE ... 80
5.3 CORRELATIONS BETWEEN RIVER WATER AND ATMOSPHERIC TEMPERATURES ... 82
5.4 NUMERICAL SIMULATIONS ... 85
5.4.1 Numerical Model ... 85
5.4.2 Assessment of The Effects of Changes in River Water Temperature on Thermal Stratification ... 87
5.5 CONCLUSION ... 93
REFERENCES ... 94
ix
Abstract ... 96
6.1 INTRODUCTION ... 97
6.2 METHODOLOGY ... 100
6.2.1 Numerical Model ... 100
6.2.2 Numerical Experiment Conditions ... 101
6.2.3 Ariake Sea ROFI ... 103
6.2.4 Assessment of Alterations in Water Temperature ... 104
6.3 RESULTS AND DISCUSSION ... 106
6.3.1 ROFI Area ... 106
6.3.2 Extreme Rainfall and Water Temperature ... 106
6.3.3 Thermal Assessments ... 108
6.3.4 Thermal Distribution ... 112
6.4 CONCLUSION ... 115
REFERENCES ... 116
CHAPTER 7 CONCLUSION ... 118
ACKNOWLEDGEMENT ... 122
x
Figure 1.2 Annual anomalies temperature from 1981-2010 ... 4 Figure 1.3 Annually anomalies of sea surface temperature
difference (
oC) from 1961-1990 ... 4 Figure 1.4 Annual anomalies precipitation from 1988-2010 (a)
and annual anomalies runoff from 1979-2013 (b) (mm yr
-1) ... 5 Figure 1.5 Linkages between climate change and environmental
drivers of temperature and precipitation ... 6 Figure 1.6 Hydrological cycle ... 6 Figure 1.7 Change in average precipitation (1986 – 2005 to 2080 – 2100) ... 7 Figure 1.8 Large-scale relative changes in annual runoff for
the period 2090–2099, relative to 1980–1999 ... 9 Figure 1.9 Kyushu Island and the Ariake Sea location ... 11 Figure 1.10 Dissertation organization ... 13 Figure 2.1 Linkages between climate change and
environmental drivers of temperature and precipitation ... 23 Figure 2.2 Schematic of the characteristic regimes of
shelf, estuary and ROFI ... 26 Figure 2.3 The development of stratification through the freshwater input... 28 Figure 2.4 Simplified estuarine circulation incorporating
3-dimensional variation and flow ... 29 Figure 2.5 Japan map and Ariake Sea location ... 30 Figure 2.6 The prediction of the global mean surface temperature (a)
and precipitation (b) based on multi-model mean projections ... 31
Figure 3.1 Computational Domain ... 40
Figure 3.2 Tide and runoff from A-class rivers from 6th-26th July 2012 ... 42
Figure 3.3 Computation result of horizontal salinity distribution
xi
in the surface layer in case-1 at 12:00 15
thJuly 2012. ... 54 Figure 3.6 Computation result of horizontal salinity distribution
in the surface layer in case-4 at 12:00 15
thJuly 2012. ... 55 Figure 3.7 Computation results of salinity isopleth in case-1 (upper)
and 4 (lower) at Sta. A ... 55 Figure 3.8 Computation results of salinity isopleth in case-1 (upper)
and 4 (lower) at Sta. D. ... 56 Figure 3.9 Computation results of the temporal change of S/z
at Sta. A (upper) and Sta. D (lower). ... 47 Figure 4.1 Computational Domain ... 63 Figure 4.2 Comparison of seawater temperature from five observation
stations in the different location during simulation period
in the Ariake Sea. ... 64 Figure 4.3 Calculated tide at Sta. C and total runoff from
A-class rivers during 6th-26th July 2012 ... 66 Figure 4.4 The monthly average temperature comparison
between seawater and river water in the Ariake Sea. ... 67 Figure 4.5 Comparison of the computation result of horizontal temperature
distribution in the surface layer of the Ariake Sea
among case-3, case-4 and case-6 at 12:00 14
thJuly 2012 ... 69 Figure 4.6 Comparison of the computation result of horizontal temperature
distribution in the surface layer of the Ariake Sea
among case-3, case-4 and case-6 at 12:00 15
thJuly 2012 ... 70 Figure 4.7 The strength of thermal stratification in the six
numerical experiment at Sta. C (upper) and Sta. D (lower). ... 71 Figure 4.8 Computation results of temperature isopleth in case-3 (upper),
case-4 (middle) and case-6 (lower) at Sta. C ... 72 Figure 4.9 Computation results of temperature isopleth in case-3 (upper),
case-4 (middle) and case-6 (lower) at Sta. D ... 72 Figure 5.1 Water temperature observation points for the rivers studied
and the comparison points for simulation ... 81
xii
Figure 5.4 Correlation between water temperatures measured at the Shira River (Yotsugi-bashi) and atmospheric
temperature (all data for 2015)... 83 Figure 5.5 Correlation between water temperatures measured at
the Shira River and atmospheric temperature ... 83 Figure 5.6 Correlation between water temperatures measured at
the Ushitsu River (Myoken-bashi) and atmospheric temperature .... 84 Figure 5.7 Water temperature measured at the Isahaya Bay Point B6
(late August 2015, the blank portion indicates missing data) ... 88 Figure 5.8 Water temperature calculated for the Isahaya Bay Point B6
(late August 2015) ... 88 Figure 5.9 River discharge and metrological conditions used for calculation
(late August 2015) ... 89 Figure 5.10 Salinity calculated for Case 1 (late August 2015) ... 91 Figure 5.11 Water temperature calculated for Sta. A
(northern Ariake Sea in late August 2015) ... 92 Figure 5.12 Difference in water temperature (Case 2 minus Case 1)
calculated for Sta. A (northern Ariake Sea) results ... 92 Figure 6.1 Comparison of water temperature between
seawater (Shimabara Bay Observation Station) and
freshwater (Chikugo River) in four different scenarios. ... 98 Figure 6.2 Japan and location of the Ariake Sea. ... 100 Figure 6.3 Computational domain ... 102 Figure 6.4 Schematic of the characteristic regimes of shelf,
estuary and ROFI ... 104 Figure 6.5 The strength of water density stratification (Δρ) for
all numerical experiment cases at Sta. A, Sta. B, Sta. C
and Sta. D from 1 June to 1 September 2012 ... 106
xiii
(Sta. A, Sta. B, Sta. C and Sta. D) for case-1 (a) and case-2 (b) ... 108 Figure 6.8 River discharge and water temperature for case-1 ... 108 Figure 6.9 River discharge and water temperature for case-2 ... 110 Figure 6.10 Water temperature and tide water level for
case-1 during flood events ... 110 Figure 6.11 Water temperature and tide water level for
case-2 during flood events ... 111 Figure 6.12 The horizontal propagation of thermal distribution in
the surface layer for case-1 (a), case-2 (b) and case-5 (c) ... 112 Figure 6.13 The horizontal propagation of thermal distribution in
layer-3 for case-1 (a), case-2 (b) and case-5 (c) ... 113 Figure 6.14 Computation results of thermal vertical distribution for
case-1 (upper), case-2 (middle) and case-5 (lower) at Sta. A ... 114 Figure 6.15 Computation results of thermal vertical distribution for
case-1 (upper), case-2 (middle) and case-5 (lower) at Sta. B ... 114
xiv
Table 1.1 Projected global average surface warming and
sea level rise at the end of the 21st century... 12
Table 1.2 July monthly precipitation (in mm) at 21 stations (from north to south) in the area of Kyushu... 17
Table 3.1 Case for numerical experiments. ... 51
Table 4.1 Numerical experiment cases ... 58
Table 6.1 Numerical experiment cases water temperature. ... 105
xv
1
CHAPTER 1 INTRODUCTION
ABSTRACT
Climate change has been the global issue since in the early 19th century when the natural greenhouse effect first identified. In this introductory chapter, the climate change description of is given to establish the same perception about why the climate change is a fundamental issue in nowadays. The explanation about the climate change indicators related to aquatic environments is a great way to understand and shows how our climate has been changed and has a significant effect on our environment now. The region of freshwater influence (ROFI) role in an aquatic environment is simply explained and also the climate change impact on ROFI is described. Ariake Sea as the study area and its extreme rainfall history in 2012 (as one of climate change indicator) are the main backgrounds from this research presented in this chapter.
2
1.1 RESEARCH BACKGROUND
The world is getting warmer [IPCC, 2014]. The climate research has been begun since in the early 19
thcentury when ice ages and other natural changes in paleoclimate were first suspected, and the natural greenhouse effect first identified. In the 1960s, the warming effect of carbon dioxide gas became increasingly convincing. Some scientists also pointed out that human activities that generated atmospheric aerosols (e.g., "pollution") could have cooling effects as well. Since the 1990s, scientific research on climate change has included multiple disciplines and has expanded. Research has expanded our understanding of causal relations, links with historic data and ability to model climate change numerically. Research during this period has been summarized in the Assessment Reports (AR) by the Intergovernmental Panel on Climate Change (IPCC).
Definition of climate change is a significant and lasting change in the statistical distribution of weather patterns over periods ranging from decades to millions of years. It may be a change in the mean and the variability of weather properties conditions, or in the distribution of weather around the average conditions (such as more or fewer extreme weather events). The latter effect is currently causing global warming, and "climate change" is often used to describe human-specific impacts [IPCC, 2008].
1.1.1 Climate Change Indicator
One important way to track and communicate the causes and effects of
climate change is through the use of indicators. An indicator represents
the state or trend of certain environmental or societal conditions over a
given area and a specified period. For example, long-term
measurements of temperature in globally is used as an indicator to track
and better understand the effects of changes in the Earth's climate.
3
Temperature rise in the lower atmosphere
The lowest layer of the atmosphere, called the troposphere, from satellite measurements, shows that this lowest layer of the atmosphere is warming as greenhouse gases build up and trap heat that radiates from the Earth's surface [U.S. Environmental Protection Agency, 2014]. This phenomenon shows a trend of rising from 0.22° to 0.26°C per 10 years, consistent with the global warming trend derived from surface meteorological stations [Vinnikov, Grody, 2003]
The warming phenomena in this region were predicted happening since 1850, the Earth's surface has been successively warmer at the last three decades than any proceeding. “The period from 1983 to 2012 was very likely the warmest 30-year period of the last 800 years in the Northern Hemisphere, where such assessment is possible (high confidence) and likely the warmest 30-year period of the last 1400 years (medium confidence)” [IPCC, 2014].
Figure 1.1 Annual anomalies temperature in lower tropospheric [Blunden, 2015]
Air temperatures rise in over land
Warming is greater over land than over the oceans, because water is
slower to absorb and release heat (thermal inertia). From the weather
4
stations on land average air temperatures are rising, and as a result, the frequency and severity of droughts and heat waves are increasing.
Intense droughts can lead to destructive wildfires, failed crops, and low water supplies, in many parts of the world.
Air temperatures rise over ocean
Our planet is a watering place. "There are 71 % our planet surface is water-covered, and the oceans hold about 96.5 percent of all Earth's water" [U.S. Department of the Interior | U.S. Geological Survey, 2016].
Therefore the increasing trend of air temperature in over them could make a vast difference in the climate system.
Oceans evaporate more water as the air right near the surface gets warmer. This condition can be caused more floods, more hurricanes, and more extreme precipitation events.
Figure 1.2 Annual anomalies temperature from 1981-2010 [Blunden, 2015]
Sea surface temperature rising
Increasing air temperature over the ocean is followed by the ocean
warming, it is largest near the surface, and "the upper 75 m warmed by
0.11 [0.09 to 0.13] °C per decade over the period 1971 to 2010. It is
virtually certain that the upper ocean (0−700 m) warmed from 1971 to
2010, and it likely warmed between the 1870s and 1971. It is likely that
5
the ocean warmed from 700 to 2000 m from 1957 to 2009 and from 3000 m to the bottom for the period 1992 to 2005" (Figure 1.3) [IPCC, 2014].
Sea level rising
There was high confidence if the global average sea level had been increased since between the mid-19th and the mid-20th centuries. “The average rate was 1.7 ± 0.5 mm/yr. for the 20th century, 1.8 ± 0.5 mm/yr.
for 1961–2003, and 3.1 ± 0.7 mm/yr. for 1993–2003” [Bates, 2008]. It is not known whether the higher rate in 1993–2003 is due to decadal variability or an increase in the longer-term trend. Spatially, "the change is highly non-uniform, over the period 1993 to 2003, rates in some regions were up to several times the global mean rise while, in other regions, sea levels fell” [Bates, 2008]
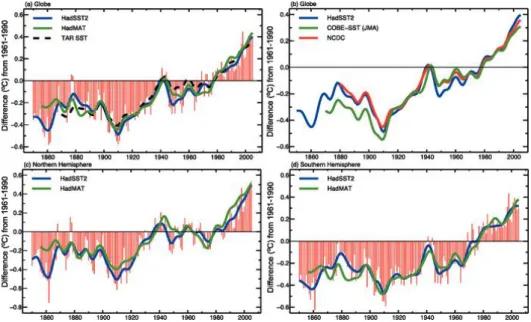
Figure 1.3 Annually anomalies of sea surface temperature difference (oC) from 1961-1990 (HadSST2; red bars and blue solid curve), 1850 to 2005, and
global NMAT (HadMAT, green curve), 1856 to 2005, relative to the 1961 to 1990 mean (°C) from the UK Meteorological Office [Rayner, 2006] and
[IPCC, 2014]
6
Extreme events are increasing in frequency and intensity
Impacts from recent climate-related extremes, such as heat waves, droughts, floods, cyclones, and wildfires, reveal significant vulnerability and exposure of some ecosystems and many human systems to current climate variability (very high confidence). Impacts of such climate- related extremes include alteration of ecosystems, disruption of food production and water supply, damage to infrastructure and settlements, human morbidity and mortality and consequences for mental health and human well-being. For countries at all levels of development, these impacts are consistent with a significant lack of preparedness for current climate variability in some sectors [IPCC, 2014].
Figure 1.4 Annual anomalies precipitation from 1988-2010 (a) and annual anomalies runoff from 1979-2013 (b) (mm yr-1) [Blunden, 2015]
a)
b)
7
1.1.2 Climate Change Impact to the Aquatic Environment
In the global environment, aquatic ecosystems are critical components.
In addition to being essential contributors to biodiversity and ecological productivity, they also provide a variety of services for human populations. However, aquatic systems have been increasingly threatened, directly and indirectly, by global climate change (Figure 1.5).
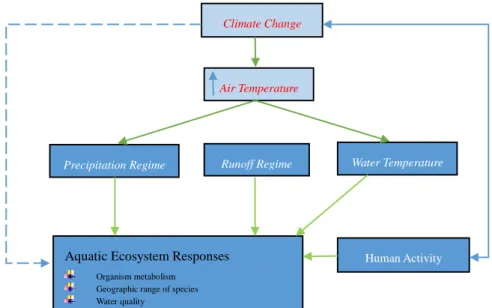
Figure 1.5 Linkages between climate change and environmental drivers of temperature and precipitation that regulate many ecological processes and
patterns in inland freshwater and coastal wetland ecosystems [Poff, Brinson, 2002]
Changes in temperature
According to some indicators of climate change that mentioned above, the aquatic ecosystems is the vulnerable area to the adverse effects of climate change both directly and indirectly. An increase in air temperature due to global warming will translate directly into warmer water temperatures for most streams and rivers, thereby altering fundamental ecological processes and species distributions. Streams and rivers are relatively shallow, turbulent, and well-mixed systems, meaning they exchange heat and oxygen readily with the atmosphere. Therefore, they will become warmer under projected climate change [Eaton et al.,
Precipitation Regime Runoff Regime
Aquatic Ecosystem Responses
Organism metabolism Geographic range of species Water quality
Climate Change
Air Temperature
Water Temperature
Human Activity
8
1996].
The life processes of many aquatic organisms are temperature- dependent.
Warmer water can increase growth rates and stimulate ecosystem production. For example, marine invertebrates at the base of the food web (e.g., aquatic insects) may mature more rapidly, albeit to a smaller size, and reproduce more frequently [Arnell, 1998]. Assuming no change in food resources, invertebrate production of streams and rivers may increase, potentially yielding more food for fish. However, higher water temperatures will also increase the rate of microbial activity and thus the rate of decomposition of organic material, which may result in less food being available for invertebrates and ultimately fish [Mayer et al., 1990].
Annual anomalies temperature as impact climate change are predicted to increase especially at the higher latitude, and some areas of the continent will become wetter and some drier, and the variability in the timing and quantity of precipitation will also change, altering patterns of runoff to aquatic ecosystems.
Changes in precipitation and runoff regimes
Many studies argue if the phenomena of climate change have strong influence on the seasonal of precipitation pattern. For example the increasing temperatures over the oceans as one of the indicators of climate change has implications on increasing rate of evaporation that occurs on the sea surface, this condition gives impact on the rate of precipitation, and it will affect to each step of the hydrologic cycle in Figure 1.6.
The seasonal pattern of precipitation falling on a watershed is translated
into the surface runoff that feeds into streams and rivers. In ecological
terms, the extremes of flow are critical events that influence species
composition and the productivity of aquatic and wetland communities. In
the eastern United States, precipitation is high enough to sustain year-
round flow in streams. Thus, knowledge of the particular regional
9
changes in stream flow regimes brought about by climate change is critical to anticipating ecological impacts. Some projections are reasonably well supported, and others need to be considered as possible scenarios to evaluate the range of ecological concerns related to a changing climate.
Figure 1.6 Hydrological cycle
Sea level
Global mean sea level has been rising, and there is high confidence that the rate of rising has increased between the mid-19th and the mid-20th centuries. The average rate was 1.7 ± 0.5 mm/yr. For the 20th century, 1.8 ± 0.5 mm/yr. For 1961–2003, and 3.1 ± 0.7 mm/yr. for 1993–2003. It is not known whether the higher rate in 1993–2003 is due to decadal variability or an increase in the longer-term trend. Spatially, the change is highly non-uniform; e.g., over the period 1993 to 2003, rates in some regions were up to several times the global mean rise while, in other areas, sea levels fell [IPCC, 2014].
Runoff and river discharge
Trends in runoff are always consistent with changes in precipitation. This may be due to data limitations (in particular the coverage of precipitation data), the effect of human interventions such as reservoir impoundment (as is the case with the major Eurasian rivers), or the competing effects
Ocean
10
of changes in precipitation and temperature There is, however, far more robust and widespread evidence that the timing of river flows in many regions where winter precipitation falls as snow has been significantly altered. Higher temperatures mean that a greater proportion of the winter precipitation falls as rain rather than snow, and the snowmelt season begins earlier.
1.1.3 Future Risk
The risk of climate-related impacts results from the interaction of climate-related hazards (including hazardous events and trends) with the vulnerability and exposure of human and natural systems, including their ability to adapt. Rising rates and magnitudes of warming and other changes in the climate system, accompanied by ocean acidification, increase the risk of severe, pervasive and in some cases irreversible detrimental impacts. Some risks are especially relevant for individual regions, while others are global. The overall risks of future climate change impacts can be reduced by limiting the rate and magnitude of climate change, including ocean acidification. The precise levels of climate change sufficient to trigger abrupt and irreversible change remain uncertain, but the risk associated with crossing such thresholds increases with rising temperature (medium confidence). For risk assessment, it is important to evaluate the widest possible range of impacts, including low-probability outcomes with large consequences.
Precipitation extremes
Climate projections using multi-model ensembles show increases in
globally averaged mean water vapor, evaporation, and precipitation over
the 21st century. It is very likely that heavy precipitation events will
become more frequent. The intensity of precipitation events is projected
to increase, particularly in tropical and high-latitude areas that experience
increases in mean precipitation. There is a tendency for drying in mid-
11
continental areas during summer, indicating a greater risk of droughts in these regions. In most tropical and mid- and high-latitude areas, extreme precipitation increases more than mean precipitation.
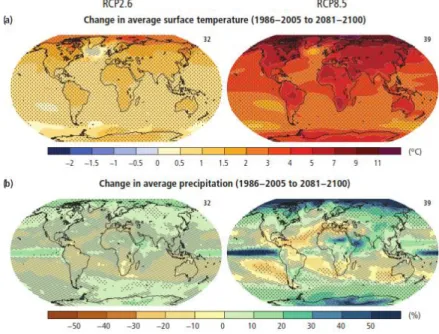
Changes in precipitation will not be uniform as shown in Figure 1.7. The high latitudes and the equatorial Pacific are likely to experience an increase in annual mean precipitation under the RCP8.5 scenario. In many mid-latitude and dry subtropical regions, mean precipitation will likely decrease, while in many mid-latitude wet regions, mean precipitation will likely increase under the RCP8.5 scenario. Extreme precipitation events over most of the mid-latitude land masses and humid tropical regions will be very likely become more intense and more frequent.
Figure 1.7 Change in average precipitation (1986 – 2005 to 2080 – 2100) under the RCP2.6 (left) and RCP8.5 (right) scenarios [IPCC, 2014]
Also associated with the risk of drying is a projected increase in the risk of intense precipitation and flooding. Though somewhat counter-intuitive, this is because precipitation is projected to be concentrated in more intense events, with longer periods of lower precipitation in between.
Therefore, intense and heavy episodic rainfall events with high runoff
amounts are interspersed with longer relatively dry periods with
increased evapotranspiration, particularly in the sub-tropics. However,
depending on the threshold used to define such events, an increase in the
12
frequency of dry days does not necessarily mean a decrease in the frequency of extreme high-rainfall events. Another aspect of these changes has been related to changes in mean precipitation, with wet extremes becoming more severe in many areas where mean precipitation increases and dry extremes becoming more severe where mean precipitation decreases.
Sea level
The average rate of sea-level rise during the 21st century is very likely to exceed the 1961–2003 average rate (1.8 ± 0.5 mm/yr.) [Glick, Clough, Nunley, 2010]. Thermal expansion is the largest component, contributing 70–75% of the central estimate in these projections for all scenarios (Table 1.1) [IPCC, 2007].
Table 1.1 Projected global average surface warming and sea level rise at the end of the 21st century [IPCC, 2007].
Glaciers, ice caps, and the Greenland ice sheet are also projected to
contribute positively to sea level. GCMs indicate that, overall, the
Antarctic ice sheet will receive increased snowfall without experiencing
substantial surface melting, thus gaining mass and contributing
negatively to sea level. Sea-level rise during the 21st century is projected
to have significant geographical variability. Partial loss of the Greenland
and Antarctic ice sheets could imply several meters of sea-level rise,
13
major changes in coastlines and inundation of low-lying areas, with the greatest effects in river deltas and low-lying islands. Current modeling suggests that such changes are possible for Greenland over millennial time-scales, but because dynamic ice flow processes in both ice sheets are currently poorly understood, more rapid sea-level rise on century timescales cannot be excluded.
Runoff and river discharge
Changes in river flows, as well as lake and wetland levels, due to climate change depend primarily on changes in the volume and timing of precipitation and, crucially, whether precipitation falls as snow or rain.
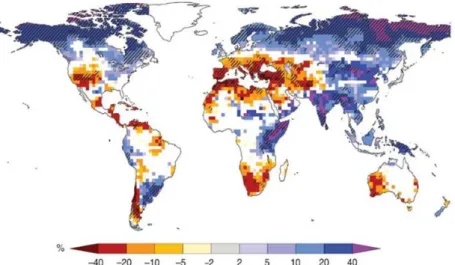
Changes in evaporation also affect river flows. The larger of river runoff changes reach 20% or more of the simulated 1980–1999 values, which range from 1 to 5 mm/day in wetter regions to below 0.2 mm/day in deserts (Figure 1.8) [Bates, 2008].
Figure 1.8 Large-scale relative changes in annual runoff for the period 2090–
2099, relative to 1980–1999 [Bates, 2008]
This global map of annual runoff illustrates large-scale changes and is
not intended to be interpreted at small temporal (e.g., seasonal) and
spatial scales. In areas where rainfall and runoff are very low (e.g., desert
areas), small changes in runoff can lead to large percentage changes. In
14
some regions, the sign of projected changes in runoff differs from
recently observed trends. In some areas with projected increases in runoff,
different seasonal effects are expected, such as increased wet-season
runoff and decreased dry-season runoff.
15
1.2 STUDY AREA
Ariake Sea is used as study area here, The Ariake Sea located in the west part of Kyushu Island, Japan, is a semi-closed shallow sea with macro-tidal and several well-mixed estuaries (see Figure 1.9). The total area of the sea is about 1,700 km
2with l00 km gulf axial length, 16 km in average width, and 20 m of average water depth. The basin is very large area extending to 5 prefectures of Saga, Fukuoka, Kumamoto, Nagasaki, and Oita, or 8,400 km
2.
Figure 1.9 Kyushu Island and the Ariake Sea location (Data source: Google map)
The intensity of mixing water between salt water and fresh water is higher in
here, as the largest bay in Kyushu Island, Ariake Sea has over 100 rivers, both
small and large and flows into it, such as the Chikugo River which runs down
from Mount Kujyu. Water tides here can reach up to six meters, and the tidal
flats that this creates provide a unique ecosystem forms of life. In the Ariake
16
Sea environment here allows a broad range of marine products to be harvested,
and these are then delivered across the country. In particular, the vast taste of
the Nori across Japan farmed here, and it is known as Ariake Nori.
17 1.3
THE HEAVY RAINFALL IN 2012 ON KYUSHU ISLAND
Precipitation extreme as one climate change indicator is used in this study as a research subject to simulate several numerical experiment cases. Therefore, precipitation data from the study area (Kyushu Island) will be assessed for several years to find when is the heavy rainfall occur in Kyushu region.
Table 1.2 July monthly precipitation (in mm) at 21 stations (from north to south) in the area of Kyushu. Precipitation totals of July 2012 exceeding the mean of 1961-
1990 are red marked [Japan Meteorological Agency, 2017].
station
July precipitation (mm)
2012 1961-1990
Shimonoseki 376 264
Iizuka 456 308
Fukuoka 464 258
Hirado 317 330
Hita 1015 323
Saga 649 341
Oita 517 240
Sasebo 374 327
Asosan 1130 670
Kumamoto 489 393
Unzendake 588 530
Nagasaki 223 334
Nobeoka 249 261
Hitoyoshi 581 425
Ushibuka 325 288
Akune 325 338
Miyazaki 395 288
Miyakonojo 636 343
Aburatsu 340 277
Kagoshima 418 304
Makurazaki 299 239
In the period from 11th to 14th July 2012, in the Northern Kyushu, heavy rain
fell on the northern part of Kyushu, Japan. The record-breaking heavy rain
(see Table 1.2) caused floods and landslides, especially in Kumamoto, Oita,
Fukuoka, and Saga Prefectures and some rivers reached the highest discharge
18
above the past largest recorded one [Haeseler, 2012]. Although these events
have not had evidence associated with global warming effect however as
anomaly events, this has interested some expert in conducting some
researchers by using data from this phenomenon to protect water environment
and its ecosystem in future.
19
1.4 THE PROBLEMS OF RECENT STUDY
1 Climate change is the main problems in this study. IPCC has reported in the 5th assessment report (AR5) [IPCC, 2013] that there is no doubt about global warming during the past and until the end of this century.
Related to the aquatic environment and its ecosystems global warming has the significant impact on each alteration of the aquatic environment.
2 Aquatic ecosystems are critical components of the global environment.
In addition to being essential contributors to biodiversity and ecological productivity. However, aquatic systems have been increasingly threatened, directly and indirectly.
3 There are some environmental problems in the aquatic system caused by climate change effects such as changes in seasonal patterns of precipitation and runoff will alter hydrologic characteristics of aquatic systems, affecting species composition and ecosystem productivity.
4 Climate change impact implies all component in an aquatic system due to populations of marine organisms are sensitive to shifts in the frequency, duration, and timing of extreme precipitation events, such as floods or droughts.
5 Increases in water temperatures as a result of climate change will alter fundamental ecological processes and the geographic distribution of aquatic species. Such impacts may be ameliorated if species attempt to adapt by migrating to suitable habitat.
6 Climate change is likely to alter interaction pattern between seawater and
freshwater system due to alteration of precipitation pattern and increasing
trend of sea surface level (SST). This condition implies the distribution
20
of the total river runoff that flowing in the coastal area.
7 The region of freshwater influence (ROFI) was promoted by Simpson (1997) is water interfaces area between seawater and freshwater, this region is vulnerable area to some environmental problems related to alteration of the aquatic system due to climate change phenomena.
8 ROFI is an important area in the aquatic environmental system due to it has a pivotal role in determining water quality in the coastal zone and shelf seas.
9 The sustainability of all organisms in an aquatic ecosystem is most depend on stirring process between seawater and freshwater in ROFI.
The freshwater that contains abundant nutrient from river runoff for all marine organisms will be affected if the interaction patterns between seawater and freshwater in this area is disturbed.
10 Related to the climate change impact on the aquatic ecosystem, alteration of precipitation trend and increasing trend of water temperature are two climate change indicators implicate to the ROFI condition.
11 Water stratification and change of baroclinic flow and its structure are some aquatic environment problems caused by the difference of water density, and its temperature is vulnerable in ROFI area.
12 Aquatic ecosystems have a limited ability to adapt to climate change, to reduce the likelihood of significant impacts to these systems.
13 Climate change impact on the aquatic environment and its ecosystem,
this is not simply because this global project involved many nations in
worldwide and it is needed political will from all governments to work
21
together to look for solutions and solve this problem. These include
maintaining riparian forests, reducing anthropogenic activity cause
global warming and greenhouse effect.
22
1.5 RESEARCH OBJECTIVES
According to some aquatic environmental issues related to climate change phenomena that mentioned above. The action to solve some problems have been done by many researchers and environment expert since climate change issue begin and become the global problem. However, considering the enormity of environmental challenges caused by climate change impact, the effort that has been done to date is still considered not enough. Therefore, by this research, we try to make some contribution by making some research assessment to solve some aquatic environmental problems especially in Region of Freshwater Influences (ROFI) related to climate change effect due to pivotal role ROFI to determine water quality in an aquatic environment.
By this research, we want to some assess to the ROFI physical condition after heavy rainfall occurs by using numerical simulations method such as:
1. To see how is heavy rainfall effect to alteration of physical condition of water in ROFI.
2. To see how extreme precipitation effect on the change of baroclinic flow and baroclinic structure in ROFI area.
3. To see how change of precipitation intensity effect to baroclinic flow and its structure in ROFI.
4. To see how different of water temperature between seawater and freshwater effect on baroclinic flow and Its structure related to precipitation extreme in ROFI
5.
To see how is the potential threat of water temperature alteration due to
climate change impact in ROFI.
23
1.6 DISSERTATION ORGANIZATION
This dissertation comprises of six chapter. The structure of the dissertation can be schematized as in Figure 1.10.
.
Figure 1.10 Dissertation organization CHAPTER 1 INTRODUCTION
CHAPTER 2 LITERATURE REVIEW
Chapter 3 Numerical Analysis of Extreme Flood
Events Effect on Baroclinic Flows in the
Ariake Sea, Japan
Chapter 4 Impact of Riverine Water Temperature on
Baroclinic Structure in
region of Freshwater
Influences (ROFI)
Chapter 6 The Threat of
Thermal Pollution Hazard
due to Climate Change in Region
of Freshwater Influences (ROFI)
Chapter 7 Conclusion
Chapter 5 Assessing
Effects of Temporal Changes in River Water Temperature on Stratification in the Ariake Sea
24
REFERENCES
Arnell, N. W. (1998). Climate Change and Water Resources in Britain. Climatic Change, 83-110.
Bates, B. Z. (2008). Climate Change and Water. Geneva: Technical Paper of the Intergovernmental Panel on Climate Change.
Blunden, J. (2015). State of the Climate in 2014. New York: American meteorologicAl Society.
Eaton, J. G., & Scheller, R. M. (1996). Effects of climate warming on fish thermal habitat in streams of the United States. The American Society of Limnology and Oceanography, 1109-1115.
Glick, P., Clough, J., & Nunley, B. (2010). Assessing the Vulnerability of Alaska’s Coastal Habitats to Accelerating Sea-level Rise Using the SLAMM Model:
A Case Study for Cook Inlet. Alaska: The National Wildlife Federation.
Haeseler, S. (2012). Heavy Rains on Kyushu/Japan. Frankfurte: Deutscher Wetterdienst.
IPCC. (2007). Climate Change 2007: Working Group I: The Physical Science Basis.
Zurich: IPCC.
IPCC. (2008). Observed changes in climate and their effects. In T. I. CHANGE, Climate Change 2007 Synthesis Report (pp. 30-32). Geneva: THE INTERGOVERNMENTAL PANEL ON CLIMATE CHANGE.
IPCC. (2014). Climate Change 2014: Synthesis Report. Geneva: Intergovernmental Panel on Climate Change.
IPCC, 2. (2014). Climate Change 2014: Synthesis Report. The contribution of Working Groups I, II and III to the Fifth Assessment Report of the Intergovernmental Panel on Climate Change. Geneva, Switzerland, 151 pp.: Intergovernmental Panel on Climate Change, 2015.
Japan Meteorological Agency. (2017, Mei 20). Japan Meteorological Agency. Retrieved from Annual Report on Atmospheric and Marine Environment
Monitoring Data:
http://www.data.jma.go.jp/gmd/env/data/report/data/index_e.html
Kampf, J. (2009). Ocean Modelling for Beginners Using Open-Source Software.
Berlin: Springer is part of Springer Science+Business Media.
Krishnan, M. S., & Sen, K. (2012, June 1). Modul 2 Basic Meteorology and Oceanography. Retrieved from National Programme on Technology Enhanced Learning: http://nptel.ac.in/courses/119102007/2#
25 Lull, & William, h. (1959). Soil compaction on forest and range lands. Washington,
D.C: Forest Service, U.S. Dept. of Agriculture.
Lynch, P. (2006). Weather Prediction by Numerical Process. Dublin: Cambridge University Press. Retrieved June 28, 2017, from https://pdfs.
semanticscholar.org/
Lynch, P. (2008). The origins of computer weather prediction and climate modeling.
Journal of Computational Physics, 3431–3444.
Meyer, J. L., & Edwards, R. T. (1990). Ecosystem Metabolism and Turnover of Organic Carbon along a Blackwater River Continuum. Washington, DC:
Ecological Society of America.
Muromtsev, A. M. (2010). Stratification of Water. Retrieved from The free dictionary by Farlex: http://encyclopedia2.thefreedictionary.com /Stratification+of+Water
NASA. (2017, June 19). The Water Cycle. Retrieved from Precipitation Education:
https://pmm.nasa.gov/education/contact
Poff, L. N., & Brinson, M. M. (2002). Aquatic ecosystems and Global Climate Change. Colorado: the Pew Center on Global Climate Change.
Rayner, N. A. (2006). Improved analyses of changes and uncertainties in sea surface temperature measured in situ since the mid-nineteenth century:
The HadSST2 dataset. JOURNAL OF CLIMATE, 446-469.
Schneeberger, C. (2003). Glaciers And Climate Change: A Numerical Model Study.
Zurich: Swiss Federal Institute of Technology Zurich.
Simpson, J. H. (1997). Physical processes in the ROFI regime. Journal of Marine Systems , 3-15.
Simpson, J. H., & Sharples, J. (2012). Introduction to the Physical and Biological Oceanography of Shelf Seas. New York: Cambridge University Press.
The survey, U. G. (2016, December 2). Precipitation: The Water Cycle. Retrieved from The Water Cycle - USGS Water Science School: http://water.
usgs.gov/edu/watercycleprecipitation.html
Techet, A. (2006, April 25). Geostrophic Currents. Retrieved from Massachusetts institute of technology: https://ocw.mit.edu/courses/mechanical- engineering/2-011-introduction-to-ocean-science-and-engineering-spring- 2006/readings/geostrophic.pdf
The climate reality project. (2015, August 18). Ten Clear Indicators Our Climate is Changing. Retrieved from The climate reality project:
26 https://www.climaterealityproject.org/blog/10-indicators-that-show-
climate-change
U.S. Department of the Interior | U.S. Geological Survey. (2016, December 2). The USGS Water Science School. Retrieved from U.S. Geological Survey Science for changing world: http://water.usgs.gov/edu/earthhowmuch.html
U.S. Environmental Protection Agency. (2014). Climate Change Indicators in the United States, 2014. New York: U.S. Environmental Protection Agency.
Vinnikov, K. Y., & Grody, N. C. (2003). Global Warming Trend of Mean Tropospheric Temperature Observed by Satellites. online: American Association for Advancement of Science. Retrieved March 24, 2017, from http://science.sciencemag.org/content/302/5643/269
27
CHAPTER 2
LITERATURE REVIEW
ABSTRACT
This chapter shows several previous researches related to our study. How the
impact of climate change to the aquatic environmental system is shown from some
research results that have been conducted by some experts, more than that, the study
about ROFI as the primary object of this study is discussed to show how its
vulnerary and potential threat due to climate change impact. The resulting study
about the heavy rainfall that caused flood and landslide in the Northern Kyushu at
the middle of 2012 is shown in this chapter, too. And to obtain the description in
detail, all research topic is discussed separately each other.
28
2.1 INTRODUCTION
The world is getting warmer [IPCC, 2014]. Currently, after climate change become a hot issue in some environmental experts meetings, the environmental study has been an interesting issue and inviting many researchers and the scientist group that involves and organized by the government organization, non-governmental organization (NGO) and many universities in the worldwide.
In the global environment, aquatic ecosystems are critical components. In addition to being essential contributors to biodiversity and ecological productivity, they also provide a variety of services for human populations.
However, aquatic systems have been increasingly threatened, directly and indirectly by global climate change (shown on Figure 2.1) [Poff,
Brinston, 2002].In a marine aquatic environment, the region of freshwater influences (ROFI)
which proposed by Simpson has an important role to determine the condition
of the marine environment and ecosystem [Simpson, 1997]. All ROFI systems
in the distinctive feature are the input of the significant amount of buoyancy
from river runoff [Simpson, 1997]. However, the climate change impact on
ROFIs has not been discussed, yet.
29
2.2 CLIMATE CHANGES IMPACT ON MARINE SYSTEM STUDIES
The study that discusses climate change impact on the marine system is the most popular theme that conducted by many aquatic environmental experts.
The marine environmental research related to climate change impact has done by many researchers in many themes and topics in order to assess an aquatic environmental quality by using some climate change indicators such as rising trend of temperature at the surface over the sea and land, sea level rise, extreme event, and so on [U.S. Environmental Protection Agency, 2014].
Many studies argue if the phenomena of climate change have the strong influence on the seasonal of precipitation pattern [Miranda et al., 2011]. For example, the increasing temperature over an ocean as one of the indicators of climate change has implications for increasing rate of evaporation that occurs on the sea surface, this condition gives an impact on the precipitation [Trenberth, 2011], and it will affect to each step of the hydrologic cycle.
Precipitation in meteorology term is a result of the condensation of atmospheric water vapor that falls under gravity influence. The drizzle, rain, sleet, snow, and hail are main forms of precipitation. Precipitation occurs when a portion of the atmosphere becomes saturated with water vapor so that the water condenses and precipitates. Most precipitation falls as rain [Trenberth, 2011].
Precipitation is a crucial component of how water moves through Earth's water cycle, connecting the ocean, land, and atmosphere [NASA, 2017]. Precipitation is responsible for depositing most of the freshwater on the planet.
Approximately 505,000 km
3of water falls as precipitation each year, 398,000 km
3of it over the oceans. Given the Earth's surface area, that means the globally averaged annual precipitation is 990 mm [Wikipedia, 2017].
Trends in precipitation are always consistent with changes in runoff [Trenberth,
2011]. The seasonal pattern of precipitation falling on a watershed is translated
into the surface water that feeds into streams. In ecological terms, the extremes
of runoff are critical events that influence species composition and the
productivity of aquatic and wetland communities [Poff,
Brinston, 2002]..
30
Precipitation is high enough to sustain year-round flow in streams. Thus, the knowledge of the particular regional changes in stream flow regimes brought about by climate change is critical to anticipating ecological impacts. Some projections are reasonably well supported, and others need to be considered as possible scenarios to evaluate the range of ecological concerns related to a changing climate (see Figure 2.1) [Poff,
Brinston, 2002].Figure 2.1 Linkages between climate change and environmental drivers of temperature and precipitation that regulate many ecological processes and patterns in
inland freshwater and coastal wetland ecosystems.
[Poff, Brinston, 2002]
Estuaries are naturally productive, supporting abundant fisheries also different habitats, including shellfish reefs, ocean grass meadows, what's more, limitless expanses for fringing marshes [Levinton, Doall, Ralston, 2011]. Like the climate, estuaries are infrequently in a steady state, even under existing weather patterns. In general, water reflects the physical condition of an area, including the underlying geology and subsequent geomorphology, and the long-term driving forces such as a climate. Alteration in the atmosphere beyond the natural, historical patterns (as may happen due to climate change) will be subsequently reflected in the estuary [Glamore, Rayner, Rahman, 2016].
Estuarine conditions are inherently connected to and influenced by, climate
Precipitation Regime Runoff Regime
Aquatic Ecosystem Responses
Organism metabolism Geographic range of species Water quality
Climate Change
Air Temperature
Water Temperature
Human Activity
31
factors operating over a range of temporal scales. Precipitation patterns and river runoff, temperature, evaporation, radiation, and the wind, along with numerous additional forcing factors, have implicate to the geophysical and biological nature of estuarine landforms, environments and natural communities [Glamore, Rayner, Rahman, 2016]. Imbalances between annual rainfall and heat (temperature and evaporation) can result in climatic extremes, particularly in areas with intense rainfall seasonality. This can dramatically alter the hydrology and salinity throughout an estuary as freshwater inflows influence the tidal processes.
In estuaries, climate change impact will alter nutrition cycle and behavior through modifications to temperature, wind patterns, the hydrological cycle, and sea level rise [Statham, 2011]. They cause the alteration in some impacts such as inundation of freshwater framework, change in stratification, flushing times and phytoplankton productivity, increased coastal storm activity, changes in species and ecosystem function [Statham, 2011].
Climate change influence the vulnerability of estuaries to eutrophication in several ways, including changes in mixing characteristics caused by alterations in freshwater runoff, and changes in temperature, sea level, and exchange with the coastal ocean [Najjar et al., 2000]. A direct effect of changes in temperature and salinity may be seen through changes in suspension feeders such as mussels, clams, and oysters. The abundance and distribution of these consumers may change in response to new temperature or salinity regimes, and they can significantly alter both phytoplankton abundance and water clarity [National Research Council (NRC), 2000].
The increasing trend of water temperature is the main of climate change
indicator that has the significant effect on aquatic organisms. Temperature and
moisture regimes are the key variables that determine the distribution, growth
and productivity, and reproduction of plants and animals. Changes in hydrology
can influence species in a variety of ways, but the most completely understood
processes are those that link moisture availability with intrinsic thresholds that
govern metabolic and reproductive processes [Burkett et al., 2005].
32
There are several climate change impacts on abiotic change such as biological performance, chemistry changes, changes in temperature for the performance and survival of many organisms, ocean circulation, distributional shifts and finally, synergistic effects between climate [Harley et al., 2006]. The alteration of abiotic has consequences on climate that related to water quality variables such as CO and pH level.
In order to anticipate the climate change impact on the coastal marine system
is needed to establish the marine protected areas to understand and determine
the all ecologists process must such as: when, where, and how the role of any
given climatic driver is dependent upon other forcing variables [Harley et al.,
2006].
33
2.3 THE ROFI RESEARCH
The ROFI term was introduced in the first time by Simpson (1993) is the part of the coastal area where the freshwater from river runoff contributes a significant input of buoyancy to those parts of the shelf seas adjacent to estuaries [Simpson, 1997]. The buoyancy input is responsible for producing a physical regime which is radically different from the other parts of the shelf seas. In the ROFI, interaction process from two kinds of water from estuarine and Shelf Sea creates a complex water regime
In the marine system, ROFI has a significant role to determine the quality of aquatic environmental condition due to the existence of ROFI role in managing nutrient runoff under the river flow [Simpson, Sharples, 2012]. The river runoff contaminants that come from estuary will affect to this region, furthermore impact on the shelf sea environment. It is also in ROFIs that river-borne particulate matter is initially deposited and frequently re-suspended. Land- derived inputs frequently maintain high nutrient concentrations in ROFIs with attendant dangers of nuisance blooms which may be toxic and eutrophication which may result in hypoxia. The proper management of these problems, and of the pollution threats posed by heavy metals and xenobiotic, will depend on our understanding and modeling of the ROFI.
This baroclinic flow acts to induce stratification of the water column of the ROFI in competition with the stirring processes. It is the interaction of this buoyancy forcing with the stirring mechanisms provided by tides, wind, and waves, and worked out in a variety of different topographic settings, which provides the necessary subtlety and variety of ROFI.
According to schematic of the characteristic regimes of the shelf, estuary, and
ROFI by Simpson, ROFI characteristic in water column located between
estuary (freshwater) and water mixed nature (see Figure 2.2). In estuary
characteristic is dominated by freshwater, therefore, stratification of water is
not found in here caused by differences in water density. This condition almost
related same with the characteristics of water in the mixed zone, where the
34
![Table 1.1 Projected global average surface warming and sea level rise at the end of the 21st century [IPCC, 2007]](https://thumb-ap.123doks.com/thumbv2/123deta/9917479.1919187/29.892.240.789.651.902/table-projected-global-average-surface-warming-level-century.webp)


![Figure 2.2 Schematic of the characteristic regimes of shelf, estuary and ROFI [Simpson, 1997]](https://thumb-ap.123doks.com/thumbv2/123deta/9917479.1919187/51.892.240.730.244.432/figure-schematic-characteristic-regimes-shelf-estuary-rofi-simpson.webp)
![Figure 3.2 Tide and runoff from A-class rivers from 6th-26th July 2012 [Japan Ministry of Land Infrastructure Transport and Tourism, 2012]](https://thumb-ap.123doks.com/thumbv2/123deta/9917479.1919187/68.892.300.652.728.1015/figure-runoff-rivers-japan-ministry-infrastructure-transport-tourism.webp)

