Novel Methodology and its Applications to
Intermolecular Interaction Studies Using
Two-Dimensional Correlation Spectroscopy
学位名
博士(工学)
学位授与機関
関西学院大学
学位授与番号
34504乙第385号
Novel Methodology and its Applications to
Intermolecular Interaction Studies Using
Two-Dimensional Correlation Spectroscopy
A Thesis for the Degree
Of
Doctor of Science
Submitted to
School of Science and Technology
Kwansei-Gakuin University
By
Anqi He
Supervisor: Prof. Yukihiro Ozaki
Contents
Abstract ... 1
Preface ... 3
1. Background of Two–Dimensional Correlation Spectroscopy ... 4
2. Construction of Two–Dimensional Correlation Spectra ... 5
3. The development of Orthogonal Sample Design (OSD) and Related Techniques... 7
4. Other Developments in Two-Dimensional Correlation Spectroscopy ... 14
4.1. Chemometrics-Combined Two-Dimensional Correlation Spectroscopy ... 15
4.2. Moving-Window Two-Dimensional Analysis (MW2D) ... 16
5. Applications of Two-Dimensional Correlation Spectroscopy ... 18
6. Outline of Each Chapter ... 18
References ... 20
Chapter 1 A Novel Method of Constructing Two-Dimensional Correlation Spectra without Subtracting a Reference Spectrum ... 56
Significance of Enhancing Signal of Cross Peaks ... 57
Experimental ... 58
Results and Discussion ... 58
Conclusion ... 67
References ... 68
Supporting Information 1 ... 82
Chapter 2 Investigation on the Behavior of Noise in Asynchronous Spectra in Generalized Two-Dimensional (2D) Correlation Spectroscopy and Application of Butterworth filter in the Improvement of Signal-to-Noise ratio of 2D Asynchronous Spectra ... 92
Significance of reduction of noise ... 93
Methods ... 94
Results and Discussion ... 94
References ... 102
Supporting Information 2 ... 119
Chapter 3 Investigation on Intermolecular Interaction between Berberine and β-cyclodextrin using 2D Asynchronous Spectra ... 126
Background ... 127
Results and Discussion ... 128
Conclusion ... 131
References ... 132
Supporting information 3 ... 142
Chapter 4 Investigation on Intermolecular Interaction between Two Solutes where One Solute Occurs in Two States ... 143
Introduction ... 144
Establishment of a model system ... 144
Results and Discussion ... 147
Conclusion ... 154
Supporting Information 4 ... 169
Chapter 5 Preparation and Characterization of Lanthanum Carbonate Octahydrate for the Treatment of Hyperphosphatemia ... 172
Introduction ... 173
Experimental ... 174
Results and discussion ... 175
Conclusion ... 177
References ... 177
Acknowledgments ... 188
1
Abstract
The thesis has two parts. The first part is a novel methodology and its applications to intermolecular interaction studies using two-dimensional correlation spectroscopy. In orthogonal sample design (OSD) and related techniques used in two-dimensional correlation spectroscopy (2DCOS), the cross peaks can reliably reflect intermolecular interaction between two solutes dissolved in the same solvent. Subtle changes of the absorption peaks of the two solutes can be revealed by characteristic patterns of cross peaks in 2D correlation spectra generated via OSD and relevant techniques. It can help us to understand on the nature of intermolecular interaction.
When weak intermolecular interaction is investigated, the cross peaks are quite vulnerable to noise. Thus, improving signal-to-noise level of 2DCOS spectrum used in such investigation is important. In order to solve the problem, a new approach is proposed to construct 2D asynchronous spectrum without subtracting a reference spectrum. This approach is effective in enhance the intensities of cross peaks. Under investigation on weak intermolecular interaction, in some cases, enhancing the intensities of the cross peaks alone is not enough, and some additional step should be taken to suppress the effect of noise. Butterworth filter is used to reduce the standard deviation of noise. A new strategy is proposed to reduce the noise on one hand and control signal distortion on the other hand. Another current issue is that application of 2DCOS spectra using the OSD techniques have not been extensively exploited. Convincing illustrative example of the utility and merit of this technique must be presented. 2D asynchronous spectrum is applied to investigate intermolecular interaction between berberine and β-CyD. The occurrence of cross peaks around (420 nm, 420 nm) in 2D asynchronous spectrum reveals that intermolecular interaction indeed exists between berberine and β-CyD. The behaviors of cross peaks demonstrate that berberine enter the hydrophobic cavity of β-CyD. The above spectral results are helpful in understanding why the solubility of berberine is enhanced by β-CyD.
Moreover, the doubly asynchronous DAOSD approach is adopted to study intermolecular interaction between two solutes dissolved in the same solution. In the system, one solute occurs in two exchangeable states. In this case, cross peaks in 2D asynchronous spectra may still reflect intermolecular interaction reliably. However, it should also be noted that certain cross peaks can still be produced even if intermolecular interaction do not bring about any changes on the characteristic peaks of solutes. These cross peaks are related to the variations of chemical systems caused by intermolecular interaction at a network level.
The second part of the thesis is the preparation and characterization of lanthanum carbonate octahydrate for the treatment of hyperphosphatemia. Lanthanum carbonate is an ideal phosphate binder. It can be utilized as phosphate binder for renal failure patients. A new approach is proposed to prepare lanthanum carbonate via reactions between lanthanum chloride and NaHCO3. In the reaction, small amount of NaHCO3
solution was firstly added into the acidic solution of lanthanum chloride to generate lanthanum carbonate nuclei and then NaHCO3 is added into the lanthanum chloride at
2
reaction take place simultaneously. Consequently, lanthanum carbonate is produced at low pH environment (the pH value is below 4.5) so that the risk of generating lanthanum carbonate hydroxide is reduced.
Keywords: two-dimensional correlation spectroscopy; Butterworth filter;
3
Preface
This thesis consists of two parts: the first part is novel methodology study and its application to intermolecular interaction studies of two-dimension correlation spectroscopy (2DCOS). The second part is on the preparation and characterization of lanthanum carbonate octahydrate for the treatment of hyperphosphatemia.
In the first part, the thesis is mainly focused on development of the methodology of 2DCOS to study weak intermolecular interactions between two solutes dissolved in the same solutions. The 2DCOS is a very powerful analytical technique. It has been applied in many fields. In many cases, only weak intermolecular interaction occurs and the relevant cross peaks are quite weak in the resultant 2D correlation spectra. Consequently, noise in 2D correlation spectra often brings about significant interference on the identification of weak cross peaks that are related to weak intermolecular interactions. The author addressed the problem from the aspects of enhancing the intensities of cross peaks and reduction of noise by using novel approach to construct 2D spectra and Butterworth filter.
In some systems, a solute that take part in intermolecular interaction may occur in two exchangeable states such as conformational changes, etc. This situation may bring about additional complexity in the resultant 2D asynchronous spectrum. The author investigate the spectral behavior of a pair of 2D asynchronous spectra, which extend the application of 2D correlation spectroscopy to much broader applications.
Berberine is a Chinese traditional medicine, which has many new pharmaceutical functions in medical researches. Unfortunately, the low solubility of berberine poses a limitation to the broader application in medical practice. An effective way to increase its solubility is to introduce suitable excipient. The author investigated the interaction between berberine and β-cyclodextrin (β-CyD) by using 2DCOS. The spectral behavior from cross peaks in 2D asynchronous spectrum is helpful in understanding why the solubility of berberine is enhanced by β-CyD. The result support that 2DCOS may become a new method to selecting the optimized excipients.
In the second part of the thesis, the author developed an approach to produce lanthanum carbonate that can be used in the treatment of hyperphosphatemia of renal failure patients.
The novelty of this thesis can be described as follows:
In chapter 1, the author proposed a new approach to construct 2D asynchronous spectrum without subtraction of a reference spectrum. This approach is effective in enhance the intensities of cross peaks.
In chapter 2, the author proposed to use the Butterworth filter to reduce the standard deviation of noise. A new strategy is proposed to reduce the noise on one hand and control signal distortion on the other hand.
In chapter 3, the author applied 2D asynchronous spectrum to investigate intermolecular interaction between berberine and β-CyD. The occurrence of cross peaks around (420 nm, 420 nm) in 2D asynchronous spectrum reveals that specific intermolecular interaction indeed exists between berberine chloride and β-CyD. The behaviors of cross peaks demonstrate that berberine enter the hydrophobic cavity of
β-4
CyD. The above spectral behavior is helpful in understanding why the solubility of berberine is enhanced by β-CyD.
In chapter 4, the author adopted the DAOSD approach to study intermolecular interaction between two solutes dissolved in the same solution. In the system, one solute occurs in two exchangeable states. In this case, cross peaks in 2D asynchronous spectra can still reflect intermolecular interaction reliably. It should be noted that cross peaks can still be produced even if intermolecular interaction do not bring about any changes on the characteristic peaks of solutes. These cross peaks are related to the variations of chemical systems caused by intermolecular interaction at a network level.
In the second part of the thesis, a new approach is proposed to prepare lanthanum carbonate via reactions between lanthanum chloride and NaHCO3. In the reaction, small
amount of NaHCO3 solution was firstly added into the acidic solution of lanthanum
chloride to generate lanthanum carbonate nuclei and then NaHCO3 is added into the
lanthanum chloride at a constant speed. This approach makes both precipitation reaction and neutralization reaction take place simultaneously. Consequently, lanthanum carbonate is produced at low pH environment (the pH value is below 4.5) so that the risk of generating lanthanum carbonate hydroxide is reduced.
1. Background of Two–Dimensional Correlation Spectroscopy
A novel idea was put forward in the field of NMR spectroscopy about 40 years ago that, by spreading spectral peaks over the second dimension, one can simplify the visualization of complex spectra consisting of many overlapped peaks.1-5 It became
possible for the spectral intensity to be obtained as a function of two independent spectral variables. Two-dimensional (2D) NMR has greatly expanded the scope of application, especially in the solution of protein and other biological macromolecules. Following this conceptual breakthrough, an impressive amount of progress has been made in the branch of science now known as 2D spectroscopy.
2D NMR technology provides a good support for the representation of complex systems. Unfortunately, the technology cannot be applied to other common optical spectroscopic techniques. The common optical spectroscopy techniques, such as IR, Raman, and ultraviolet–visible (UV–vis) are governed by physical phenomena having time scales which are very different from those of NMR.5 The characteristic time scale
of molecular vibrations observed in IR absorption spectroscopy is on the order of picosecond, compared to the micro to millisecond ranges usually encountered in NMR.5
In NMR, a set of time-domain data collected after double Fourier transformed under multiple-pulse excitations generates 2D spectra.1-5 Direct adaptations of such a
procedure based on pulsed excitations to conventional vibrational spectroscopy was rather difficult several decades ago. Nowadays, it has become possible to conduct certain experiments based on ultrafast femtosecond optical pulses in a fashion analogous to pulse-based 2D NMR experiments.6-11 However, such measurements are
still in their infancy. The commercial IR spectrometers cannot adequately provide rapid excitation and detection of vibrational relaxation responses to carry out such measurements. Thus, the specific experimental procedure of 2D NMR had to be fundamentally modified before being applied to practical optical spectroscopy.5
5
The basic concept of perturbation-based 2D IR correlation spectra was proposed first by Noda in 1986.12-14 Noda considered the multiple-pulse excitations in 2D NMR
spectroscopy as a perturbation to the system. Therefore, a simple cross-correlation analysis was applied to sinusoidally varying dynamic IR signals to obtain a set of 2D IR correlation spectra. This 2D IR correlation spectroscopy has been successful in the study of samples stimulated by a small-amplitude mechanical or electrical perturbation.5
The major shortcomings of the above 2DCOS approach was that the small-amplitude perturbation must be sinusoidal to effectively employ the original data analysis scheme. To overcome this limitation, Noda proposed generalized 2DCOS in 1993.5, 15 The mathematical procedure to yield 2DCOS spectra was modified to handle
an arbitrary form of variable dependence much more complex than simple sinusoidally varying time-dependent spectral signals. The generalized 2DCOS scheme lifted the constraint of the perturbations and excitation types. As a result, perturbations can be a variety of physical origins, such as mechanical, electrical, temperature, pH, concentration, biological, etc..16-63 The type of spectral signals analyzed by the newly
proposed 2D correlation method became virtually limitless, which broaden possible applications to various fields among IR, Raman, X-ray, UV–vis, fluorescence, even to fields outside of spectroscopy.16, 20, 23-27, 29-31, 33-37, 39-43, 45, 48-56, 58-60, 62, 64-98 At the same
time, hetero-spectral correlation can be constructed by 2DCOS, among different spectroscopic techniques, such as 2D-IR-Raman correlation spectra, 2D-XRD-Raman correlation spectra.24, 33, 39, 42, 45, 48, 62 Therefore, 2DCOS is truly revolutionized in the
field of vibrational spectroscopy.
2. Construction of Two–Dimensional Correlation Spectra
Figure 1-1 shows the general scheme for constructing 2DCOS spectra.15
In 2DCOS, an additional external perturbation is applied to the system during the spectroscopic measurement. This external perturbation stimulates the system to cause some selective changes in the state, order, surroundings, etc. of system constituents. The response of the stimulated system to the applied external perturbation leads to distinctive changes in the spectrum. This spectral variation induced by an applied perturbation is called a dynamic spectrum.5
The dynamic spectrum of a system is defined as:
ỹ(𝜈, 𝑡) = {y(𝜈, 𝑡) − y̅(𝜈) for: 𝑇min ≤ 𝑡 ≤ 𝑇max
0 otherwise (1-1) where y(ν, t) is a perturbation-induced variation of a spectral intensity during a fixed interval of some external variable t between Tmin and Tmax. The external variable
t in many cases is not only the chronological time, but also can be any other reasonable
measure of a physical quantity, such as temperature, concentration, voltage, etc.. The variable ν can be any appropriate spectral index used in the field of spectroscopy. 𝑦̅(𝜈)is the reference spectrum.5 It is customary to set 𝑦̅(𝜈) to be the averaged spectrum given by:
6 𝑦̅(𝜈) = 1 𝑇max− 𝑇min∫ 𝑦(𝜈, 𝑡)dt 𝑇max 𝑇min (1-2) The generalized 2DCOS function given below
𝚽(𝜈1, 𝜈2) + 𝑖𝚿(𝜈1, 𝜈2) = 1 𝜋(𝑇max− 𝑇min)∫ 𝑌̃1(𝜔) ⋅ 𝑌̃2 ∗(𝜔)d𝜔 ∞ 0 (1-3) where the real part Φ(v1, v2) and the imaginary part Ψ(v1, v2) are the synchronous
correlation spectra and asynchronous correlation spectra, respectively. The term 𝑌̃1(𝜔) is the forward Fourier transform of the spectral intensity variations ỹ(𝜈1, 𝑡) observed
at a given spectral variable ν1 with respect to the external variable t. The conjugate of
the Fourier transform 𝑌̃2∗(𝜔) of the spectral intensity variation ỹ(𝜈
2, 𝑡) is observed at
another spectral variable ν2.5
By applying the well-known Wiener–Khintchine theory,99 the synchronous
2DCOS spectrum can be directly computed as: 𝚽(𝜈1, 𝜈2) = 1
𝑇max− 𝑇min∫ ỹ(𝜈1, 𝑡) ⋅ ỹ(𝜈2, 𝑡)dt
𝑇max
𝑇min
(1-4) The manipulation of a classical cross-correlation function of dynamic spectra constructs only a synchronous 2DCOS spectrum. In order to circumvent the use of the Fourier transformation of dynamic spectra, Noda developed provides a reasonable estimate of an asynchronous 2D correlation spectrum in 2000.5, 100 He introduced the
time-domain Hilbert transform into the calculation of asynchronous correlation spectra. The asynchronous correlation spectrum is shown as
𝚿(𝜈1, 𝜈2) = 1 𝑇max− 𝑇min ∫ ỹ(𝜈1, 𝑡) ⋅ z̃(𝜈2, 𝑡)dt 𝑇max 𝑇min (1-5) where z̃(𝜈2, 𝑡) is the time-domain Hilbert transform of the dynamic spectrum ỹ(𝜈2, 𝑡) shown as: z̃(𝜈2, 𝑡) = 1 𝜋pv ∫ ỹ(𝜈2, 𝑡′) 𝑡′− 𝑡 +∞ −∞ dt′ (1-6)
The practical numerical computation methods for synchronous and asynchronous 2DCOS spectra.5, 15, 100, 101 It can be written as:
𝚽(𝜈1, 𝜈2) = 1 𝑚 − 1ỹ(𝜈1) Tỹ(𝜈 2) (1-7) 𝚿(𝜈1, 𝜈2) = 1 𝑚 − 1ỹ(𝜈1) T𝐍ỹ(𝜈 2)
where m is the number of 1D spectra to construct the 2DCOS spectrum, ỹ(𝜈𝑛) is the
7 N𝑖𝑗 = 1 𝜋 [ 0 1 1 2 1 3 … −1 0 1 1 2 … −1 2 −1 0 1 … −1 3 − 1 2 −1 0 … … … … … …]𝑚 (1-8)
Figure 1-2A shows a typical synchronous 2DCOS spectrum.5, 14 A synchronous
spectrum is a symmetric spectrum with respect to a diagonal line corresponding to coordinates. Correlation peaks appear at both diagonal and off-diagonal positions. The intensity of peaks located at diagonal positions mathematically corresponds to the autocorrelation function of spectral intensity variations observed. Therefore, the diagonal peaks are referred to as autopeaks, which is always positive. The magnitude of an autopeak intensity represents the overall extent of spectral intensity variation observed at the specific spectral variable ν during the observation interval between Tmin
and Tmax. Thus, any region of a spectrum which changes intensity to a great extent under
a given perturbation will show strong autopeaks.
Cross peaks located at the off-diagonal positions of a synchronous 2D spectrum represent simultaneous or coincidental changes of spectral intensities observed at two different spectral variables ν1 and ν2. The sign of cross peaks can be either positive or
negative. Such a synchronized change, in turn, suggests the possible existence of a coupled or related origin of the spectral intensity variations. It is often useful to construct a correlation square joining the pair of cross peaks located at opposite sides of a diagonal line drawn through the corresponding autopeaks to show the existence of coherent variation of spectral intensities at these spectral variables.
Figure 1-2B shows an example of an asynchronous 2DCOS spectrum.5, 14 The
asynchronous spectrum is antisymmetric with respect to the diagonal line. Autopeak occurs on a 2D asynchronous spectrum. That is to say, 2D asynchronous spectrum consists exclusively of cross peaks located at off-diagonal positions. The cross peaks in an asynchronous spectrum develop only if the intensities of two spectral features change out of phase with each other (i.e., delayed or accelerated if time is the external variable). This property is especially useful in differentiating overlapped bands arising from spectral signals of different origins.
3. The development of Orthogonal Sample Design (OSD) and
Related Techniques
This thesis is based on orthogonal sample design (OSD) and related techniques, which were introduced by Xu et al.20, 26, 37, 40, 72, 79, 80, 93, 102-120 Herein we give a brief
introduction of OSD approach and its development.
Intermolecular interactions, which occur ubiquitously in nature, have been the focus of extensive research interests, as they lie at the center of many physical, chemical,
8
and biological processes including molecular recognition and molecular catalysis. Over the past several decades, various methods have been utilized to characterize intermolecular interactions.121-125 Among those approaches, molecular spectroscopic
methods possess great potential. For example, the variation in frequency and bandwidth of OH/NH stretching bands in infrared (IR) and Raman spectra provides a sensitive probe to monitor the formation and change of hydrogen bonds.126-137 However, many
intermolecular interactions, such as dipole–dipole interaction, albeit quite strong, can induce only subtle spectral changes that are often buried within complex spectral profiles. Consequently, it is quite difficult to investigate these intermolecular interactions directly by using conventional spectroscopic methods.
The advent of two-dimensional (2D) correlation spectroscopy provides a new avenue to study intermolecular interactions. Two-dimensional correlation spectroscopy is a powerful spectral analysis technique based on the analysis of a set of spectral data, which are sequentially obtained under some form of perturbation applied to the sample. Many important spectral features that are not readily accessible in the original set of one-dimensional spectra can be clearly visualized in the 2D spectra.
For example, the cross-peaks in a 2D synchronous spectrum can be used to characterize intermolecular interactions. A system containing two substances is considered here. The two substances are denoted as P and Q. The spectral coordinate of a characteristic peak from P is given by XP, and that from Q is XQ. The occurrence of a
cross-peak at (XP, XQ) in the 2D synchronous spectrum indicates that the responses of
spectral intensities at XP and XQ vary in a synchronous or coordinated manner under
the external perturbation. In principle, this synchronous behavior of spectral intensities may sometimes suggest the presence of intermolecular interaction between P and Q. However, interfering cross peaks due to other sources of synchronicity, such as concentration variations of solutes, also arise. Consequently, cross peak may appear at (XP, XQ) in the corresponding 2D synchronous spectrum even if there is no
intermolecular interaction between P and Q. This problem makes it difficult to directly use the cross-peaks in a 2D synchronous spectrum as a reliable criterion to judge whether intermolecular interaction actually occurs or not.
The work of Yu is quite heuristic to address the problem. In his work, Yu and his co-worker demonstrated that intermolecular interaction can be reflected by the spectral signals that are systematic deviated from the Beer-Lambert law.121 This work conferred
a solid physical basis to use 2D correlation spectra to study intermolecular interaction. Inspired by Yu’s work, Xu and his co-worker proposed an orthogonal sample design (OSD) scheme to reflect intermolecular interaction using cross peaks in 2D synchronous spectrum is a reliable manner.
Xu and his coworker study intermolecular interaction between two solutes (denoted as P and Q) dissolved by the same solvents. They use concentration of P and Q as external perturbations. The advantage of this selection is two folds: 1) The relationship between the perturbation and dynamic data becomes simple and can be expressed mathematically in a straightforward manner. 2) The spectral behavior is controllable. This approach provides an opportunity to tailor the dynamic data by designing suitable concentration series to control the information content of the 2D
9
synchronous spectra.
Xu et al. used a model system to express the idea of the OSD approach. To investigate intermolecular interaction between P and Q, a series of solution containing different amount of P and Q are prepared and the spectra of these solutions are recorded. Then a 2D synchronous spectrum is generated via the obtained spectra.
In the obtained spectra, Xu et al assumed that: (1) No spectral overlapping occurs between the characteristic peak of P at XP and the characteristic peak of Q at XQ. (2)
Solvent has no spectral contribution to the characteristic peak of P and that of Q. When P and Q co-exist in the same solution and intermolecular interaction occur between P and Q. The absorbance at XP and XQ can be express as:
A𝑖P(XP) = 𝜀PLCP𝑖 − δP𝑖(XP, CP𝑖, CQ𝑖)
(1-9) A𝑖Q(XQ) = 𝜀QLCQ𝑖 − δQ𝑖 (XQ, CP𝑖, CQ𝑖)
where εP is the molar absorptivity of P at XP, while εQ is that of Q at XQ. L is the
path length of the solution, and CP𝑖 and C
Q𝑖 are the concentrations of P and Q in the ith
spectrum, respectively. δP𝑖(X
P, CP𝑖, CQ𝑖 ) and δ𝑖Q(XQ, CP𝑖, CQ𝑖) are the deviation terms
that can be used to characterize the intermolecular interactions between P and Q. Then, the series of spectra were used to construct a 2D synchronous spectrum and the expression of 2D synchronous spectrum at (x,y) is composed of two parts:
(XP, XQ) = 1 𝑚 − 1[𝐌(XP, XQ) + 𝐍(XP, XQ)] (1-10) Where 𝐌(XP, XQ) = − ∑[𝜀PLC̃P𝑖δ̃Q𝑖 (XQ, CP𝑖, CQ𝑖 ) + 𝜀QLC̃Q𝑖δ̃P𝑖(XP, CP𝑖, CQ𝑖 ) 𝑚 𝑖=1 − δ̃P𝑖(XP, CP𝑖, CQ𝑖)δ̃Q𝑖 (XQ, CP𝑖, CQ𝑖 )] (1-11) 𝐍(𝑥, 𝑦) = 𝜀P𝜀QL2∑ C̃ P𝑖C̃Q𝑖 𝑚 𝑖=1
The first term M(XP, XQ) contains the excess terms, δ̃P𝑖(XP, CP𝑖, CQ𝑖 ) and
δ̃Q𝑖 (XQ, CP𝑖, CQ𝑖 ), which can be nonzero when intermolecular interactions exist between P and Q. That is to say, M(XP, XQ) reflects intermolecular interaction in the form of the
deviation from the Beer–Lambert law. The second term N(XP, XQ) is just related to the
concentration of the solutes and has nothing to do with intermolecular interaction between the two solutes.
If no intermolecular interactions occur between P and Q, then both δ̃P𝑖(X
P, CP𝑖, CQ𝑖 )
and δ̃Q𝑖 (X
10
M(x,y)=0 (1-12)
Combining eq. 1-10 and 1-12, we obtain
(x,y)= N(x,y) (1-13)
For a 2D synchronous spectrum that is designed to reflect intermolecular interactions properly, it is desirable for (XP, XQ) to be zero when there is no
interaction between P and Q. Thus, N(XP, XQ) has to be zero.
From eq. 1-11, it is quite clear that N(XP, XQ) may be nonzero if the concentrations
of P and Q are selected arbitrarily. Thus, something should be done on the design of the concentration series of P and Q to make the value of N(XP, XQ) to be zero.
Xu et al. noticed that N(XP, XQ) could be written as a dot product of two vectors
𝐂̃⃗P(init) and 𝐂̃⃗Q(init).
𝐍(XP, XQ) = 𝜀P𝜀QL2𝐂̃⃗P(init)⋅ 𝐂̃⃗Q(init). (1-14) According to the basic properties of a vector dot product, a feasible way to make the value of N(XP, XQ) be zero is that the vector 𝐂̃⃗P(init) is orthogonal to the vector
𝐂̃⃗Q(init).
(C̃⃗⃗P(init))T𝐂̃⃗Q(init) = 0 (1-15)
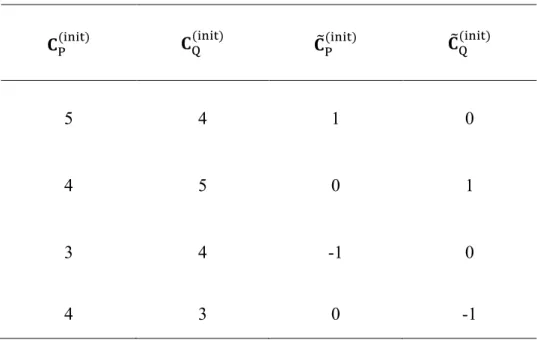
Table 1-1 provide an example of concentration series of P and Q that satisfies eq.
1-15.
This is the basic idea of the OSD approach.
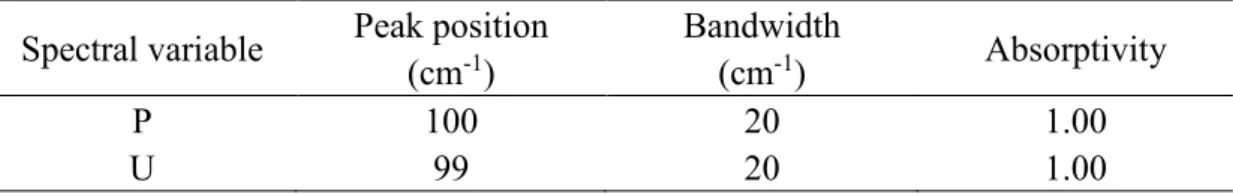
Xu and his coworkers have used the OSD approach on a couple of chemical system. For example, they investigated weak coordination between Pr3+ and carbonyl group of
butanone.40 Cross peaks indeed appear in the 2D synchronous spectrum generated using
the OSD approach (Figure 1-3A). For comparison, they performed a negative control experiment (Figure 1-3B). In this experiment, Pr3+ and butanone are spatially separated,
thereby excluding the possibility interaction occur between Pr3+ and butanone. Spectra
of Pr3+ and butanone are recorded separated. Afterward, the spectra of Pr3+ and
butanone added to “synthesized” spectra of Pr3+/butanone mixture. The obtained
“synthesis” spectra are used to generate 2D synchronous spectrum via the OSD approach. In this case cross peak does not appear, demonstrating the effectiveness of the OSD approach.
Nowadays, multiple dimensional NMR have been extensively used. The key point in the approach is designing of suitable pulse sequences. Via this way, irrelevant signals are removed so that physicochemical features that the users are concerned appear as cross peaks in multiple dimensional NMR spectra.
In 2DCOS, Xu and his co-worker adopted a strategy: Construction of 2D correlation spectra via designing of concentration series. They hope this approach is helpful to enhance the understanding on intermolecular interaction.
11
Based on Mathematical analysis, Li and Xu demonstrated that it is not practically feasible to remove interference portion completely from 2D synchronous spectrum when the characteristic peaks of P and Q are overlapped.114
To a considerable extent, this limitation restricts the extensive application of the OSD approach in real chemical systems. To solve the problem, Xu and his co-worker developed Asynchronous Orthogonal Sample Design (AOSD) approach.114
In this approach, cross peaks in 2D asynchronous spectrum rather than 2D synchronous spectrum are used to reflect intermolecular interaction between two solutes (P and Q) dissolved in the same solution.
Li and Xu demonstrated that interference part that are difficult to be completely removed in 2D synchronous spectrum can be completely eliminated using the basic mathematical properties of the Hilbert-Noda matrix. As a result, cross peaks in 2D asynchronous spectrum are still reliable probe to reflect intermolecular interaction even if the characteristic peaks of P and Q are overlapped. In their paper, they use two model systems to show the effectiveness of the AOSD approach.
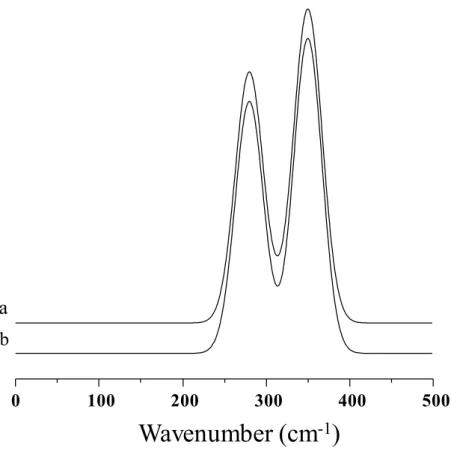
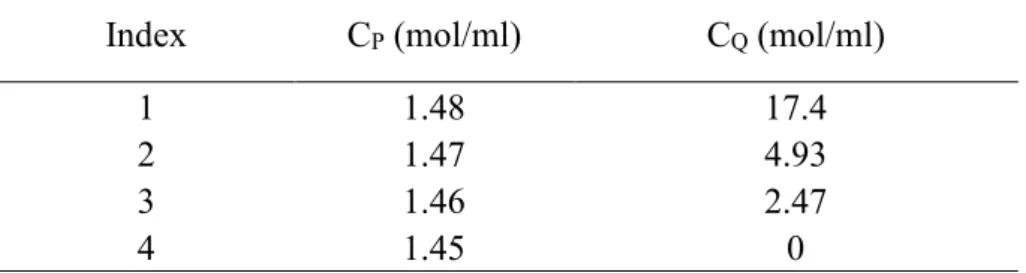
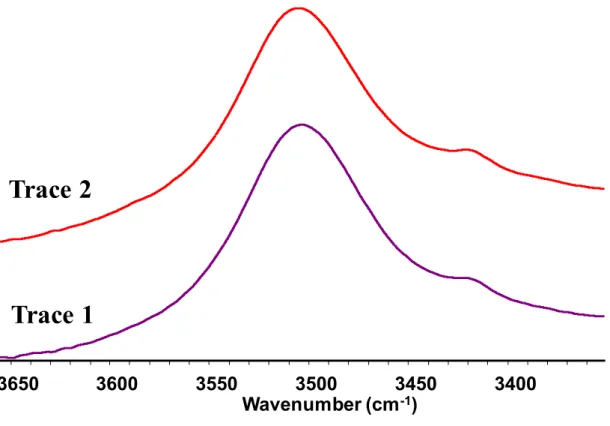
In the two model systems, interaction between two solutes (P and Q) are investigated. The characteristic peak of P and Q are overlapped. In the first system, intermolecular interaction is present between P and Q while no intermolecular interaction occurs between P and Q in the second system. The description of the two model system in detail can be found in ref. 114.
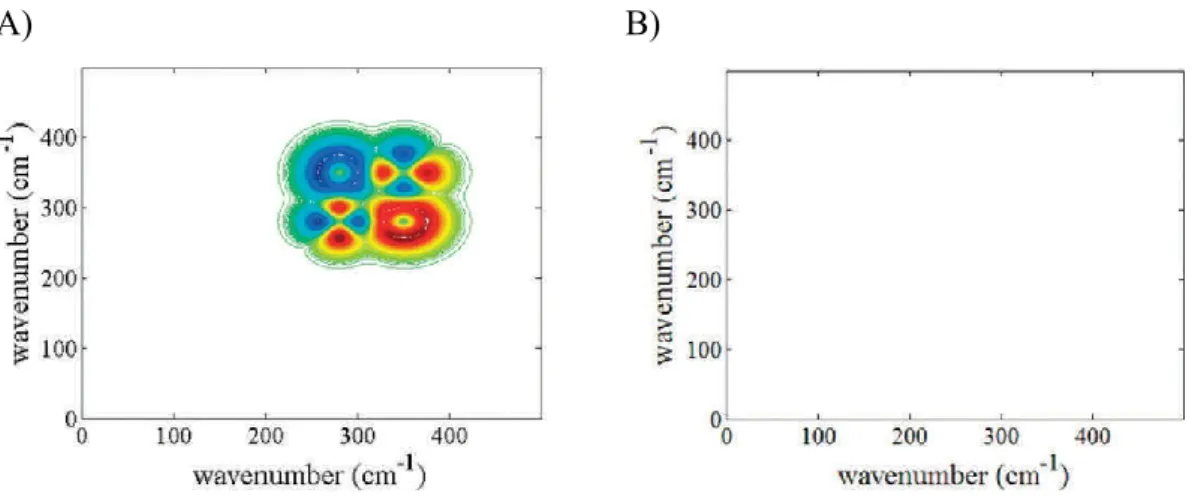
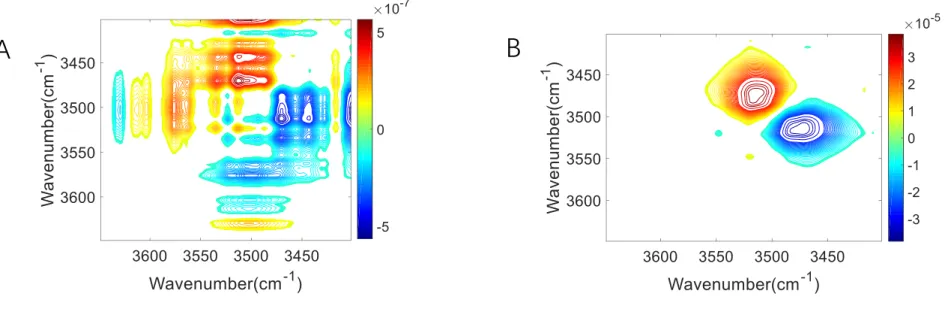
The spectra of a typical solution of the first solution and the second solution are shown in Figure 1-4. No observable difference is found between the two spectra. When 2D asynchronous spectra are generated using the AOSD approach (Figure 1-5), dramatically difference are found between the two systems. In the 2D asynchronous spectrum of the first system (Figure 1-5A), cross peak are present while no cross peaks are found in the 2D asynchronous spectrum of the second system (Figure 1-5B). The results clearly demonstrate that intermolecular interaction between two solutes dissolved in the same solutions can be accurately reflected by 2D asynchronous spectrum generated via the AOSD approach even if the characteristic peaks of the two solutes are overlapped.
P and Q co-exist in the same solution and interaction occur between P and Q, the intermolecular interaction can also be described by the following model:
Under the interaction, a small fraction of P undergoes subtle structural variation and converts into another form, denoted as U. A small fraction of Q changes into V. In 1D spectra, the peak parameters, including peak position, bandwidth, and absorptivity of U, are quite closed to those of P. Hence, the peak of P and that of U are severely overlapped. Moreover, weak interaction only converts very small fraction of P into U. Thus, the concentration of is usually overwhelmingly stronger than that of U. In a spectroscopic experiment, what we can observe is the summation of the signal from P and U. From this summation, it is almost impossible to differentiate the signal from P and that of U. Similar problem occur between the characteristic peaks of Q and V. That, revealing subtle spectral changes is a challenge.
In another paper, Zhang and Xu designed a concentration series of P and Q.119
12
and 2D asynchronous spectrum can be completely removed. Thus, cross peaks in both 2D synchronous spectrum and 2D asynchronous spectrum can be used to reflect intermolecular interaction between P and Q. The approach is called double orthogonal sample design (DOSD) scheme.
Zhang and Xu defined XP, XQ, WP, WQ, P, Q as follows:
XP= XU -XP (1-16) XQ= XV –XQ WP= WU -WP WQ= WV –WQ P= U -P Q= V –Q
The patterns of cross peaks in both 2D synchronous spectrum and 2D asynchronous spectrum generated using the DOSD approach provided a comprehensive information that is helpful in revealing subtle changes in peak position, bandwidth, and absorptivity.
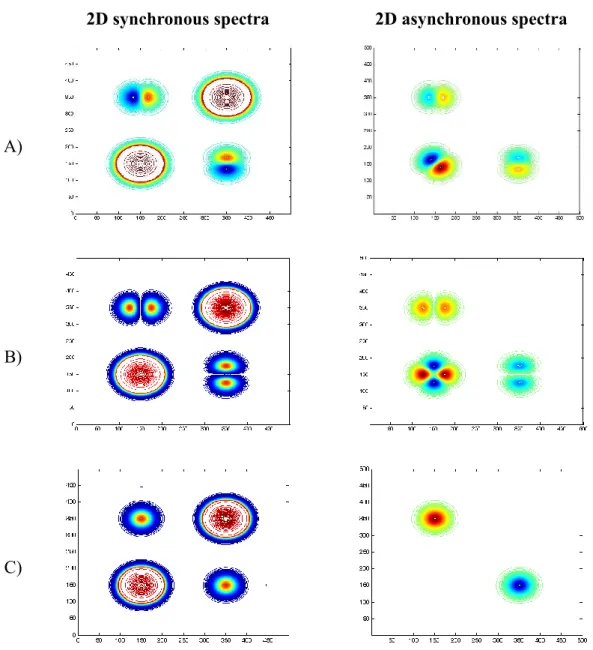
In the first example, the peak parameters of P, Q, U and V are summarized in Table
1-2. In comparison with the characteristic peak of P, the peak of U undergoes a slight
shift. As a result, the peak of P and U are highly overlapped. From a solution containing P, Q, U and V, the overlapping between the peaks of P and U are so severe that the characteristic peak of U cannot be observed even if second derivative spectra method is used. However, 2D synchronous spectrum and 2D asynchronous spectrum (Figure
1-6A) generated via the DOSD approach managed to reveal the occurrence of U even
if the characteristic peak of P and U are severely overlapped. For example, around (150,350) in 2D synchronous spectrum, a group of cross peaks that is composed of one positive cross peak and a negative cross peak can be observed. In 2D asynchronous spectrum, two groups of cross peaks are relevant to the subtle band-shift. The first group of cross peaks appear around (150, 350). The first group of cross peaks is also composed of one positive cross peak and a negative cross peak. The second group of cross peaks locate near the diagonal. This group of cross peaks is composed of two cross peak that are antisymmetric about the diagonal.
In the second example, the peak parameters of P, Q, U and V are summarized in
Table 1-3. In this case, the peak positions of the characteristic peak of P and U are the
same. However, the bandwidth of the two peaks are different. To our knowledge, there is no other method available to differentiate the two overlapped peaks whose peaks positions are the same. However, both 2D synchronous and asynchronous spectra (Figure 1-6B) generated using the DOSD approach can reveal the existence of U via the characteristic patterns. Around (150, 350) in 2D synchronous spectrum, a group of cross peaks is produced. The group of cross peaks is composed of two peaks whose sign and absolute intensity are the same. Two groups of cross peaks are present in 2D asynchronous spectrum. The first group of cross peaks occur around (150,350). The pattern of this group of cross peaks are roughly the same as that in 2D synchronous spectrum. The second group of cross peaks is composed of two horizontal cross peaks and two vertical cross peaks that form a diamond pattern. The absolute intensities of the four cross peaks are the same. The sign of two horizontal cross peaks are the same
13
and the sign of the two vertical cross peaks are the same. However, signs of the horizontal cross peaks are different from that of the two vertical cross peaks.
In the third example, the peak parameters of P, Q, U and V are listed in Table 1-4. In this case, both peak position and bandwidth of the characteristic peak of P are the same as those of U. However, the absorptivity of characteristic peak of P and U are different. That is to say, the characteristic peaks of P and U are completely overlapped. In spite of the severe overlapping, 2D correlation spectra (Figure 1-6C) generated using the DOSD approach can be used to reveal the existence of U that is completely covered by the peak of P. In both 2D synchronous spectrum and 2D asynchronous spectrum, single cross peaks appear at (150, 350).
The above results demonstrate that characteristic pattern of cross peaks in 2D synchronous spectrum and 2D asynchronous spectra become a powerful resolution enhancement tool that can be used to differentiate highly overlapping peaks.
In the further work, Xu and his colleagues found that the pattern of cross peaks in 2D correlation spectra constructed via the DOSD approach cannot reveal what happens when peak position, bandwidth and absorptivity change simultaneously.
To enhance understanding on the physical-chemical nature of intermolecular interaction, a new approach called double asynchronous orthogonal sample design (DAOSD) scheme is developed by Chen and Xu.103
In the DAOSD approach, two groups of solutions are prepared. In the first group of solutions, the initial concentrations of P are constant, while the initial concentrations of Q can be selected arbitrarily. In the second group solution, the initial concentrations of Q are constant, while the initial concentration of P can be selected arbitrarily. Spectra of the two groups of solutions are recorded. Subsequently, a 2D asynchronous spectrum is generated from the first group of solution and the resultant 2D asynchronous spectrum is called P(x, y). Similarly, the spectra of the second group of solutions are
used to construct 2D asynchronous spectrum and the resultant 2D asynchronous spectrum is called Q(x, y). 103
Chen and Xu used a model system to show the spectral behavior of the pair of 2D asynchronous spectrum (P(x, y) and Q(x, y)) generated via the DAOSD approach. In
the model system, the characteristic peaks of P occur at XP and the characteristic peak of Q occur at XQ. The pattern of P(x, y) and Q(x, y) are illustrated in Scheme 1-1.There are three groups of cross peaks in P(x, y). The first group of cross peaks appears around (XQ, XQ). The second and third groups of cross peaks occur around (XP,
XQ) and (XQ, XP), respectively. Mathematical analysis demonstrated that the cross
peaks around (XQ, XQ) reflect the difference on peak position and bandwidth between
the characteristic peak of Q and V. The relationship between the sign of XQ andWQ
and the pattern of cross peaks are summarized in Figure 1-7. The second and the third groups of cross peaks in P(x, y) are antisymmetric about the diagonal and only the
second group of cross peaks are discussed. Mathematical analysis indicates that the second group of cross peaks is composed of two parts. The first part is related to the difference on peak position and bandwidth between the characteristic peak of P and U, and the second part is relevant to the difference on absorptivity between the characteristic peak of P and U. The relationship between the sign of XP andWP and
14
the pattern of the first part of second group of the cross peaks is shown in Figure 1-8. In addition, the relationship between the sign of P and the pattern of the second part
of second group of the cross peaks is shown in Figure 1-8.
Similarly, there are three groups of cross peaks in Q(x, y). The first group of cross
peaks appears around (XP, XP). The second and third groups of cross peaks occur
around (XP, XQ) and (XQ, XP), respectively. The cross peaks around (XP, XP) reflect the
difference on peak position and bandwidth between the characteristic peak of P and U. The relationship between the sign of XP andWP are similar to Figure 1-7. The
second and the third groups of cross peaks are antisymmetric about the diagonal and only the second group of cross peaks are discussed. The second group of cross peaks is composed of two parts. The first part is related to the difference on peak position and bandwidth between the characteristic peak of Q and V and the second part is relevant to the difference on absorptivity between the characteristic peak of Q and V.
The above spectral properties of the cross peaks make it possible to deduce XP,
XQ, WP, WQ, ΔεP and ΔεQ via the patterns of cross peaks in the pair of 2D
asynchronous spectra generated via the DAOSD approach.
An example of analysis of XP, WP, P, XQ, WQ and Q on a model system
by using the DAOSD approach is shown in Figure 1-9
First, a 2D asynchronous spectrum generated by using the AOSD approach is shown on the left part of Figure 1-9. Although interference part that has nothing to do with intermolecular interaction has been completely removed, the patterns of cross peaks are still quite complex. It is difficult to deduce what happen on the characteristic peak of P and Q upon intermolecular interaction.
When the DASOSD approach is utilized, 2D asynchronous spectrum generated by using the AOSD approach can be split into P(x, y) and Q(x, y). According to the
pattern of cross peak around (300, 300) in P(x, y), we learn that the bandwidth of Q
decreases upon interaction with P. Based on the pattern of cross peaks around (100, 100) in Q(x, y), it can be deduced that XP>0 and WP>0.
Based on the above results, we simulate cross peaks around (100, 300) in P. After
comparing the simulated cross peak with cross peaks around (100, 300) in P, a
negative single cross peak appears at (100, 300) in P. Based on this result, we get a
conclusion that P is negative under interaction. Similarly, we simulate cross peak
around (300, 100) in Q. After comparing the simulated cross peak with cross peaks
around (300, 100) in Q, we find a positive single cross peak occur at (100, 300) in P.
Thus, P should be positive.
The peak parameters for P, Q, U and V are shown in Table 1-5. The signs of XP,
WP, P, XQ, WQ and Q are the same as those deduced from the pattern of cross
peaks from P(x, y) and Q(x, y).
4. Other Developments in Two-Dimensional Correlation
Spectroscopy
In recent years, numerous significant new concepts of 2DCOS have been reported with the development of 2DCOS theory138. For example, chemometrics-combined
two-15
dimensional correlation spectroscopy,30, 139-147 moving-window two-dimensional
analysis (MW2D),34-36, 49-55, 58-60, 71, 87, 90, 148-150 quadrature orthogonal signal corrected
two-dimensional correlation spectroscopy (QOSC),151, 152 projection
two-dimensional,153 two-dimensional codistribution spectroscopy (2DCDS)154 have been
developed. A brief introduction about chemometrics-combined two-dimensional correlation spectroscopy and moving-window two-dimensional analysis is provided in the section.
4.1. Chemometrics-Combined Two-Dimensional Correlation Spectroscopy
2DCOS and chemometric techniques are very popular in spectral analyzes in many research fields. The combination of 2DCOS and chemometric generally provides more useful information to explain the subtle spectral changes of the system, which are hardly detectable in conventional 2DCOS.30, 138-144
Jung et al. firstly reported the real combination of 2DCOS and principal component analysis (PCA), which is called PCA-2DCOS. In this technology, PCA is an essential part of PCA-2DCOS.138, 139, 144 It is a very powerful technique for
eliminating the noise contribution in the spectrum and extract useful information. Jung also reported on a new concept of eigenvalue manipulation transform (EMT) for PCA-2DCOS, which can emphasize weak but important contribution.30, 138, 141-143
Here we will briefly introduce background of PCA-2DCOS and EMT.30, 138, 141-143
The original spectral data matrix A is an nm matrix with n spectra and m data points in each spectrum. In PCA, the significant part of the data matrix A* can be expressed as the product of score and loading matrices.
where W and V are the loading matrix (mr) and score matrix (nr), respectively, and E is the residual matrix often related with pure noise. The matrix product A* is the reconstructed data matrix of the original data A without noise contribution.30, 138, 141-143
A*=WVT (1-18)
In PCA-2DCOS, this reconstructed data matrix A* from a few selected significant scores and loading vectors of PCA is used instead of the original data matrix. PCA-2DCOS highlights the most important features of synchronization and asynchrony with noise-free contribution.
This PCA-reconstructed data matrix A* can be also expressed as a singular value decomposition:
A*=USVT (1-19)
and
S=L1/2 (1-20)
where U and S are the orthonormal score matrix and diagonal matrix containing the singular value, respectively.
L=W’W is a diagonal matrix where each diagonal element corresponds to the
eigenvalue of principal component (PC). The scoring matrix W is expressed as W=US and can be obtained directly from W=AV.
16
By manipulating and replacing the eigenvalues of A*, a new transformed data matrix A** can be obtained.
A**=US**VT (1-21)
where S** is given by varying the corresponding eigenvalues in S by raising them to the power of m.
S**=Sm (1-22)
In this technique, the specific information content in 2D correlation spectroscopy is amplified by using a transformation of the data set.30, 138, 141-143
Jung et al. investigate the impact of the new reconstructed data matrix on 2D correlation spectra by using the time-dependent FT-IR spectra of a mixture of methyl ethyl ketone, deuterated toluene, and polystyrene system as an example.141 The
experiment details can be found in ref. 100.
Jung et al. inject artificial noise to the 1D spectra and set the value of the power parameter m, as m = 2. Figure 1-10A displays a synchronous 2D correlation spectrum from the EMT-reconstructed data matrix A** obtained by replacing the original eigenvalues by varying the value of the power parameter m, as m=2. In comparison, the original synchronous 2D correlation spectrum is shown in Figure 1-10B. The corresponding asynchronous 2D correlation spectra are depicted in Figure 1-11.141
For m=2, this operation will diminish the contribution of smaller eigenvalues much more rapidly. The net result is that minor factors representing the noise component are effectively eliminated.
The most noticeable benefit of EMT operation is a gradual noise reduction process based on more flexible fine-tuning operation compared to the abrupt truncation of noise (and spectral information) performed by the PCA-2D correlation analysis. As eq 1-21and 1-22, the transformation of spectral data via a simple manipulation of eigenvalues to enhance spectral selectivity shows promising flexibility and potential, especially when coupled with 2D correlation analysis.
4.2. Moving-Window Two-Dimensional Analysis (MW2D)
The interpretation of 2DCOS based on a large set of spectral data sometimes becomes difficult, due to the inclusion of too many underlying processes influencing the spectral changes. In order to solve this problem, Thomas et al. introduced the concept of moving window into the 2DCOS.90 A spectrum data matrix y(v, p) is
consisted of rows along the spectral variable and columns along the perturbation variable. A submatrix of the data is constructed by choosing only 2m+1 rows around the jth row of the data.149, 150 That j and J are correspond to the index of a window and
that of a spectrum within the window, respectively. Generalized 2D correlation spectra are then calculated from the individual submatrix, and a certain characteristic one-dimensional (1D) spectrum (a diagonal line spectrum, a slice spectrum, etc.) is extracted from the 2D spectrum. Finally, the set of 1D spectra thus collected are aligned along the perturbation axis by incrementally shifting the position of the window to obtain a MW2D correlation spectrum.5
17
PCMW2D analysis is a variant form of the MW2D analysis introduced by Morita et al..138, 148 In PCMW2D analysis, the spectral intensity variation within a chosen
window is correlated synchronously and asynchronously with the perturbation variable itself. The resulting waterfall plots as functions of wavenumber and perturbation variable roughly correspond to the first and second derivatives of spectral intensities with respect to the perturbation variable. PCMW2D technique has been recently applied for identification of a specific zone along the perturbation variable axis containing distinct variations of spectral intensities. Once such zones of interest are identified, then traditional 2D correlation analysis is applied only to those localized zones. The combination of PCMW2D and standard 2D correlation analysis yields unambiguous correlation results by avoiding the inclusion of multiplicity of spectral intensity variation responses. This approach is often preferred over the simple segmentation of data set into arbitrary blocks, as PCMW2D provides good estimates for both location and width of perturbation variable interval to be used for 2D correlation analysis.34-36, 49-55, 58-60, 138, 148
Morita et al. proposed that the synchronous (ΠΦ) and asynchronous (ΠΨ)
PCMW2D correlation spectra are calculated as follows:148
𝚷𝚽,𝑗(𝜈, 𝑝𝑗) = 1 2𝑚 ∑ 𝑦̃(𝜈, 𝑝𝐽) 𝑗+𝑚 𝐽=𝑗−𝑚 ⋅ 𝑝̃𝐽 (1-23) 𝚷𝚿,𝑗(𝜈, 𝑝𝑗) = 1 2𝑚 ∑ 𝑦̃(𝜈, 𝑝𝐽) 𝑗+𝑚 𝐽=𝑗−𝑚 ⋅ ∑ 𝐍 ⋅ 𝑝̃𝐾 𝑗+𝑚 𝐾=𝑗−𝑚
In addition, they find an important rule that the synchronous and asynchronous PCMW2D correlation spectra are similar to the first derivative and second derivative of the spectral intensity variation along the perturbation direction (eq 1-24). Table 1-6 summarized the rules of PCMW2D correlation spectra.148
𝚷𝚽,𝑗(𝜈, 𝑝)~ [𝜕𝑦(𝜈, 𝑝) 𝜕𝑝 ]𝜈 (1-24) 𝚷𝚿,𝑗(𝜈, 𝑝)~− [𝜕 2𝑦(𝜈, 𝑝) 𝜕𝑝2 ] 𝜈
The authors used an example to elucidate spectral features of the PCMW2D correlation analysis. In the example, the PCMW2D technique was applied to a set of simulated spectra as shown in Figure 1-12. Each spectrum possesses two peaks (a and b). The intensity of each peak changes as a function of the perturbation variable p.148
Figure 1-13A and 1-13B are both the synchronous and asynchronous correlation
spectra shown in a form of a birds-eye view and generated from the simulated spectra (Figure 1-12).148
Figure 1-14A shows a slice spectrum at v=300 of the original simulated spectra. Figure 14B and Figure 14C are the slice spectra of the synchronous (Figure 1-13A) and asynchronous (Figure 1-13B) PCMW2D correlation spectra at v=300,
18
The variation of the intensities of the original spectra versus perturbation variable can be described by a sine function. The slice spectrum at v=300 in the synchronous PCMW2D spectrum can be roughly described by a cosine function, the first derivative of the sine function. The slice spectrum at v=300 in the asynchronous PCMW2D spectrum can be roughly described by a sine function, the second derivative of the sine function. The behavior on the simulated system supporting the author’s conclusion, i.e., the synchronous and asynchronous PCMW2D correlation spectra are similar to the first derivative and second derivative of the spectral intensity variation along the perturbation direction.148
5. Applications of Two-Dimensional Correlation Spectroscopy
It has been reported that 2DCOS has significant experiments in many fields, including the types of analytical probes employed, various external perturbations used in the experiments, and various materials and systems for 2DCOS studies. To investigate the properties of the system, 2DCOS was applied to spectra measured by different types of modern analytical probes such as IR,23, 25, 27, 30, 31, 33-36, 40-42, 45, 49-55, 58-60, 62, 71, 87, 90, 94 NIR,27, 68, 89, 91, 96 Raman,29, 39, 67, 76, 77, 81, 88, 95, 98 vibrational optical
activity(VOA),16, 43, 65, 66, 84 UV-Vis,20, 26, 29, 37, 56, 72, 79, 80, 92, 97 fluorescence,69, 73, 74, 93
X-ray24, 29, 33, 39, 48, 75, 82, 83 and NMR.42, 64, 70, 78, 85, 86 Among the external perturbations
applied, such as mechanical,45-47, 62 electrical,18, 28, 39, 57 thermal,19, 24, 30, 31, 33-36, 41, 44, 48-55, 58-60, 62 chemical,16, 20, 23, 25-27, 29, 32, 33, 37, 38, 40, 42, 43, 56, 63 biological,17, 21, 22, 61 etc.,
temperature is the most commonly used application in 2DCOS. 2DCOS has been utilized to investigate various materials and systems such as polymers,24, 28, 30, 31, 33, 34, 36, 42, 46, 48, 50-54, 56, 58-60, 62, 69, 76, 81, 88, 94, 96, 155-158 proteins and peptides,16, 29, 32, 43, 44, 65, 159, 160 nanomaterials and composites,38, 47, 89, 92, 161-164 medicine,26, 45, 165-167 nucleic acids,22, 74, 161, 168 food,97, 169-174 natural materials17, 61, 175-177 and environmental178-181 by using
2DCOS.
A very attractive advantage in 2DCOS applications is the hetero-correlation analysis, such as hetero-spectral correlation,24, 33, 39, 42, 45, 48 hetero-perturbation (or
hybrid) correlation,33, 62 and hetero-sample correlation.25, 182 Among them, 2D
heterogeneous correlation is the most frequently used, and it is possible to compare two systems of completely different types of spectral data obtained under similar external perturbations. In the 2D hetero-spectral correlation analysis, the correlation between different spectral signals under the same perturbation can be detected. 2D heterogeneous spectral analysis can be applied to correlations not only between closely related spectroscopic measurements such as IR and Raman spectroscopy, but also between completely different types of spectroscopic or physical techniques such as IR and X-ray spectroscopy.
6. Outline of Each Chapter
The outline of each chapter for the present thesis will be described as follows. This thesis consists of five chapters.
Chapter 1: this chapter describes a novel approach to generate 2DCOS spectra,
19
We investigate intermolecular interaction between two solutes (denoted as P and Q, where P has a characteristic peak at XP) dissolved in the same solvent via the near
diagonal cross peaks around the coordinate (XP, XP) in a two-dimensional (2D)
asynchronous spectrum of generalized spectroscopy. Because of physical constrains in many cases, the variation ranges of the initial concentrations of P or Q must be kept very narrow, leading to very weak cross peak intensities. The weak cross peaks vulnerable to noise bring about difficulty in the investigation of subtle intermolecular interaction. Herein, we propose a new of way constructing a 2D asynchronous spectrum without the subtraction of the average spectrum often used as a reference spectrum. Mathematical analysis and computer simulation demonstrate that the near diagonal cross peaks around the coordinate (XP, XP) in the 2D asynchronous spectrum using the
new approach possess two characteristics: 1) they can still reflect an intermolecular interaction reliably; 2) the absolute intensities of the cross peaks are significantly stronger than those generated by the conventional method. We incorporate the novel method with the DAOSD (Double Asynchronous Orthogonal Sample Design Scheme) approach and applied the modified DAOSD approach to study hydrogen bonding behavior in diethyl either/methanol/THF system. The new approach made the weak cross peaks, which are not observable in 2D asynchronous spectrum generated using conventional approach, become observable. The appearance of the cross peak demonstrate that: When a small amount of THF is introduced into diethyl solution containing low amount of methanol, THF breaks the methanol-diethyl ether complex and forms methanol-THF complex via new hydrogen bond. This process takes place in spite of the fact that the content of diethyl ether is overwhelmingly larger than that of THF. The above result demonstrates that the new approach is applicable to enhance intensity of cross peaks in real chemical systems.
Chapter 2: this chapter describes the behavior of noise in asynchronous 2DCOS
spectra and a new approach to improve a signal-to-noise ratio of 2DCOS spectra by a Butterworth filter. Mathematical analysis on the noise of 2D spectra and computer simulation on a model system show that the fluctuation of noise in a 2D asynchronous spectrum can be characterized by the standard deviation of noise in 1D spectra. Furthermore, a new approach to improve a signal-to-noise ratio of 2D asynchronous spectrum by a Butterworth filter is developed. A strategy to determine the optimal conditions is proposed. Computer simulation on a model system indicates that the noise of 2D asynchronous spectrum can be significantly suppressed using the Butterworth filtering. In addition, we have tested the approach to a real chemical system where interaction between berberine and β-CyD is investigated using 2D UV-vis asynchronous spectra. When artificial noise is added, cross peaks that reflect intermolecular interaction between berberine and β-CyD are completely masked by noise. After the method described in this article is utilized, noise is effectively suppressed and cross peaks are faithfully recovered. The above result demonstrates that the approach described in this article is applicable in real chemical systems.
Chapter 3: this chapter describes interaction between berberine chloride and
β-CyD by using 2DCOS spectra. The occurrence of cross peaks around (420 nm, 420 nm) in 2D asynchronous spectrum reveals that specific intermolecular interaction indeed
20
exists between berberine chloride and β-CyD. In spite of the difficulty caused by overlaping of cross peaks, we manage to confirm that the 420 nm band of berberine undergoes red-shift and its its bandwidth decrease under interaction with β-CyD. The red-shift of the 420 nm band that can be assigned to n-π* transition indicates the environment of berberine become more hydrophobic. The above spectral behavior is helpful in understanding why the solubility of berberine is enhanced by β-CyD.
Chapter 4: this chapter describes a particular system: there has intermolecular
interaction between two solutes (P and Q) in the solution and P occurs in two exchangeable states. In this particular system, P occurs in two exchangeable states when it is dissolved in the solutions. Results on mathematical analysis and computer simulation demonstrated that interference unrelated to the intermolecular interaction can be completely removed. Hence, the resultant 2D asynchronous spectra generated by using the DAOSD approach can reflect intermolecular interaction reliably. Moreover, properties of cross peaks in different regions of the pair of asynchronous spectra are discussed. In our previous works, cross peaks generated by using the DAOSD and relevant techniques reflect variations on peak position, bandwidth or absorptivity of the characteristic peaks of solutes caused by intermolecular interaction. However, we find that cross peak can still be produced even if intermolecular interaction do not bring about any changes on the characteristic peaks of solutes. Mathematical analysis demonstrates that cross peaks are related to the variations of chemical systems caused by intermolecular interaction at a network level.
Chapter 5: this chapter describes a new approach to prepare lanthanum carbonate
via reactions between lanthanum chloride and NaHCO3. In the reaction, small amount
of NaHCO3 solution was firstly added into the acidic lanthanum chloride solution to
generate lanthanum carbonate nuclei and then NaHCO3 is added into the lanthanum
chloride at a constant speed. This approach makes both precipitation reaction and neutralization reaction take place simultaneously. Consequently, lanthanum carbonate is produced at low pH environment (pH below 4.5) so that the risk of generating lanthanum carbonate hydroxide is reduced. The product of the above reaction is validated by EDTA titration, elemental analysis and XRD characterization. In addition, we established a FTIR spectroscopic method to identify La(OH)CO3 from
La2(CO3)2.8H2O. Lanthanum carbonate exhibits considerable ability to bind phosphate.
References
1. Aue, W.; Bartholdi, E.; Ernst, R. R. Two-Dimensional Spectroscopy. Application to Nuclear Magnetic Resonance. J. Chem. Phys. 1976, 64, 2229-2246.
2. Bax, A., Two-Dimensional Nuclear Magnetic Resonance in Liquids. D. Reidal PubIishing Company: Dordrecht, Holland, 1981.
3. Ernst, R. R.; Bodenhausen, G.; Wokaun, A., Principles of Nuclear Magnetic
Resonance in one and Two Dimensions. Clarendon Press: Oxford, U.K., 1987.
4. Sanders, J. K. M.; Hunter, B. K., Modern NMR Spectroscopy, a Guide for
21
5. Noda, I.; Ozaki, Y., Two-Dimensional Correlation Spectroscopy: Applications in
Vibrational and Optical Spectroscopy. John Wiley & Sons: Chichester, U.K.,
2004.
6. Steffen, T.; Duppen, K. Femtosecond Two-Dimensional Spectroscopy of Molecular Motion in Liquids. Phys. Rev. Lett. 1996, 76, 1224.
7. Tanimura, Y.; Mukamel, S. Two-Dimensional Femtosecond Vibrational Spectroscopy of Liquids. J. Chem. Phys. 1993, 99, 9496-9511.
8. Tokmakoff, A.; Lang, M.; Larsen, D.; Fleming, G.; Chernyak, V.; Mukamel, S. Two-Dimensional Raman Spectroscopy Of Vibrational Interactions in Liquids.
Phys. Rev. Lett. 1997, 79, 2702.
9. Tominaga, K.; Yoshihara, K. Fifth Order Optical Response of Liquid CS2
Observed by Ultrafast Nonresonant Six-Wave Mixing. Phys. Rev. Lett. 1995, 74, 3061.
10. Zanni, M. T.; Ge, N.-H.; Kim, Y. S.; Hochstrasser, R. M. Two-Dimensional Ir Spectroscopy Can Be Designed to Eliminate the Diagonal Peaks and Expose only the Crosspeaks Needed for Structure Determination. Proc. Natl. Acad. Sci.
U. S. A. 2001, 98, 11265-11270.
11. Zhao, W.; Wright, J. C. Measurement of χ (3) for Doubly Vibrationally Enhanced Four Wave Mixing Spectroscopy. Phys. Rev. Lett. 1999, 83, 1950-1953.
12. Noda, I. Two-Dimensional Infrared (2D IR) Spectroscopy of Synthetic and Biopolymers. Bull. Am. Phys. Soc. 1986, 31, 520.
13. Noda, I. Two-Dimensional Infrared-Spectroscopy. J. Am. Chem. Soc. 1989, 111, 8116-8118.
14. Noda, I. 2-Dimensional Infrared (2D IR) Spectroscopy - Theory and Applications. Appl. Spectrosc. 1990, 44, 550-561.
15. Noda, I. Generalized 2-Dimensional Correlation Method Applicable to Infrared, Raman, and Other Types of Spectroscopy. Appl. Spectrosc. 1993, 47, 1329-1336. 16. Ashton, L.; Johannessen, C.; Goodacre, R. The Importance of Protonation in the
Investigation of Protein Phosphorylation Using Raman Spectroscopy and Raman Optical Activity. Anal. Chem. 2011, 83, 7978-7983.
17. Ashton, L.; Xu, Y.; Brewster, V. L.; Cowcher, D. P.; Sellick, C. A.; Dickson, A. J.; Stephens, G. M.; Goodacre, R. The challenge of applying Raman
Spectroscopy to Monitor Recombinant Antibody Production. Analyst 2013, 138, 6977-6985.
18. Bae, J.; Chae, B.; Seo, H.; Jung, Y. M.; Lee, S. W. Structural Characterization of Triphenylamine (TPA)-Based Polymers during the Oxidative Reaction by Two-Dimensional (2D) Infrared Correlation Study. J. Mol. Struct. 2014, 1069, 200-204.
19. Bai, B. L.; Wei, J.; Spegazzini, N.; Wu, Y. Q.; Wang, H. T.; Li, M.; Ozaki, Y. Two-Dimensional Correlation Infrared Spectroscopy Studies on the thermal-Induced Mesophase of 4-Nitrobenzohydrazide Derivative. Vib. Spectrosc. 2014,
70, 115-119.
20. Bi, Q.; Chen, J.; Li, X. P.; Shi, J. J.; Wang, X. M.; Zhang, J.; Gao, D. Q.; Zhai, Y. J.; Zhao, Y.; Weng, S. F., et al. Investigation on the Dipole-Dipole Interactions
22
between Tetramethylurea and Acetonitrile by Two-Dimensional Asynchronous Spectroscopy. J. Mol. Struct. 2014, 1069, 264-271.
21. Carmona, P.; Molina, M.; Calero, M.; Bermejo-Pareja, F.; Martinez-Martin, P.; Toledanog, A. Discrimination Analysis of Blood Plasma Associated with Alzheimer's Disease Using Vibrational Spectroscopy. Journal of Alzheimers
Disease 2013, 34, 911-920.
22. Chandra, G. K.; Eklouh-Molinier, C.; Fere, M.; Angiboust, J. F.; Gobinet, C.; Van-Gulick, L.; Jeannesson, P.; Piot, O. Probing in Vitro Ribose Induced DNA-Glycation Using Raman Microspectroscopy. Anal. Chem. 2015, 87, 2655-2664. 23. Chen, Y.; Cao, Y. Y.; Yan, C. Y.; Zhang, Y. W.; Mu, T. C. The Dynamic Process
of Atmospheric Water Sorption in [BMIN][Ac]: Quantifying Bulk versus Surface Sorption and Utilizing Atmospheric Water as a Structure Probe. J. Phys. Chem. B
2014, 118, 6896-6907.
24. Choi, H. C.; Ryu, S. R.; Ji, H.; Kim, S. B.; Noda, I.; Jung, Y. M. Two-Dimensional Heterospectral Correlation Analysis of X-Ray Photoelectron Spectra and Infrared Spectra for Spin-Coated Films of Biodegradable Poly(3-hydroxybutyrate-co-3-hydroxyhexanoate) Copolymers. J. Phys. Chem. B 2010,
114, 10979-10985.
25. Czarnik-Matusewicz, B.; Bin Kim, S.; Jung, Y. M. A Study of Urea-dependent Denaturation of beta-Lactoglobulin by Principal Component Analysis and Two-dimensional Correlation Spectroscopy. J. Phys. Chem. B 2009, 113, 559-566. 26. Gao, Y. L.; Li, D.; Shi, J. J.; Wang, X. M.; Kang, T. G.; Weng, S. F.; Xu, Y. Z.;
Noda, I.; Wu, J. G. Coordination between Lanthanide (III) Ions and Organic Ligands of Natural Pharmaceutical Containing Lactone Group Probed by DAOSD Approach. Biomed. Spectrosc. Imaging 2015, 4, 129-137.
27. Genkawa, T.; Watari, M.; Nishii, T.; Suzuki, M.; Ozaki, Y. Two-Dimensional Heterospectral Correlation Analysis of Water and Liquid Oleic Acid Using an Online Near-Infrared/Mid-Infrared Dual-Region Spectrometer. Appl. Spectrosc.
2013, 67, 724-730.
28. Grzeszczuk, M.; Granska, A.; Szostak, R. Raman Spectroelectrochemistry of Polyaniline Synthesized Using Different Electrolytic Regimes - Multivariate Analysis. Int. J. Electrochem. Sci. 2013, 8, 8951-8965.
29. Haas, S.; Plivelic, T. S.; Dicko, C. Combined SAXS/UV-vis/Raman as a Diagnostic and Structure Resolving Tool in Materials and Life Sciences Applications. J. Phys. Chem. B 2014, 118, 2264-2273.
30. Jung, Y. M.; Kim, H. J.; Ryu, D. Y.; Bin Kim, S.; Kim, J. K. Application of Principal Component Analysis-Based Two-Dimensional Correlation
Spectroscopy to Characterization of Order-Disorder Transition of Polystyrene-Block-Poly(n-Pentyl Methacrylate) Copolymer. J. Mol. Struct. 2006, 799, 96-101.
31. Jung, Y. M.; Shin, H. S.; Kim, S. B.; Noda, I. Two-Dimensional Gradient
Mapping Technique Useful for Detailed Spectral Analysis of Polymer Transition Temperatures. J. Phys. Chem. B 2008, 112, 3611-3616.