Research on Intravascular Optical Coherence Tomography
Image Analysis
March 2021
Graduate School of Systems Engineering
Wakayama University
光干渉断層法による血管内画像の解析に関する研究
令和3年3月
和歌山大学大学院システム工学研究科
Abstract
Coronary artery disease (CAD) as a well-known heart disease causes numerous deaths in countries, and the death number continuously increases every year. Lipid, fibrous and calcified plaques are the three common types of atherosclerosis plaque to be investigated the symptom reason by specialists through a new imaging modality, called intravascular optical coherence tomography (IVOCT). However, hundreds of IVOCT images would be produced for each treatment time to a patient. The biggest difficulty for CAD specialists is that they need a large time to manually analyze these IVOCT images. Therefore, automatic methods of IVOCT image analysis for quantitative measurement and lesion tissue classification are necessary and significant.
To overcome the problems, my research focuses on the automated methods on IVOCT image analysis. Chapter 1 introduces the CAD concept and the schema of the optical coherence tomography (OCT) system. Moreover, the characteristics of atherosclerosis plaques are presented and the relative work for the IVOCT image investigation is mentioned.
Chapter 2 discusses the pre-processing methods to eliminate noise, and to remove the catheter imaging region with a circle detector by consideration of the circle shape of the catheter. To segment the vessel lumen border and the outer border of the region of interest (ROI) in the following steps, I segmented a sector region containing the guide wire and its black shadow instead of detecting the guide wire spot directly.
Chapter 3 analyzes the intensity fluctuation degree of the A-line profile between the vessel tissue and the stent, and designs features based on the standard deviation to discriminate between the vessel tissue and the stent. At last, utilizing an adaptive region growing method to remove the guide wire spot.
Thinking that a 1-D A-line contains less information compared with a 2-D region composed of A-lines, and considering the light attenuation of lesion tissues, a local multi-layer model is built up to investigate the plaques feature extraction of the superficial layer in chapter 4. An A-line sub-region (ALSR) is defined as the basic unit of the local multi-layer to analyze features in a 2-D region.
In chapter 5, utilizing the outperformance of the deep learning method on image processing, I structured a VGG-like model, which contains 11 layers, to predict the plaque type of every ALSR. Three types of input with different channel amounts are designed for the recognition effect discussion on the texture information and multi-channel.
Chapter 6 researches the semantic segmentation of IVOCT images with the deep learning concept. The outer border of ROI is obtained with the level-set method to segment the superficial region containing useful information. The input data is cropped based on the ROI to feed into the built neural network (DB-SegNet) to solve the pixel-wise classification task. The classified prediction outputs are finally combined to compute the maximum possible category of the pixel.
Chapter 7 gives out a conclusion for each part of this thesis, and discuss the existing problems and future work.
概 要 冠動脈疾患(CAD)は有名な心臓病として各国で多くの死亡者を出しており、その数 は年々増加の一途をたどっています。動脈硬化性プラークは、脂質性プラーク、繊維性プ ラーク、石灰化プラークの 3 つが一般的であり、血管内光コヒーレンス・トモグラフィー (IVOCT)と呼ばれる新しい画像モダリティを用いて、専門医が症状の原因を調査する必 要があります。しかし、患者への治療時間ごとに数百枚の IVOCT 画像が作成されることに なる。CAD専門医にとって最大の難点は、これらのIVOCT画像を手動で解析するた めに多くの時間を必要とすることである。そのため、定量的な計測や病変組織分類のため の IVOCT 画像の自動解析手法が必要であり、意義がある。 これらの問題点を克服するために、私は IVOCT 画像解析の自動化手法に焦点を当て て研究を行っている。第 1 章では、CAD の概念と光コヒーレンス・トモグラフィー(OCT) システムのスキーマを紹介する。また、動脈硬化性プラークの特徴を紹介し、IVOCT 画像 解析のための相対的な作業についても言及している。 第2章では、ノイズを除去するための前処理方法と、カテーテルの円の形状を考慮し て円検出器でカテーテルの撮像領域を除去する方法について述べる。以下のステップで血 管内腔境界と関心領域(ROI)の外縁をセグメント化するために、ガイドワイヤスポット を直接検出するのではなく、ガイドワイヤとその黒い影を含むセクタ領域をセグメント化 した。 第 3 章では、血管組織とステントの間の A 線プロファイルの強度変動の程度を解析 し、血管組織とステントを識別するための標準偏差に基づいた特徴量を設計する。最後に、 適応領域成長法を活用してガイドワイヤースポットを除去する。 1 次元 A 線は A 線で構成される 2 次元領域に比べて情報量が少ないと考え、病変 組織の光減衰を考慮して、第 4 章では表層のプラーク特徴抽出を検討するために局所多 層モデルを構築した。2 次元領域の特徴を解析するための局所多層モデルの基本単位と して、A 線サブ領域(ALSR)を定義した。 第 5 章では、ディープラーニング法の画像処理上の優れた性能を利用して、11 層か らなる VGG ライクなモデルを構築し、ALSR ごとのプラークタイプを予測した。テクスチ ャ情報とマルチチャンネルの認識効果を議論するために、チャンネル量の異なる 3 種類 の入力を設計した。 第 6 章では、ディープラーニングの概念を用いて IVOCT 画像の意味的セグメンテー ションを研究している。レベルセット法を用いて ROI の外縁を取得し,有用な情報を含 む表層領域をセグメンテーションする.入力データは ROI に基づいて切り取られ、構築さ れたニューラルネットワーク(DB-SegNet)に供給され、ピクセル単位の分類タスクを解決 します。分類された予測出力は、最終的にピクセルの最大可能なカテゴリを計算するため に結合されます。 第 7 章では、本論文の各部の結論を述べ、これまでの問題点と今後の課題について述 べる。
Declaration
I hereby declare that except where specific reference is made to the work of others, the contents of this dissertation are original and have not been submitted in whole or in part for consideration for any other degree or qualification in this, or any other university. This dissertation is my own work and contains nothing which is the outcome of work done in collaboration with others, except as specified in the text and Acknowledgements. I have duly acknowledged all the sources of information which have been used in the thesis.
Xinbo Ren February 2021
Acknowledgements
Foremost, I would like to express my sincere gratitude to my supervisor Professor Toshiyuki Iami for the continuous support of my Ph.D. study and research. Simultaneously, I would like to thank Professor Haiyuan Wu and Associate Professor Qian Chen, they give me much more support to my investigation. Especially, Professor Haiyuan Wu supplies the important opportunity for me to improve my study ability and education level. Professor Chen also gives me a lot guidance on how to write a better thesis with English. I would like to thank Professor Takashi Kubo and Professor Takashi Akasaka with their kind help on the understanding of IVOCT images, the definition of vessel lesion plaques and review of my research papers. Also, thanks to the Department of Cardiovascular Medicine of Wakayama Medical University for supplying the experiment data (IVOCT images from patients) to support me to begin and complete the related research.
Thanks to my colleagues in Visual Design Laboratory to help me a lot in daily life. My sincere thanks also go to Doctor Peng Li, Doctor Yankun Lang, Doctor Yiqiang Qi, Doctor Yi Tian and Doctor Haoqi Gao, for giving me much more advice and contribution not only on my study, but also including other help. Especially for Doctor Peng Li, he helps me to familiarise the school environment and encourage me in my study. Doctor Yiqiang Qi goes with me to the hospital when my eyes feel uncomfortable. Thank Professor Yoshihiro Takuya invite me to his house for a nice summer holiday.
I would also like to express my gratitude to Mrs. Chunchun Yang from the international engagement office of Wakayama University, she helps me apply for the residency status. Sincere thanks to Mrs. Miyamoto, Mr. Takahashi and Professor Nagatomo bun-ko, they help me to improve my Japanese level in my spare time.
Many thankfulness to my fellow Mrs. Yan Li for help me to finish my class tasks when I study for a doctor’s degree in Japan. Moreover, great gratefulness to my students Qing Tian, Jing Wang, ZhiJuan Li and Yidan Zhang, they finish the label work in my research.
Finally, I will give my deepest love to my family, my parents, my wife and my cute children for their support and encouragement for me as usual to finish my three years of study. Especially to my wife, without her understanding and help, I can’t complete my research without any difficulty.
Publications
Journal papers
1. Xinbo Ren, Haiyuan Wu, Qian Chen, Takashi Kubo, Takashi Akasaka, A Local Multi-Layer Model for Tissue Classification of in-vivo Atherosclerotic Plaques in Intravascular Optical Coherence Tomography, IEICE Transactions on Information and Systems, Vol.E102-D, No.11, pp. 2238-2248, Nov. 2019.
2. Xinbo Ren, Jingbo Fan, Yi Tian, Review of Vascular Stents and Atherrosclerotic Plaques Based on IVOCT Images, Computer System Application, Institute of Software, Chinese Academy of Sciences, Vol.28, No.03, pp. 10-17, Mar. 2019.
3. Xinbo Ren, Yan Li, Removal Method of OCT Image Catheter Based on Detection of Circumferential Intensity, Computing Technology and Automation, Hunan University, Hunan Computer Society and Hunan Automation Society, Vol.28, No.03, pp. 107-111, Oct. 2019.
4. Xinbo Ren, Automatic Segmentation of Nerve Dendrite Spines Based on Fluorescent Spot Detection, Journal of Xi’an University of Post and Telecommunications, Vol.19, No.04, pp. 53-56, Aug. 2014.
International conference
1. Xinbo Ren, Haiyuan Wu, Qian Chen, Takashi Kubo, Takashi Akasaka, A Tissue Classification Method of IVOCT Images Using Rectangle Region Cropped along the Circumferential Direction based on Deep Learning, International Forum on Medical Imaging in Asia (IFMIA) 2019, Proceedings Volume 11050
2. Xinbo Ren, Qian Chen, Haiyuan Wu, Takashi Kubo, Takashi Akasaka, A Novel Auto-matic Stent Detection Method in Intravascular OCT Images Based on Local Maximum
of Standard Deviation, 24th International Workshop on Frontiers of Computer Vision (IW-FCV), 2018
3. Z. Sui, J. Li, J. Fan, Xinbo Ren, Y. Li and Y. Liu. All-in-focus image reconstruc-tion with depth sensing, BioMedical Engineering and Informatics (CISP-BMEI), 9th International Congress on Image and Signal Processing, pp.178-183, 2016.
Table of contents
List of figures xiii
List of tables xvii
1 Introduction 1
1.1 Cardiovascular disease . . . 1
1.1.1 Cardiovascular disease . . . 1
1.1.2 Healthy vessel and CAD plaques . . . 3
1.2 Two main imaging modalities of vascular . . . 5
1.2.1 Intravascular ultrasound . . . 5
1.2.2 Optical coherence tomography . . . 6
1.3 Atherosclerosis plaque types . . . 9
1.4 Related work . . . 11
1.5 Purpose of this thesis . . . 19
1.6 Overview of this thesis . . . 20
2 IVOCT pre-processing 23 2.1 Image acquisition . . . 23
2.2 IVOCT image conversion . . . 24
2.3 Image noise eliminating . . . 26
2.4 Catheter imaging removal . . . 27
2.5 GW detection and black shadow segmentation . . . 31
2.6 Experimental results . . . 35
2.6.1 Parameter setting . . . 35
2.6.2 Validation . . . 38
2.6.3 Results . . . 39
3 Lumen boundary segmentation and stents detection 49
3.1 Basic concept and model definition . . . 49
3.2 Lumen boundary segmentation . . . 54
3.3 Stents detection . . . 55
3.3.1 Stents candidate points detection . . . 55
3.3.2 Candidate points selection . . . 58
3.3.3 Stent area detection by adaptive region growing . . . 60
3.4 Experimental results . . . 61
3.4.1 Parameter setting . . . 61
3.4.2 Results . . . 61
3.5 Discussion and conclusion . . . 62
4 Atherosclerosis plaque recognition 67 4.1 Feature analysis . . . 67 4.2 Multi-layer model . . . 70 4.3 Feature extraction . . . 71 4.4 Experimental results . . . 75 4.4.1 Parameter setting . . . 75 4.4.2 Validation . . . 75 4.4.3 Results . . . 76
4.5 Discussion and conclusion . . . 76
5 Atherosclerosis plaque identification with deep learning 83 5.1 Deep learning basic concept . . . 83
5.2 VGG-like model building . . . 89
5.2.1 VGG network architecture . . . 89 5.2.2 Input data . . . 90 5.2.3 VGG-like model . . . 91 5.3 Experimental results . . . 92 5.3.1 Parameter setting . . . 92 5.3.2 Validation . . . 93 5.3.3 Results . . . 94
5.4 Discussion and conclusion . . . 94
6 Semantic segmentation for atherosclerosis plaques 99 6.1 ROI segmentation . . . 100
Table of contents xi
6.3 Post-processing . . . 103
6.4 Experimental results . . . 104
6.4.1 Data acquisition and labeling . . . 104
6.4.2 ROI segmentation algorithm parameters . . . 104
6.4.3 Deep learning model and data augmentation . . . 105
6.4.4 Validation . . . 106
6.4.5 Results . . . 107
6.5 Discussion and conclusion . . . 109
7 Discussion and future work 121 7.1 Conclusion . . . 121
7.2 Problems and future work . . . 123
References 125 Appendix A Algorithms 133 A.1 Adaptive region growing algorithm . . . 133
Appendix B Deep learning architectures 135 B.1 VGG-like architecture . . . 135
List of figures
1.1 Coronary artery disease . . . 2
1.2 Artery with three layers structure . . . 3
1.3 Atherosclerosis specimen . . . 4
1.4 IVUS imaging modality . . . 5
1.5 A-line illustration . . . 6
1.6 FD-OCT Schematic illustration . . . 7
1.7 Two imaging modalities to an artery . . . 8
1.8 The components of an IVOCT image . . . 9
1.9 Three samples of atherosclerosis plaques . . . 11
1.10 Plaques appearance diversity . . . 12
1.11 Other types of lesion plaque components . . . 12
2.1 IVOCT image convert . . . 25
2.2 Examples of different catheter shape types . . . 28
2.3 Examples of circle detector in the catheter imaging . . . 29
2.4 Illustration of catheter model . . . 31
2.5 Demonstration of Wang’s method[92] . . . 32
2.6 GW region demonstration . . . 33
2.7 CRDM description and application in IVOCT images . . . 34
2.8 Illustration of catheter model . . . 36
2.9 An example of error result for catheter removing . . . 37
2.10 Examples of initial results of the catheter imaging removing . . . 37
2.11 Examples of middle results with our GW segmentation . . . 38
2.12 Linear regression for catheter area and GW shadow angle . . . 40
2.13 Bland-Altman graphics for catheter area evaluation . . . 41
2.14 Bland-Altman graphics for GW shadow angle evaluation . . . 42
2.15 Examples of the final catheter imaging area detection results-1 . . . 43
2.17 Examples of the GW shadow sector area segmentation results-1 . . . 45
2.18 Examples of the GW shadow sector area segmentation results-2 . . . 46
3.1 The complexity condition of the vascular . . . 50
3.2 Coordinate transformation . . . 51
3.3 A-line profile intensity . . . 52
3.4 Example of smoothed A-line profile . . . 53
3.5 Lumen border detection . . . 54
3.6 Illustration of lumen boundary smoothness . . . 56
3.7 Stents in the IVOCT image . . . 57
3.8 Initial detected candidate points . . . 58
3.9 Intensity analysis of the peak intensity and the region behind . . . 59
3.10 Illustration of the stent detection . . . 62
3.11 Results of lumen boundary detection . . . 63
3.12 Results of stents detection . . . 64
3.13 Illustration of local individual points . . . 65
3.14 GW segmentation method-2 . . . 66
4.1 Illustration of the intensity distribution in the IVOCT image . . . 69
4.2 Multi-layer model illustration . . . 71
4.3 Results for the vessel tissue classification . . . 78
4.4 Confusion matrix of lesion tissue . . . 79
4.5 Misclassification examples . . . 79
5.1 2D convolution illustration . . . 85
5.2 Input images with different channel number . . . 86
5.3 N layers of feature maps . . . 88
5.4 Pooling operation for the downsampling . . . 88
5.5 CNN architecture demonstration . . . 89
5.6 Illustration of VGG-like model . . . 93
5.7 Training presentation on our mode . . . 95
5.8 Results of the tissue classification with our deep learning method . . . 96
6.1 Illustration of ROI segmentation implemented by applying the level-set method101 6.2 Cropped ROI illustration . . . 106
6.3 Examples of ROI segmentation . . . 108
6.4 ROI detection . . . 110
List of figures xv
6.6 Schematic of DB-SegNet architecture . . . 112
6.7 3-D volume of cropped predictions . . . 114
6.8 Semantic segmentation results of vessel lesion plaques . . . 115
6.9 Illustrations of tow ROI segmentation methods . . . 116
6.10 Demonstration of two lesion plaques classification methods . . . 117
List of tables
1.1 General characteristics of the main atherosclerosis plaque . . . 10 2.1 Evaluation metrics for the catheter segmentation and GW region angle detection 39 4.1 Appearance of tissue thickness measurement in the previous studies . . . . 70 4.2 Lesion classification accuracy comparison between Ughi’ method and our
method . . . 77 4.3 Evaluation metrics for the vessel tissue classification . . . 81 5.1 Evaluation results of 4 classes in 3 different input channel types . . . 96 5.2 Results of accuracy for 292 testing data in 3 different input channel types . 97 6.1 Evaluation metrics for the segmentation of ROI in IVOCT images. . . 107 6.2 Comparison of tissue classification between SegNet and DB-SegNet-3
(DB-SegNet-3 model presents the number of layers of a dense block is set 3.) . . 109 6.3 Evaluation metrics over 10 datasets for the vessel tissue classification . . . 113
Chapter 1
Introduction
1.1
Cardiovascular disease
1.1.1
Cardiovascular disease
Cardiovascular disease (CVD) is a general term for conditions affecting the function of heart or blood vessels. It remains the most frequent cause of death to people in the world, accounting for 17.3 million deaths per year[58], which makes a 31% proportion of the total, and the number of death is still continuously increasing. Generally, CVD includes the following common types: coronary artery diseases (CAD) (such as angina and heart attack), heart failure, stroke, aortic disease, and peripheral arterial disease[1, 2]. The reasons that contribute to the creation of CVD are various, including high blood pressure, smoking, high cholesterol, diabetes, lack of exercise, being overweight or obese, family history of CVD, and others, which all these causing as the “risk factors” would increase a person’s risk of getting CVD.
Among the classes of CVDs, CAD as the most common type happens in the human blood tubes (in the body)[3] and is induced with the phenomenon that build-up plaques occasioning on the human vessel inner walls block the blood flow. This built-up plaque is medically called atherosclerosis, and it impacts the arteries become narrowed or hardened, which decreases the vessel lumen area and the flowing volume supplying blood to the heart. Simultaneously, the amount of oxygen contained in the human blood also be affected presenting cutting down correspondingly. In order to maintain the normal life activities of various tissues and organs of the human body, the heart needs to beat constantly to ensure blood transportation. Medically speaking, the heart, as a muscle-powered organ that pumps blood, also needs sufficient nutrients and energy itself which are supplied by the blood itself. Strikingly, coronary artery disease occurs when part of the smooth, elastic lining inside a coronary artery (the
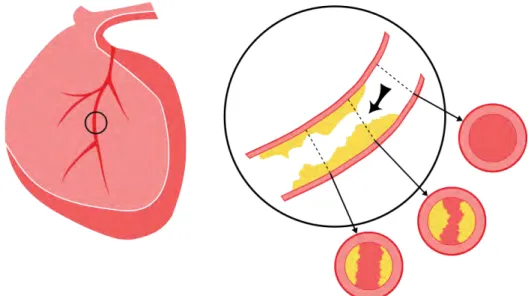
arteries that supply blood to the heart muscle) develops atherosclerosis[3]. When suffering atherosclerosis, the artery’s lining becomes hardened, stiffened, and accumulates deposits of calcium, fatty lipids, and abnormal inflammatory cells – to form plaques around the human vessel wall[3]. As shown in Fig. 1.1, lesion plaques of atherosclerosis are produced in the inner vessel wall and the yellow substance depicts the shape, position, cover area of the lesion plaque in the blood vessel. The black arrow in the enlarged image section indicates the flowing direction of the blood. Three examples of cross-sections marked in different locations present 3 inner section situations of the coronary artery, including one healthy and other two unhealthy cross-sections containing plaques with diverse degrees. Observing in Fig. 1.1, clearly finding that the existence of atherosclerosis undoubtedly results in a condition of area decrease for the vessel cross-section, which in turns reduces the amount of blood flowing. If in the absence of any immediate and effective treatment and medical advice, the plaques will continue to increase in the size of the volume and finally block the blood flowing to the heart causing human death. Early coronary artery atherosclerosis has no obvious signs, neither significantly obstructing blood flow nor inducing acute symptoms, even in many cases plaque coronary artery plaque rupture will not have a significant impact on the normal physiological activities of people, so it is difficult to be aware of and found. However, as the patient ages and the size of the atherosclerotic plaque increases, the blood flow from the arteries to the heart decreases, resulting in symptoms such as coronary heart disease and angina, and in severe cases, the patient may face the threat of death. CAD can lead to various symptoms, such as chest pain or a heart attack, etc, especially, the heart attack could possibly cause sudden death to patients in a future time.
Fig. 1.1 Illustration depicting the human heart and the plaques of CAD in the blood vessel. Three cross-sections of the human artery with different positions is represented.
1.1 Cardiovascular disease 3
1.1.2
Healthy vessel and CAD plaques
A healthy artery wall is a three-layer morphology containing intima, media and adventitia respectively to construct a multi-layer vessel structure. The illustration of the blood vessel three layers of the structure is displayed in Fig. 1.2. The intima layer is near the vessel lumen and adventitia is the external layer of the artery wall, while media is the layer between intima and adventitia. The normal blood vessel can supply necessary oxygen and nutrients to the heart maintaining life. Atherosclerosis plaques regularly happen between the intima and media[72] to break the multi-layer structure and lead the complete blockage of blood flowing through the artery. Previous medical studies of CAD indicate that coronary
Fig. 1.2 A section example of the healthy human vessel. The artery wall is made up of three layers: intima, media and adventitia.
atherosclerosis plaques are mainly divided into three categories: lipid, calcified and fibrous plaques. From clinical studies, these three types differ significantly in appearance and characteristics, histopathologically. Lipid plaque is possibly formed during the period of cholesterol oxidization in the vessel under the condition of insufficient high-density lipoprotein[4]. The fibrous plaque is also localized under the intima, within the wall of the artery resulting in thickening and expansion of the wall and, sometimes, spotty localized narrowing of the lumen with some atrophy of the muscular layer. The fibrous plaque contains collagen fibers (eosinophilic), precipitates of calcium (hematoxylinophilic) and, rarely, lipid-laden cells[4]. Calcification forms among vascular smooth muscle cells of the surrounding muscular layer, specifically in the muscle cells adjacent to atheromas and on the surface of atheroma plaques and tissue[59]. The lipid core plaque or fibroatheroma is a type of atherosclerotic lesion prone to develop unstable features under the influence of inflammatory processes and mechanical forces[28]. Besides, the form of mixed plaques composed of these three types is often observed during the treatment period, which contains the fibro-lipid
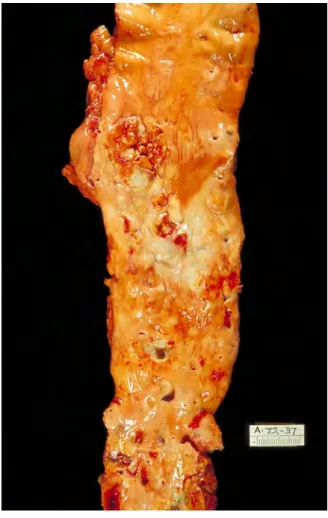
plaque, fibro-calcific plaque and thin cap fibroatheroma, etc. Figure 1.31 presents a real severe atherosclerosis specimen of a patient. Observing from Fig. 1.3, the luminal surface is studded with the proliferative lesion tissue recognized as the symptom of atherosclerosis.
A straightforward way to investigate the causes of the pathogenesis of CVD is to study the morphological changes and pathological manifestations of vascular lesions in the tissues firstly through the quantitative measurement of the appearance, lumen area, lumen thickness, etc. Human blood vessels as one of the exquisite organs, although the appearance of its size is dynamical (the large artery is > 10 mm diameter and the smaller ones are 0.1–10 mm), it is still a micro-substance structure, which needs to be imaged with the professional technology of the coronary artery to assess the severity of coronary lesions.
Fig. 1.3 A specimen of the vessel with atherosclerosis tissues from one patient.
1This image is a work of the Centers for Disease Control and Prevention, part of the United States Department
of Health and Human Services, taken or made as parhuman arteryt of an employee’s official duties. As a work of the U.S. federal government, the image is in the public domain.
1.2 Two main imaging modalities of vascular 5
1.2
Two main imaging modalities of vascular
The technology for vascular imaging with high quantity can improve the understanding of the inner structure of the vessel and treat the vessel diseases helpfully to reduce the symptom of patients. In recent years, two significant technologies are generally performed as the main imaging modalities to the vascular to observe the realistic inside morphology of the vessel. One is called intravascular ultrasound (IVUS) and the other is intravascular optical coronary tomography (IVOCT).
1.2.1
Intravascular ultrasound
IVUS is a medical imaging methodology through the ultrasound equipment with an ultra-sound probe placed in front of the catheter to receive the signal of the blood vessel and then produces the cross-section imaging by computer aid tools. Mechanically rotating the IVUS catheter around could gain an ultrasound signal reflected from the vessel inner wall. To a 20-40 MHz of IVUS, generally, the axial resolution is 80-100 µm with a pullback speed of 0.5 mm/s and the lateral value is a range of 200 to 250 µm[19]. Figure 1.4 presents one transverse image of the human vessel. The left sub-figure is the original IVUS image and the right is the corresponding labelled figure for the denotation of an interesting area. The region with green indicates the area and thickness of atherosclerosis plaques of the in-vivo and the severity degree of this disease. IVUS can be applied to optimize the result of the
Fig. 1.4 An example of IVUS imaging, which shows the detailed information of a vessel through ultrasound. The interesting region labelled with green is an imaging area without more detailed information that can be observed (comparing with OCT).
clinical applications are to size the vessel and guide the implantation of coronary stents in percutaneous coronary intervention (PCI) procedures.
1.2.2
Optical coherence tomography
Optical coherence tomography (OCT) as a novel intravascular imaging technique, which is a light-based imaging modality, generates high-resolution cross-section images of tissue microstructure. The light of OCT is near-infrared based on optical 1-dimensional low-coherence reflectometry, which employs a Michelson interferometer and a broadband light source[13, 34, 43]. The principle of OCT is simply explained as that the OCT equipment measures the time delay of the light which is reflected or backscattered from vessel tissues, and which is collected by the catheter, by utilizing a technique known as interferometry.
Fig. 1.5 The reflection light received by the catheter is stacked into the storage device to structure an IVOCT image slice. A (the polar domain) and B (Cartesian domain) are the two types of IVOCT image representation. The white lines in both example images denote A-lines generated with the OCT system.
Currently, two types of OCT systems, named respectively as time-domain OCT (TD-OCT) and frequency-domain OCT (FD-(TD-OCT), are applied for the CAD investigation and vessel disease treatment, which are mainly comprised of a low coherence and broad band-width light source, reference mirror, and photodetector. Compared with TD-OCT, FD-OCT acquires images significantly faster by using a fixed mirror with a variable frequency light source, which is more popular to be utilized in medical institutions[43]. Figure 1.6 shows a schematic representation of FD-OCT system and the relative significant components. Light is transmitted from the light source to a beamsplitter and then split into two portions: one goes to scan the tissue target of the patient through a catheter (sample arm) and the other
1.2 Two main imaging modalities of vascular 7
Fig. 1.6 Schematic of FD-OCT system.
portion is transmitted to the reference mirror (reference arm). Subsequently, the reflected light from the reference arm and the collected light from the sample arm are merged as a single one to be sent to the photodetector. Because of the distances that the collected light and the reflected light both travel are the same, therefore a pattern of high and low intensities can be detected, which is known as the interference method[78]. And then, the IVOCT image is determined through the interference pattern analysis considering the amount of backscattering as a function of delay time or depth within the tissues. Finally, a cross-section of an IVOCT image sample is produced through the OCT relevant software in the computer console. After the entirety “pull-back” procedure completing, a set of slices about the human vessel is collected to form the real situation of the treated vessel. The procedure of the OCT “pull-back” in the in-vivo vessel is that the intravascular OCT equipment uses the catheter to emit light to the artery inner wall and then records the reflection while simultaneously rotating the catheter through the guide-wire (GW) during a pull-back period. After collecting the backscattering of light from the artery inner wall through the catheter, the IVOCT equipment stacks the light called A-line (axial line) together to form a cross-section image as a slice of the original IVOCT image. Figure1.5 illustrates the A-line that can be conceptually thought of as illuminating tissue with pulses of light. This procedure is performed repeatedly by the OCT equipment until an entirety “pull-back” is completed. Although the light emitted by the catheter contains a center wavelength range from 1.25 µm to 1.35 µm, the value of 1.3 µm is usually chosen by medical institutions for the research and treatment[13].
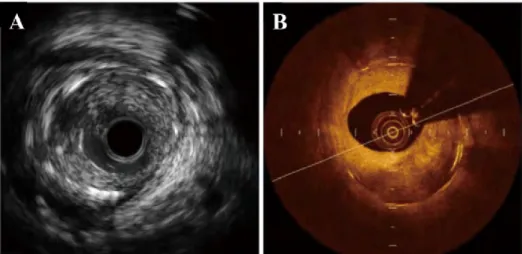
The quality of IVOCT images depends on the spatial resolution which includes axial and lateral directions corresponding to parallel and perpendicular to the light beam respectively. Compared with IVUS, IVOCT resolution presents a range from 10 to 20 µm, which is almost 10 times of IVUS, consequently, it can obtain the description of the tissue structure with high resolution. Besides, under the wavelength of 1.3 µm, the tissue penetration of IVOCT is 1 to 3 mm while IVUS can achieve 4 to 8 mm[13], which IVOCT is lower than IUVS in the penetration capability of imaging. That means we observe a valid region with OCT technology in a smaller limited area than IVUS. Although IVUS provide a deeper through vessel tissues than IVOCT, IVOCT presents more detail for characterizing the superficial structure of the vessel wall and is considered as an important imaging technique applied to medical fields. Therefore, the main disadvantage of OCT is the poor penetration depth to tissues and makes the tissue visualization with a limitation of 2 to 3 mm in depth for a global scanning area of 7 mm in diameter. An example of two types of vascular imaging modalities to a cross-section of one vascular is given in Fig. 1.7. Left figure (Fig. 1.7 (A)) shows that IVUS provides information in anatomical severity of lesions, while right figure (Fig. 1.7 (B)) displays the same position imaging through the IVOCT technique. An obvious difference in
Fig. 1.7 A cross-section of an artery captured with two modalities: IVUS and IVOCT. (B) presents more useful lesion tissue information to represent the detailed inner structure of the vessel than (A).
appearance between these two representations is easily observed that utilizing OCT technique can reflect. For example, the position and the region of neointimal hyperplasia (NIH) and the intervention stents can patently be displayed in the IVOCT image (Fig. 1.7 (B)), but under the condition of IVUS observing the corresponding tissue and stent in the same location is not an easy work for observer if without any specialist knowledge.
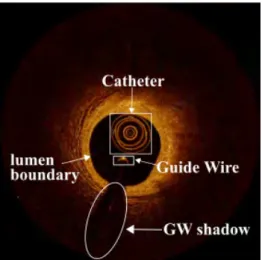
1.3 Atherosclerosis plaque types 9 With the high resolution, IVOCT presents the amount of content of the vessel inner structure in detail more than IVUS, although the reality is that the useful region in the IVOCT image is only the superficial area and the rest of the part of the IVOCT image supplies less beneficial information. Specialists in medical institutions apply the IVOCT for the measurements of the lumen, intimal elastic membrane (IEM), stent and the plaque characterization, including the angle, depth, thickness, area of lesion plaques, both in the step of pre-PCI lesion assessment and post-PCI lesion assessment[43, 78]. According to the representation of the vessel with OCT technique, a regular IVOCT image is comprised of an artery wall, a vessel lumen, a catheter imaging and a bright metal reflection of a guide-wire (GW) immediately followed by a black shadow region (Fig. 1.8), often also including residual blood artifacts inside the vessel lumen. As Sec. 1.1.1 mentioned, with the impact of the “risk factors”, the atherosclerosis plaque, which is a mass lesion or focal thickening, are usually generated in different layer architectures (intima, media and adventitia) resulting in loss of a layered structure of the vessel wall.
Fig. 1.8 The main components of an IVOCT image are comprised of a catheter (white big rectangle), a Guide-wire (white small rectangle), a GW sector shadow (white ellipse) and the vessel lumen with a black background.
1.3
Atherosclerosis plaque types
As atherosclerosis plaques explained in medical research, there are 3 main types of atheroscle-rosis plaque which can be discriminated by the OCT: fibrous, calcific and lipid plaques[94]. Previous studies [13, 28, 43, 93] described the features of atherosclerosis plaque characteriz-ing through histological correlation. Table 1.1 summarizes the IVOCT features of the main types of atherosclerosis plaque in accordance with [13, 18, 93]. Fibrous plaques have a low
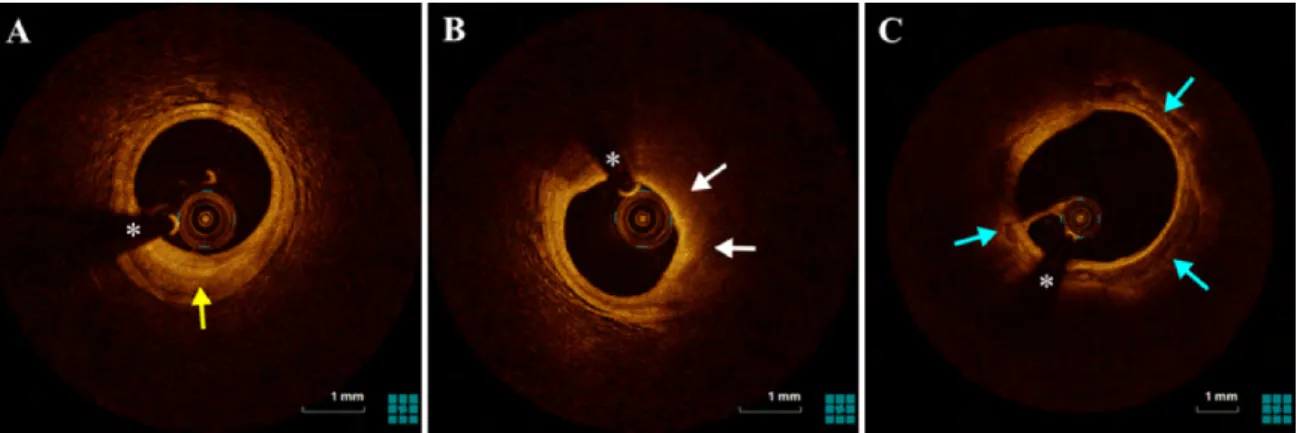
attenuation coefficient and are a bright tissue characterized as a homogeneous signal-rich region. Lipid plaques associate with a high attenuation coefficient and appear in heteroge-neous signal-poor regions with diffuse and irregular borders, which is usually depicted as a phenomenon of a superficial high signal region followed by a very low signal region. The calcified plaque is signal-poor regions but with sharp borders and presents a low attenuation coefficient. The above description of plaque characterizations can be observed in Fig. 1.9, respectively. Figure 1.9 (A) is the example of a fibrous plaque that presents a bright lesion tissue, and the thickness of the intima and media is larger than the condition in the normal vessel. In Fig. 1.9 (B), the contour of the vessel wall changes and the layer-structure of the normal vessel disappears obviously, simultaneously a low signal region appears (illustrated with white arrow). Different from Fig. 1.9 (A) and Fig. 1.9 (B), the lesion plaque in Fig. 1.9 (C) displays signal-poor regions with sharp texture borders, which is in accordance with the characterizations description of calcified plaque. As a matter of fact, it is known that the shape and representation of the plaques are diversity in representation. The representation for each major type of lesion plaques is variable and somewhat dissimilar during different periods for different patients, even with the condition of the same patient. As shown in Fig. 1.10, each row in the figure is the examples of the fibrous, lipid and calcified plaques with the representation of tissue diversity. Furthermore, other existing classes of plaque
Table 1.1 General characteristics of the main atherosclerosis plaque Plaque type Backscattering Attenuation Characterization Fibrotic moderate low Signal-rich, homogeneous
Lipid moderate high Signal-poor, homogeneous, irregular and diffuse borders
calcium low low Signal-poor, heterogeneous with low signal, sharp borders
components are also observed in the IVOCT images with intricate morphology (or mixed formation) to demonstrate the histological diversity[13, 78]:
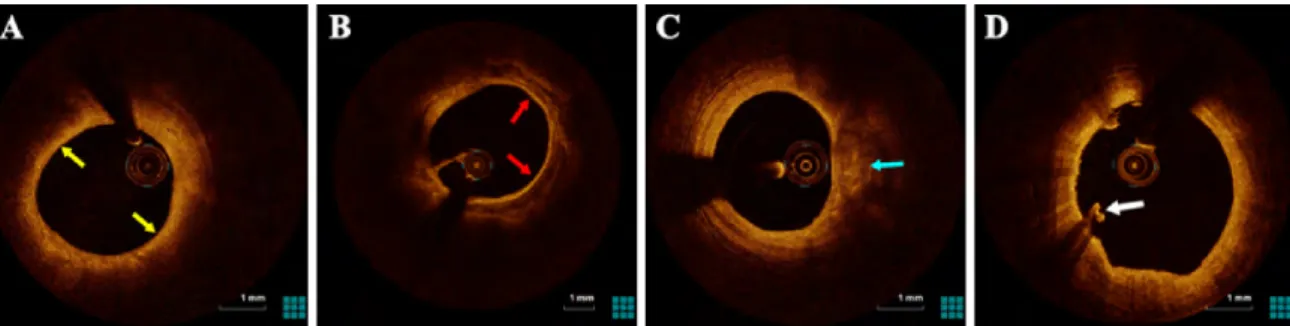
• Fibrous cap is a cap with thickness < 65 µm relating to plaque rupture (Fig. 1.11 (A)). – Thin cap fibroatheroma (TCFA), a general formation that usually is observed
1.4 Related work 11 • Fibrocalcific plaque that a kind of lesion plaque composes of fibrous and calcified two portions, where presents a circumferential bright lengthy and narrow region followed by a signal-poor heterogeneous region with sharp borders (Fig. 1.11 (B)).
• Mixed plaques (or heterogeneous plaques) containing calcific deposit with delineated borders and lipid-like region with unclear borders (Fig. 1.11 (C)).
• Thrombus described as a thick mass including red and white ones protruding into the lumen (Fig. 1.11 (D)).
Fig. 1.9 Three IVOCT image examples of the atherosclerosis plaque corresponding to the 3 types, (A) fibrous plaque (yellow arrow), (B) lipid plaque (white arrow), (C) calcified plaque (blue arrow), respectively. * denotes GW artifact.
Overall, for different periods and different patients, the representation of lesion tissues is variance. As a consequence, the complex structure of the inner human vascular requires a suitable imaging modality on the high resolution to capture the detailed tissue information. IVOCT as the new imaging technique with high resolution gradually is applied in the clinical research and microstructure investigation instead of IVUS, although the penetration depth of IVOCT is less than IVUS that only superficial region characteristics are expressed. In brief, IVOCT is a powerful and significant imaging modality to be employed on the clinical research of human vessel diseases and the quantitative measurement of vessel features.
1.4
Related work
IVOCT provides a high-resolution imaging approach to capture the vessel inner structure for the purpose of CAD treatment with the disease diagnostic assessments, plaque recognition and characterization, PCI lesion assessment, guidance PCI, and eventually, improves the understanding of the vascular biology of atherothrombosis and the relevant clinical outcomes.
Fig. 1.10 Illustration of diversity appearance with different shape, area, angle, depth and thickness for 3 major types of atherosclerosis plaque (fibrous plaque:yellow arrow, lipid plaque:white arrow and calcified plaque:blue arrow). * denotes GW artifact.
Fig. 1.11 Examples of other types of plaque components with different lesion morphology. (A) presents a fibrous cap region (yellow arrow) between the low signal region and the vessel lumen border. A heterogeneous region containing the fibrous plaque and calcified plaque is depicted as the fibrocalcific plaque in (B) indicated with red arrow. (C) is an example of mixed plaques combining calcific deposits with lipid-like region designated with blue arrow. (D) displays a lengthy and narrow protrusion tissue called thrombus (white arrow).
1.4 Related work 13 However, some challenges still exist to CAD specialists on the vessel diseases research and treatment by utilizing IVOCT as follows:
• Hundreds or thousands of image frames would be generated in an individual pullback scan for every treatment period of the patient, manual analysis becomes a heavy burden and time-consuming task to specialists, if without any reliable assist tool and automated image analysis methods
• Vessel lumen area measurement and morphology assessment based on lumen boundary segmentation with the condition of complexity and non-complexity
• Stent detection, contour evaluation and tissue coverage area measurement at every observation period after the stent implantation in IVOCT images
• Tissue characterization, plaque recognition and pixel-wise classification, the quantita-tive measurement of plaque in area, angle, thickness and depth
• Pre-processing of artifacts, including the elimination of the residual blood, as well as catheter and GW imaging removal, which truly impact the accuracy of the designed automatic methods
To overcome the above clinical problems and improve the effectiveness of CAD diagnostic and curing, previous studies have proposed various methodologies for semi-automatic or fully automatic in-vivo OCT images analysis and processing in artifacts removal, lumen segmentation, stent struts detection, lesion plaques identification and classification, and other relevant CAD clinical research tasks.
Artifacts Removal
As aforementioned in Sec. 1.2.2, a general IVOCT image without the stent implantation is a vessel inner structure imaging which is composed of the vessel wall, vessel lumen, the catheter imaging, a bright reflection of the GW and its dark shadow. Sometimes, the residual blood in the lumen is also captured and displayed in the IVOCT image if the blood in the checking segment of the vessel is not rinsed out completely before the catheter entrance. In the IVOCT image, the artifacts usually contains the catheter imaging, the metal reflection of GW and the residual blood. The elimination of the catheter, GW and the blood artifacts are the first facing challenges to researchers in their approaches when they complete the tasks of lumen boundary segmentation, stent detection, and both the above assessment examines. Too
little work has been devoted to mainly developing methods for the artifacts elimination, most method utilized the prior-information to remove the catheter and GW reflection imaging.
For the catheter removal, several papers[22, 54, 91] utilized the known information of the catheter cross-section position or the maximum radius of the catheter rings to straight-forwardly remove the catheter area. For example, [54] exploited the fact that the Dragonfly catheter diameter is ∼ 0.90 mm to remove the catheter according to its center position. Ob-serving that the position of the catheter is the same across all frames of IVOCT images, [22] computed the average intensity in the same position for catheter removal.
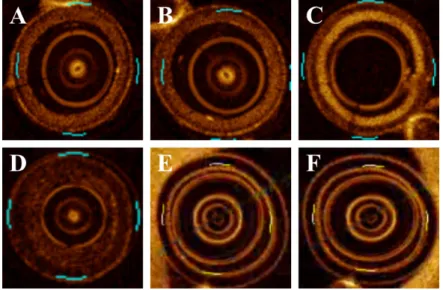
Ughi et al.[81] discovered that the catheter imaging is multiple bright concentric circular rings, and the internal structure of catheter always maintain a fixed appearance while the ex-ternal plastic sheet with deformed expression. They transformed OCT images from Cartesian space to the polar space and discovered that the concentric circular rings become vertical lines in the polar image domain. A rapid algorithm based on the Hough transform[50] was used to define curves and transform them into vertical lines in the polar domain. Then, detecting the largest distance of the concentric ring as the outer border of the whole inner structure of the catheter. In other papers[82, 83], Ughi et al. converted the polar IVOCT image to a binary formation using the Otsu method[65] firstly, and then applied a morphological operation (closing) to eliminate small holes inside the binarized IVOCT images. Subsequently, apply-ing an area constraint method to remove the individual pixel area because they considered catheter and GW imaging as unconnected regions containing pixels. If the area of these individual regions is smaller than a predefined threshold BWMA (black-white minimal area), it can be recognized as the catheter or GW.
Tsantis et al.[80] explained the reasons for the catheter distortion imaging that do not satisfy the circle parameterization due to the edge detection errors and the noisy pixels appearing nearby the catheter circle boundaries. They modelled two continuous concentric circles to limit the bright circles of catheter imaging. Then, through histogram of distances from the image center to the pixels inside the region defined by the two concentric circles, the pixels belong to the catheter would be detected.
The imaging GW presenting a bright metal reflection followed by a black shadow region impacts the lumen border segmentation and stent struts detection when it needs to assess the relationship between the vessel lumen morphology and CAD. Therefore, GW removing is also an important task for researchers. The diameter of GW in[54] is known as 0.3556 mm2, and the bright region of GW imaging is verified as 0.0496 mm2. Zhang et al.[92] converted each slice to a “accumulated intensity line” by adding all the pixels of each A-line to form as one intensity value. All the “accumulated intensity line” corresponding to the slices are compressed as one en-face image. Since the GW portion of the “accumulated intensity
1.4 Related work 15 line” presents low energy, a long dark bar can be observed obviously and be segmented with applying dynamic programming twice to locate its contour. Clearly, the single position of GW can be obtained from the detected black bar contour. This GW segmentation method is also utilized in paper[16, 81]. Wang et al.[91] characterized GW as a gap in the bright superficial layer, then found out the brightest pixels along the A-line within the gap to detection GW position.
Although the above approaches overcome the catheter removal and GW segmentation on certain situations, the limitation still exists. Prior information only solves the same model OCT equipment by using the known catheter diameter and the GW size. Most examines did not mention the cases that the catheter location nearby the lumen boundary and the irregualr catheter with distorted shape. The GW segmentation method in [81, 92] needs to compute all the slices instead of analyzing the single OCT image, which can not be developed as a real-time assistant tool for specialists’ clinical research. Other methods[60, 82, 83] employed morphological operations to segment GW pixel area with area constraint without considering the dynamic change. For the residual blood elimination, a general method is to apply the morphology operations (opening and closing, etc.) several times to remove the single pixel area[54, 81–83].
Lumen Boundary Segmentation
Morphologically and histologically, a healthy vascular lumen boundary is with a circle-like or ellipses-circle-like shape presenting homogeneous attribute and smooth curve without any protuberance substance. Accordingly, the morphology of luminal boundary is normally used as the first step to judge the healthy condition of the vessel. Sihan et al.[74] firstly proposed a fully automatic lumen contour detection in OCT images. They employed the Canny filter[15] to detect the edges in the IVOCT images. However, due to the multi-layer structure of the vessel and the big difference between the OCT datasets, extra edge segments would be produced. Thus, unnecessary edges are removed by using the dot product between the gradient orientation and the catheter center, for the residual short lines, a threshold of line length is set for judgment.
Observing the IVOCT images, it is no doubt that the lumen border is a divided line between the dark lumen and the bright tissue. A significant gradient changing occurs along each A-line from the center of the IVOCT image to the vessel wall, which can be used to describe the intensity profile characterization of the A-line. According to the principle of light attenuation, there is a peak intensity existing in the A-line and soon occurring intensity falling phenomenon. Utilizing this attribute, Ughi et al.[81, 82] extracted four properties
(peak intensity, shadow presence, length of a shadow and speed of the energy falling to a certain value) to distinguish the lumen border with other objects. The shallowest pixel rLsh(θ ) with its intensity approximately equal to half of the maximum intensity is located. Then, a 2-dimensional cubic smoothing spline f [23] is employed to fit all the selected points to obtain the final lumen boundary. Similarly, Wang et al.[88, 92] also focused on this obvious attribute that an obvious intensity variance near the border of the intima closing to the lumen. They segmented the lumen boundary by searching the contour that maximizes the energy difference between the sum of gray values outside and inside the boundary[92]. Dynamic programming[10] method is selected to find the optimal solution to solve the path problem. After recursively computing all the possible paths that satisfy the condition, a contour with the maximum accumulated energy would be determined as the final luminal border.
Utilizing morphological operations to segment the lumen boundary is also a general method. Macedo et al.[53] used the Otsu method to separate the vessel wall with lumen area firstly. And then, applying significant gradient searching from the bottom to top of the in vivo OCT image and setting the value of the region below intima layer as zero, and making the region containing intima layer as well as lumen area as one. Subsequently, a subtraction was employed between the Otsu-processed results and the zero-one setting outcomes. The final segment results were gained after a sequence of five dilations and five erosions for eliminating holes and shadows. Besides, Macedo et al.[54] investigated the bifurcation of the lumen through defining 13 descriptors (such as distance centroid, circularity, bending energy) to produce 104 features. With the orthogonal least squares, feature selection operation was applied to search for the best features. After that, three state-of-the-art classifiers (support vector machine, random forest and adaboost) were implemented to classify the IVOCT images with bifurcation situations.
In [60], Moraes et al. utilized Discrete Wavelet Packet Frame to extract features and separate tissue information, which made an adequate data for the next step. Subsequently, the Otsu threshold was used to binarized the processed result for the lumen boundary segmentation in the polar domain. Gurmeric et al.[30] shot rays from the center point of the IVOCT image to each angle, subsequently, two Catmull-Rom splines were used to initialize the lumen boundary. At last, the desired boundaries were obtained via an edge-based active contour framework and the area of region of interesting (ROI). Tsantis et al.[80] denoted that the class probability of a pixel was depend on the membership of its neighbors. They combined the conditional and contextual information as the input of Markov random field (MRF) to determined the pixel class. The textural information in [80] was computed through continuous wavelet transform for each pixel. Roy et al.[72] built up a model that splitting the IVOCT image into two disjoint parts, Ilumen and Itunica. Combining with the optical
1.4 Related work 17 backscattering principle, its maximum was refined using a global gray-level statistic and was employed as the initial seeds of the random walks image segmentation to the lumen and tunica. Cao et al.[16] focused on the segmentation of the irregular lumen caused by the GW shadow, blood artifacts, bifurcation vessel. They proposed a divide-and conquer strategy to eliminate GW, then a gradient-base level set model utilizing edge information was established. To overcome the noise affection, paper[16] employs a Gaussian filter based on the kernel size of N × 1 and N × N respectively to the bottom and top of the IVOCT image within the polar system.
Stent Detection
Stent implantation is an effective treatment for the patients to implement the coronary revascularization procedure. It can decrease the symptom caused by CAD and increase the life-time of patients through enlarging the area of the vessel lumen to let blood flow normally.
Wang et al.[89] synthesized an en face image that each line in this image was the “accumulated intensity line” by adding all the pixels along the A-line direction. A single case of the hundred IVOCT images can form the en face, where each line was derived from average intensity computation of the superficial pixels from the lumen border to a certain depth along the A-line direction. To detect stents in en face image which reveal the 3-dimension spatial information, Wang et al. utilized the minimum spanning tree to detect all the stent points. Similarly, in paper [90], to imporve the detection accuracy of stent and enhance utilizing the 3-dimension knowledge of stent structures, Wang et al. used a Bayesian network based on physical principles of OCT imaging to investigate the stent detection. They computed the probability of each A-line to roughly estimate the stent depth through 3-dimension information, subsequently, all struts’ depth location in a pullback are obtained.
As the obvious features to the stent strut, shadows behind the small bright is an evident appearance to be utilized detecting the stent. Gurmeric et al.[30] analyzed the angular intensity energy distribution to find out the clues of dark shadows. They built up an energy map that transmitting rays from the image center to any angle to discover the trace of struts by investigation of falling and rising of energy on these rays. Strut position was determined through a second analysis over the detected shadow rays. Besides, NIH was discussed with the assessment of minimum NIH cases and mild to severe NIH cases. In paper [87], peak point detection, candidate pixel selection and shadow edge detection were investigated for the stent detection in NIH. Lu et al.[51, 52] introduced features of the candidate stent and the shadow region to detect strut locations. Totally, 17 intuitive characteristics were designed to depict the bright reflecting and shadow dark attributes. Thresholds and bagged decision trees
were used to analyze the maximum possible stents in IVOCT images. As in [82], Ughi et al. described the stent with properties of high peak intensity, very fast rise and fall of energy and a significant drop in intensity based on the four attributes mentioned in Section of Lumen Boundary Segmentation. Other features, such as mean, maximum and sum of values above mean, were also utilized in the polar domain to discover the location of stents.
In [9, 24], clusters of malapposed and uncovered stent struts as a topic research were implemented. In [9], the mean and maximum malapposition distance within each cluster, the length of the cluster and the number of quadrants were introduced to characterize malapposed stent. Study [24] constructed a score map to reflect the overall apposition of a stent suing the interpolated distance between the stent and the lumen and supply as qualitative measurements of the stent position.
However, the bright reflection may also be caused by inner tissues of the vessel, and sometimes some stents do not show bright reflection. In these cases, it is hard to detect stents without considering the black shadow area behind them. Therefore, it is difficult to detect stents from the series of IVOCT images stably by using fixed threshold values. Moreover, the effect of luminal residual blood, image noise, guider-wire, and the catheter are also considerable reasons for the change of the intensity of the IVOCT image. Some reports analyzed a limited number and type of the cases in stent detection. Furthermore, few types of research investigated the detection of stents with neointima coverage.
Plaque Identification and Classification
Considering the IVOCT images formation that the catheter received a reflected signal of the vessel tissue and these sampled signals are constructed to an IVOCT image through the OCT equipment, A-line profile attributes are directly utilized for plaque detection and recognition analysis. Therefore, traditional methods based on machine learning principally focused on the feature extraction of A-lines. Rico-Jimenez et al.[71] modelled each A-line as a linear combination of N depth profiles (p1, . . . , pN) and assessed the category of each A-line with
a least-square optimization strategy. The divergence of optical attenuation among lesion plaques is regarded as a significant feature of A-line for the plaques recognition[66, 83, 86]. Athanasiou et al.[11] presented a method that extracting totally of 42 features for each pixel and then used a random forest classifier to classify four tissue types (calcium, lipid, fibrous and mixed tissues). Besides, with conventional approaches, segmentation and quantitative assessment of the fibrous cap and the border detection of the calcium plaque was investigated in [12, 18, 29, 88, 91, 92].
1.5 Purpose of this thesis 19 Other literature applied the CNN-based methods to recognize the images containing lesion tissues or as a feature extractor supplying features to the classifier. Kulluru et al.[41] used A-line as the fundamental unit and recognized its type with the deep learning method. Gessert et al.[25] discussed the recognition capability of two designed CNN models and applied their method both on Cartesian and polar images. Features extracted through pre-trained CNN were employed to three classifiers for the coronary layer identification by Abdolmanafi et al.[7]. Also, they evaluated three different pre-trained CNNs and obtained the final classification results through voting of the outcomes of these CNN models[6]. Meanwhile, other groups aimed to classify the detected lesion regions at pixel-level and proposed lesion tissue identification methodologies based on semantic segmentation technologies. With the CNN method, He et al.[32] determined the pixel category of the IVOCT image by analysis of a cropped tissue patch. Cheimariotis et al.[21] proposed two steps method to classify the plaque type by applying AlexNet. Utilizing the CNN as the feature extractor for each pixel could obtain a high accuracy of lesion plaques segmentation, but the fact is that an effective region of a single IVOCT image contains numerous pixels, which costs much more time to gain the recognition results. Fortunately, fully convoluational neural network (FCN) (e.g., U-Net and SegNet) were applied for the semantic segmentation of lesion tissues of IVOCT images to overcome the mentioned problem. Zhang et al.[96] compared two approaches (U-Net and SVM) for the identification of plaque types. Oliveira et al.[64] and Gharaibeh et al.[26] both utilized SegNet for the calcifications segmentation and assessment. Lee et al.[47] firstly compared the lesion tissue segmentation results through employing two deep learning models (SegNet and Deeplab V3+), respectively, and then assessed the clinically relevant measures based on the acquired results.
1.5
Purpose of this thesis
The research purpose of this thesis is comprised of the following parts:
1. Well understand the principle and pattern of the OCT imaging modality, the characteri-zation of tissues, lumen wall, layer structure, stent structs, residual blood, atherosclero-sis plaque of in-vivo OCT
2. Constructing a reliable pre-processing framework of IVOCT images: including speckle noise eliminating, catheter imaging region removal, GW and the section black shadow region detection, artifacts removing(residual blood, non-uniform rotational distortion, etc) algorithms, etc.
3. Researching a novel and rapid lumen segmentation method that processing the bifur-cation and irregular morphology cases, which is employed in an individual IVOCT image with real-time when specialists face the treatment of CAD, and simultaneously as an approach to obtain the values of the qualitative measurements of the lumen 4. Developing a rapid stent detection method which not only focuses on the research
of normal stent strut recognition but also including the condition of neointimal and malapposed
5. Investigation of feature extraction with considering the variance characteristic of tissue attenuation along the A-line direction on the region of interest (ROI) or available and analyzable regions belong to the superficial area in the IVOCT image
6. Investigation of developing an automatic method for the classification of lesion tissues with deep learning, and trying to build up a deep learning model for the research of semantic segmentation
1.6
Overview of this thesis
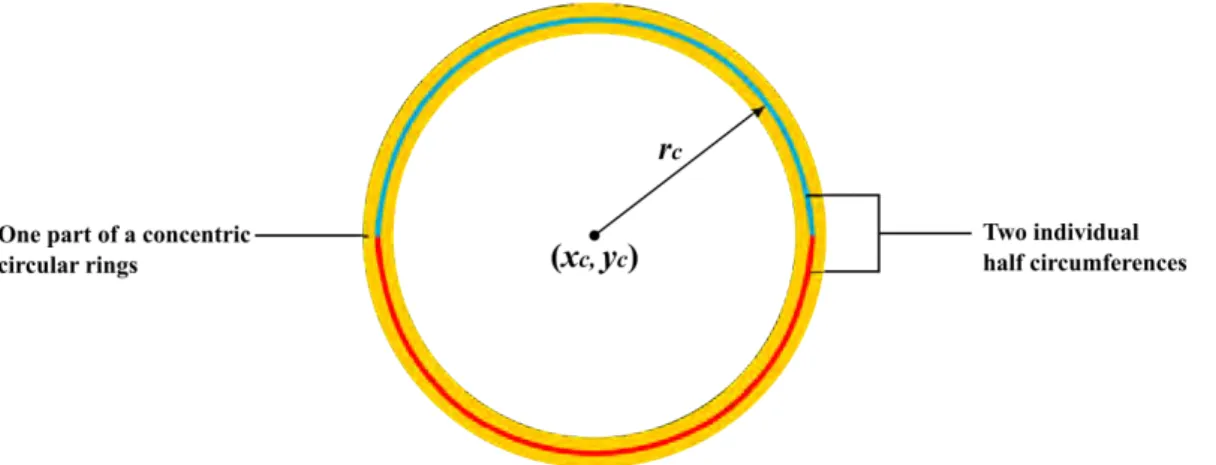
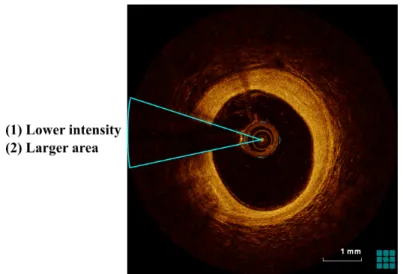
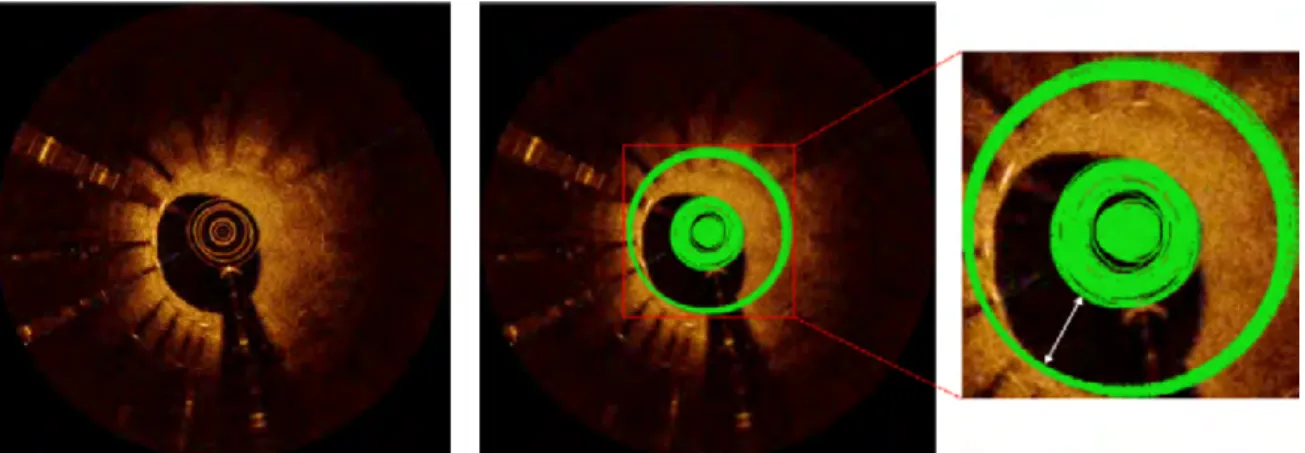
Chapter 2 discusses pre-processing methods for the catheter imaging circle region detection, GW dark shadow sector segmentation and residual blood elimination. For the catheter imaging removal, according to its circular shape and the structure consisting of several concentric rings, I constructed a circle detector for matching the circle pattern of the catheter imaging in the IVOCT image center region. Dynamically changing the radius of the circle detector to maximally cover the catheter region. For the GW bright spot detection, I detected the GW black shadow region instead of directly recognizing the GW bright spot by proposing a new automatic method building a circle-ring detection model. The possible portions as a part of the GW shadow can be obtained with our algorithm, then an entirety GW shadow region is segmented through the computed angle which can also be used in the lumen boundary detection to remove the GW borderline. Besides, residual blood is also eliminated through the Otsu method and morphological operations in this chapter.
Chapter 3 explores automated methods for lumen boundary segmentation and stent sturts detection. Analysing the intensity changing of the A-line profile, the intensity changing from the lumen area to the vessel wall presents a phenomenon of value mutation on the A-line. Simultaneously, after the peak intensity, fluctuating changes in light intensity behave differently. I chose the statistic variable (standard deviation) as the basic analysis factor and formed a new value with thresholds and coefficients for the lumen border and stents detection.
1.6 Overview of this thesis 21 After acquiring the candidate points of bright reflection spots, adaptive region growing is applied for the GW removal to confirm the final stent spots. In our stent detection method, the stent covered with neointima could also be identified.
Chapter 4 focuses on the recognition and classification tasks of vessel lesion tissue by extracting tissue features with traditional methodologies. To determine the plaque distribution of the visible vessel wall, simultaneously, utilizing the 2-D A-lines region instead of 1-D single A-line profile for feature analysis, I proposed a local multi-layer model using the A-line sub-region (ALSR) as its basic element for feature extraction research. Different features of ALSR were extracted along the radial and circumferential dimensions to discuss the statistical intensity information of three types of plaques. Furthermore, I also employed the gray level co-occurrence matrix to gain the texture information of ALSR from the superficial layer. All these features were finally put into a machine learning classifier (random forest) to predict the classes of the ALSRs. This method can solve the angle distribution of lesion tissue in the circumferential dimension.
Chapter 5 explores using the deep learning methodologies to ALSRs for the deep features extraction. Given the advantage and architecture of VGG-Net, and considering the size of each ALSR, I constructed an 11-layer VGG-like deep neural network to complete this task. Additionally, using Local Binary Pattern (LBP) for the texture information analysis to process the input data, and examining the effect of channel amount on the ALSR classification, I used LBP to generate a single-channel input and merged it with RGB channels to produce a four-channel input data. Three kinds of the channel (LBP, RGB and LRGB) in the designed and learned 11-layer deep learning model were tested. The experiment showed that four channels performed better than the other two types.
Chapter 6 employs the pixel-wise classification of lesion plaques with the semantic segmentation technique of deep learning. To reduce the learning time and improve the pixel classification accuracy, considering the analyzable region of the IVOCT image simultane-ously, I segmented the IVOCT image with a level-set method to create the region of interest (ROI) of the superficial layer of the human vessel wall. Each input data derived from the ROI is the patch that cropping the ROI with fixed width and height. Hence, an ROI of one IVOCT image can create a number of cropped patches containing some reduplicated pixels. Placing the prediction result of each patch to a 2-D space according to its original position, and using these 2-D regions to construct a 3-D volume of which the third domain is the numbers of input data (or cropped patches from one ROI). The class of every pixel with the same location in the 3-D volume is finally determined by the maximum number of the prediction results of each pixel.
Chapter 7 gives out a conclusion for each part of this thesis, and discuss the existing problems and future work.
Chapter 2
IVOCT pre-processing
2.1
Image acquisition
IVOCT image data were acquired by using a Fourier-Domain OCT imaging system (ILUMIENTM OPTISTM, Abbott, Santa Clara, California, USA) and an intravascular OCT catheter (DragonflyTM OPTISTM, Abbott, Santa Clara, California, USA) at Wakayama Medical University. The above system used in the Department of Cardiovascular Medicine at Wakayama Medical University is called OCT diagnostic imaging system with a JMDN code of “70031000”, and the general name of the catheter is the intravascular radiographic catheter with a JMDN code of “70275000”. The 2.7 Fr intravascular OCT catheter of the mono-rail rapid-exchange type was advanced to the distal coronary artery over a 0.014-inch conventional angioplasty guide wire through a 6 Fr guide catheter. As near-infrared light penetrates only a short distance through blood, temporary blood clearance is required for OCT imaging. In order to clear the blood in the human vessel, preheated contrast media at 37 degrees Celsius (Omnipaque 350 Injection, Daiichi Sankyo Co, Ltd, Tokyo, Japan) was flushed through the guiding catheter at a rate of 2-4 ml/sec for approximately 3-6 seconds using an injector pump (Mark V; Medrad, Pennsylvania, USA). When a blood-free image was observed, the OCT imaging core was withdrawn at a rate of 18 mm/sec using the stand-alone electronic control of the pullback motor. For each signal transmitting and receiving, it is called the A-scan procedure to obtain each A-line data depicting the current tissue signal in the radial direction through the OCT technique. A complete A-scan containing the tissue signal is transmitted to the computer console to produce a full cross-section image presenting the inner situation of the vessel. During the pullback period of the catheter, which is called a B-scan procedure, the number of cross-section images (frames or slices) for one patient treatment were generated, and these OCT images were stored digitally for the subsequent analysis.
Two kinds of pullback speed exist in this OCT system, one is 18 mm/sec and the other is 36 mm/sec. The catheter cost 3 seconds over a distance of 54 mm with each frame interval of 0.1 mm and the latter cost 2.1 seconds on the distance of 75 mm with each frame interval setting as 0.2 mm. The data frame rate was 180 fps. This OCT system has both axial and lateral resolution < 20 µm. In guidance materials, its range is 12–15 µm and currently, the spatial resolution in these laboratory image data is 9.9 × 9.9 µm. The catheter radiates light along axis direction to scan the vessel inner wall tissue with the movement of pulling back. A single vessel OCT image is formed by A-lines that contain the information of reflected light from the vessel tissues[13]. With a rotating catheter, a cross section of the vessel is obtained to present the details of the in-vivo vessel. In the OCT system, the IVOCT images are modeled with the OCT signal ⟨Id(r)⟩ which is denoted by fitting a single scattering model ⟨Id(r)⟩ = T (r) · S(r) · I0· exp(−µt· r), (2.1)
where r denotes the penetration depth, T (r) is the point spread function of the catheter[85], S(r) indicates the signal roll-off with scan depth, parameter µt is the attenuation coefficient.
Equation 2.1 is fitted every A-line starting from the lumen border in the polar domain to use a small window with variance length to obtain the tissue attenuation, which is also utilized to describe the signal with the homogeneous property. Generally, the vessel wall is a heterogeneous structure, that is the category of tissue along the radial is diverse. Hence, different tissues present different attenuation coefficient, ⟨Id(r)⟩ of an A-line usually would fit more than one type. Furthermore, the intensity of each scanning A-line progressively decreases with depth increasing and each type of tissues has a different light attenuation coefficient. These characteristics are described in Lambert-Beer law[40, 86].
2.2
IVOCT image conversion
Notably, the coordinate of original IVOCT images stored in the OCT system is in the form of a polar domain, which is not convenient to analyze by using computer graphics and image technologies, sometimes. Therefore, it needs to convert the original IVOCT image to the Cartesian domain to obtain the IVOCT imaging as same as the morphology and structure of the real cross-section of the artery. Although this conversion can be performed through the OCT system if necessary, the interconversion that transforming of polar coordinate to Cartesian coordinate (P2C) or Cartesian domain to the polar domain (C2P) normally occurs in the subsequent IVOCT image processing procedures. As shown in Fig. 2.1, a convert