Impact of Increasing Capital Flows on the Real
Economy and Financial Markets in Japan:
Ineffectiveness of Monetary Policy Instruments
Hideaki
O
HTA※Abstract
This paper examines the effectiveness of monetary policy on domestic monetary and financial markets as well as the real economy in Japan under increasing capital flows in Japan from 2001 to 2013, based on the VAR (Vector autoregressive) model. The result shows that the monetary policy instruments (monetary base,the Bank of Japan current account, and call rate) have become increasingly influenced by capital flows recently. Particularly, the effects of capital flows, especially short-term capital flows (portfolio, other investments, derivatives), have put significant impact on the major monetary policy variables. It is also shown that the excess reserves of the BOJ account may be utilized for financial investment, not for productive investment in the real economy. The monetary policy has thus become less effective in controlling the domestic market, as part of the policy tools used in reviving and expanding the real economy. Therefore, Bank of Japan is expected to take sensible monetary policy in the context of the global economic and market conditions, especially the international capital flows, which are significantly influenced by the monetary policy of advanced economies.
Introduction
The effects of monetary easing policies, particularly Quantitative Easing (QE) [2001-2006] on the financial market and the real economy, have been studied by several scholars, but there has not been any consensus whether such a policy has put positive impact on the real economy in Japan. Moreover, it would be important to consider the aspect of increasing international capital flows, which have put significant impact upon the capital market and monetary policies in any country
© The International Studies Association of Ritsumeikan University:
Ritsumeikan Annual Review of International Studies, 2013. ISSN 1347-8214. Vol.12, pp. 115-150
especially after the Global Financial Crisis (2008), under monetary easing policies adopted by advanced countries.
This paper examines the effectiveness of Bank of Japan (BOJ) s monetary policy on domestic monetary and financial markets as well as the real economy in Japan under increasing capital flows from April 2001 to August 2013, based on the VAR (Vector autoregressive) model.
Bank of Japan initiated the QE in 2001, which was terminated in March 2006, while BOJ continued the Zero interest-rate policy introduced in 1999. Monetary easing policies have been introduced not only in Japan, but also the USA and Europe since the Global Financial Crisis, triggered by the Lehman Shock in September 2008. BOJ introduced Comprehensive Monetary Easing since 2010, which is followed by Quantitative and Qualitative Monetary Easing (QQE) Policy. QQE includes the program of asset purchase, with bond buying by US$1.4 trillion in two years , started under the new Governor Kuroda in Spring 2013.
The global market has bottomed out, and stock prices in Tokyo as well as New York have gone up significantly since December 2012, when the FRB introduced the additional policy of third round of quantitative easing (QE3). The new phase of QE3 includes large-scale asset purchases, through trading of Government Bonds (T-Bills) with the amount of $ 85 billion per month in addition to mortgage-backed securities (MBS). This measure have resulted in massive capital flows in the global market.
The monetary and financial market in Japan has become increasingly influenced by the global capital flows, and that has affected the domestic monetary policy by the Bank of Japan recently. The new QQE policy pushed up stock prices with depreciation of exchange rate of Yen byMay 2013. However, such a measure has not directly increased in bank lending and the domestic industrial production. In this regard, the monetary easing policy of FRB s QE2 also has not
been proved as effective in reviving the US economy.1
The global liquidity has been increased by the quantitative monetary easing policy introduced in major advanced countries, including the US monetary easing (QE2 and QE3), and such policies have increasingly influenced on the monetary policy in many countries. Japanese monetary market is also considered to be
1. Martin Feldstein argues that QE2 led to a rise in the stock market, which in turn contributed to increasing consumption and the strong performance of the US economy in late 2010 (Statement on 24 February 2011). However, QE2 has put significant effect on the pressure for currency appreciation and inflation, and the higher commodity prices in the global market, while the effects on the domestic economy is not significant. The effect of QE3 is also questioned by Mr. Fischer, Governor of Dallas Reserve Boad (See Bloomberg dated 10th April, 2013).
increasingly affected by the capital flows.
This paper has examined the effects of BOJ s monetary policy on the market as well as the real economy during the period from April 2001 to August 2013, based on the analysis of VAR model, including variables such as monetary base, BOJ Current Account, as well as call money (overnight non collateral interbank rate). The other variables include money stocks (M2), bond yield, real effective exchange rate, bank lending, and industrial production.
The major findings of the analysis obtained in this paper are summarized as follows:
First, the BOJ s monetary policy has become increasingly ineffective, in the sense that any monetary policy instrument (BOJ Current Account, Base Money, and Call Rate) has put insignificant effect on the monetary and financial market
as well as the real economy over the whole period 2.
Second, the domestic monetary easing policy has not been effective in expanding the productive activities and there has not been causal relationship between monetary policy variables and industrial production.
Third, monetary easing policy has become ineffective in providing positive impact on the stock market since 2006, so that there is no significant effect on industrial production even indirectly via stock markets.
Fourth, those monetary policy variables have strengthened causal relationship with short-term capital flows, and that also affected the domestic monetary and financial market recently, especially after the Global Financial Crisis.
1. Research on Monetary Policy in Japan
A number of studies have been undertaken on monetary policy and its effects on the monetary/financial market as well as the real economy in Japan, but past studies mostly have focused on the period of QE (2001-2006) very few research on the impact of monetary policy on the economy and the domestic market after 2006 has been undertaken until today. Moreover, the studies in the past mainly focused on the domestic market variables, and there are very few studies which deal with evaluation on the monetary policy and its effects on the financial and real economy, taking into consideration the effects of capital flows in Japan.
Several studies suggest that the QE (2001-2006) in Japan put the bond yield lower and had certain impact on the maturity of the bonds. For example, Okina
2. Noguchi(2013b) maintais that monetary easing policies in Japan as well as that in the USA have not resulted in positive effect on the real economy.
and Shiratsuka (2004) and Baba et al. (2006) indicated that the monetary easing policy did lower the yield curve of the government bond (JGB) with longer period, but the effects on the price levels and the real economy were limited. Ugai (2006) also suggested that there was some lower risk premium during the QE period (2001-2006). Kimura and Small (2006) indicated that some effect on portfolio rebalance, which shows that risk premium is higher for stock prices, while that of corporate bonds with higher credit ratings is lower after the introduction of the QE.
Shirakawa (2008,2009), on the other hand, pointed out that the effect of QE on the real economy was insignificant, while he admitted some certain effect on the overall stability of monetary system was observed in Japan. Shiratsuka et al. (2010) also pointed out that QE might put expectation of easing policy to be positive among the private sector, but the effect on the real economy is limited.
Komiya (2002) criticized ineffectiveness of the monetary easing policy in the sense that it could not increase in the money stocks. Noguchi (2013a) also maintains that monetary easing policy has not been effective in putting positive impact upon the real economy, and that it would be difficult to put the economy out from deflation, though he admited that some effect in terms of the policy duration effect of the government bonds and yield curve.
Monetary policy should be used to have impact on the real economy (GDP), and in this respect, Voutsinas and Werner (2011) insists that bank credit growth as one of the more orthodox intermediary targets should be emphasized, and maintains that the Quantitative Easing policy in Japan during 2001-2006 was not very effective to achieve a stable long-term relationship with nominal GDP growth.
Major analyses based on VAR models on the monetary policy in Japan have been initiated in the 2000s, including the work by Teruyama (2001), which shows monetary policy had become ineffective, but the study was confined to the analysis in the 1990s. The major studies on monetary policy cover almost all the period of Quantitative Easing Policy (QE) (2001-2006). Harada and Masujima (2008) pointed out the effectiveness the Quantitative Monetary Easing on the real economy through stock market, based on the VAR model. Honda, Kuroki and Tachibana (2010) also show the effectiveness of monetary easing policy (2001-2006) by adopting variables of CPI, industrial production, call rate, BOJ Current Account, Nikkei stock prices, and industrial production, based the VAR models. The study by Honda and Tachibana (2011) extended the covered period from 1996 to March 2010, including dummy variable for the period of Quantitative Monetary Easing (2001-2006), and claims that monetary policy was effective in increasing
industrial production through the route of stock market. Honda (2013) further indicates that significance of Quantitative and Qualitative Monetary Easing since 2013 in terms of expanding the monetary base.
These studies based on the VAR models are basically analyses of the Quantitative Easing Policy period (2001-2006), but not covered more recent period until today. Therefore, the results of previous studies may not be valid for the discussion on the period after 2006. Most studies in the past have not examined the effects of monetary easing policy after the Lehman Shock (2008), including the BOJ s Comprehensive Monetary Easing (CME) since 2010, and the current QQE Policy Phase since Spring 2013.
It should not be underestimated that the impact of capital flows on the domestic monetary and financial markets and monetary policy in Japan. Recent cross-border capital flows, especially short-term capital, have put significant effect on the global market. Despite the fact that international capital flows have put significant impact upon the domestic market and the real economy, the major past studies have not taken up the aspect of international context of the effects of capital flows on the domestic monetary and financial markets, as well as domestic
monetary policy in Japan 3.
This paper analyses the effects of monetary easing policy in Japan, not only during 2001-2006 but also the post QE period, from 2006 until 2013(August), based on the VAR models. The results of the study show that monetary policy variables (monetary base and BOJ Current Account, call rate) have been ineffective in controlling the monetary and financial markets, as well as the real economy. It also shows that the effect of monetary policy has now become ineffective in providing positive impact upon the industrial production, not only through bank lending but also though the channel of stock market recently. This could be due to capital flows under theFRB s monetary easing policy, especially QE2(October 2010 to June 2011), as well as the current QE3.
2. Monetary Policy and Financial Market in Japan
Monetary base in Japan has increased significantly, as compared with the early 2000s, and it amounted to 98.8 trillion Yen as of Octoer 2013 (Fig.1). On the other hand, call rate has remained in low level, except the period between 2006 and 2008 (Fig.2).
3. In this regard, Miyao(2006) shows that monetary policy had become ineffective in the 1990s through the analysis based on VAR model.
The size of the monetary base and BOJ Current Account in Japan are almost 36% of GDP (estimated as of September 2013) and 18.7%, higher than that of the USA with 20.8% and 13.6%, respectively(Fig.3).
Fig.1 Monetary Base and BOJ Current Account
0 200,000 400,000 600,000 800,000 1,000,000 0 500,000 1,000,000 1,500,000 2,000,000 1999 2000 2001 2002 2003 2004 2005 2006 2007 2008 2009 2010 2011 2012 2013
Fig.1 Monetary Base and BOJ Current Account
Source: Bank of Japan
BOJ Current Account (RHA)
QuanƟƚĂƟve Easing Comprehensive Monetary Easing
Monetary Base (LHA)
(100million Yen) QuanƟtaƟve & QualitaƟve Easing(right) Comprehensive Monetary Easing (100mn Yen)
Fig.2 Call Rate and Bank Lending (Japan)
-8 -6 -4 -2 0 2 4 6 0.0 0.2 0.4 0.6 1999 2001 2003 2005 2007 2009 2011 2013
Fig.2: Call Rate and Bank Lending (Japan)
Call Rate (LHA)
(y/y, %) ( %)
Sources: Bank of Japan, InternaƟŽnal Financial StaƟsƟcs database (IMF)
Lending(RHA)
Fig.3 Monetary Base & Reserve(Japan & USA)
0 10 20 30 40 1999 2001 2003 2005 2007 2009 2011 2013
Fig.3 Monetary Base 䠃Reserve (Japan & USA)
MB(Japan) Reserve(Japan) MB(US) Reserve(US)
Note: Fiscal Year (Japan) and Calendar year (USA) Figures of 2013 esƟmated based on September 2013. Sources: Bank of Japan, Cabinet Oĸce of Japan , Federal Reserve Board, BEA (USA)
Despite such a monetary easing policy, industrial production has not increased until today (Fig.4) The money stock (M2) has no close correlation with the industrial production, and it suggests that bank has not provided lending the productive sector (Fig.5).
Capital flows have influenced on domestic money stocks (M2), which is shown by the fact that the changes in M2 have negative correlation with capital flows (Fig.6). This could indicate that money stock held in the domestic financial sector has been mobilized for overseas lending and financial investment, not in the domestic market.This trend has become significant in recent years after the Global Financial Crisis. Thus, money stock is closely linked to the overseas market under the current regime of capital market liberalization. It is necessary, therefore, that monetary policy should be analysed under the context of capital flows that put significant effects on the domestic market.
Fig.4 Monetary Base & Industrial Production (Japan)
60 70 80 90 100 110 120 500,000 700,000 900,000 1,100,000 1,300,000 1,500,000 1,700,000 1,900,000 1999 2001 2003 2005 2007 2009 2011 2013
Fig4.: Monetary Base & Industrial ProducƟon (Japan)
Sources: Bank of Japan, InternaƟonal Financial StaƟsƟcs (IFS) database (IMF)
ProducƟŽn (RHA) Monetary Base(LHA) Lehman Shock (2005=100) (100million Yen)
Fig.5 M2 & Industrial Production (Japan)
0 2 4 6 60 70 80 90 100 110 120 1999 2001 2003 2005 2007 2009 2011 2013
Fig.5: M2 & Industrial ProducƟon (Japan) (y/y, %)
(2005=100)
Sources: Bank of Japan, InternaƟonal Financial StaƟsƟcs (IFS) database (IMF)
M2(RHA) ProducƟon(LHA)
3. Vector Auto regression (VAR) Model and Analysis on Monetary Policy
This section is devoted to explanation on the VAR (Vector auto regression) model to be used for analysis on the effects of monetary policy on monetary and capital/ financial market, foreign exchange, as well as the real economy in Japan in the next section (Section4) . The effects of capital flows on the monetary policy variables are also examined by the VAR in Section 5.
The variables (monthly) include Bank of Japan Current Account (BOJ AC), Monetary Base (MB), Call Rate, Real Effective Exchange Rate (REER), CPI, Money Stock (M2), Government bond yield(Yield), Nikkei stock prices (Nikkei), Industrial production (seasonally adjusted, [Prod]), Bank Lending. Capital Flows variables include: Foreign Direct Investment (FDI); Portfolio Investment (Portfolio); Other Investment (Other), Derivatives (Derivative). Logarithm is used for BOJAC, MB, REER, M2, and Nikkei.
The whole period (2001-2013) is divided into four periods:
( i ) Quantitative Monetary Easing Period (April 2001- March 2006) ( ii ) Period until Lehman Shock (April 2006 – August 2008)
(iii) Post-Global Financial Crisis Period (September 2008 – February 2011) (iv) Comprehensive Monetary Easing (CME) and Quantitative and Qualitative
Monetary Easing (QQE) by Japan (March 2011 – August 2013) The sources of variables are used as follows:
Fig.6 Capital Flows (Net) and M2 (Japan)
0 1 2 3 4 5 -60,000 -40,000 -20,000 0 20,000 40,000 60,000 80,000 1999 2001 2003 2005 2007 2009 2011 2013
Fig.6: Capital Flows (Net) and M2 (Japan) (y/y, %) (Trilion yen )
Sources: Bank of Japan, ternaƟŽŶĂl Financial StaƟsƟcs (IFS) database (IMF)
M2(RHA) Capital Flows (LHA)
Variables Abbriviation Sources
Bank of Japan Current Account BOJ AC Bank of Japan (major data series) BOJ Monetary Base Monetary Base (MB) Bank of Japan (major data series) Overnight interbank rate Call Rate Bank of Japan (major data series) Capital Flows(FDI、Portfolio Bank of Japan (major data series) Investment, Other Investment FDI, Portfolio, Other, Derivative
Derivative)
Real Effective Exchange Rate REER BIS effective exchange rate indices Consumer price index CPI Statistical Office (Japan), International
Financial Statistics (IFS) database (IMF)
Money Stocks M2 Bank of Japan (major data series)
Government Bond Yields Yield IFS database (IMF) Nikkei Stock Prices Stock(Nikkei) Nikkei Profile database
http://indexes.nikkei.co.jp/nkave/archives/data Bank Lending Lending(y/y) Bank of Japan (major data series) Industrial Production Production(Prod) (2005 = 100) IFS database (IMF)
3.1 Vector Auto Regression (VAR) Model
The VAR model used in this paper is based on the equation given below. The first shock is provided by the monetary policy instruments (variables), including BOJ Current Account (BOJAC), Monetary Base, and Call Rate. The other variables include market variables such as money stocks(M2), average government bond yield (Yield), and Stock Prices(Nikkei), as well as other variables of Banks lending (Lend), Real Effective Exchange Rate (REER), Consumer Price Index (CPI), Industrial Production (Prod), Industrial Production (Prod).
The order of each variables of the VAR model is determined by the shock of the monetary policy and the impact on the market and the real economy.
Yt = c + A1Yt-1 + A2Yt-2 + ... + ApYp-l + Bεt
Where c is constant vector matrix; At :(n×n) matrix; εt:(n×1) Shock Vector;
B:εt (n×l):matrix for changing the disturbance term vector (ut) (ut = Bεt)
The variables are in principle are used for the analysis with first-order difference to have stationality, except some variables which are used at level include the industrial production (y/y), FDI. The lag order by SIC (Schwarz criterion, or Bayesian information criterion, BIC), Variables:BOJAC [or MB or Call Rate], REER, CPI, Nikkei, Production.
VAR Models are for estimating the impact of monetary policy shocks on the domestic monetary/financial markets and industrial production (for Model 1) and that of monetary policy on the foreign exchange, as well as industrial production via stock markets (for Model 2). The effects of capital flows on monetary policy variables are analysed by Model 3.The models include the following variables, and
the Choleski ordering is determined as the shock of monetary policy variables and relevant variables as follows:
[Model 1]1: Effects of Monetary Policy on the monetary and financial market
and production
( i ) Monetary policy variables: BOJ Current Account Balance (BOJAC); Monetary Base (MB); Call Rate
( ii ) Market variables: money stocks (M2); average government bond yield (Yield); Bank lending (Lend); Industrial Production (Prod)
[Model 2] 1: Effects of Monetary Policy on the foreign exchange rate , price
and capital market, as well as industrial production
( i ) Monetary policy variables: BOJ Current Account Balance (BOJAC); Monetary Base (MB); Call Rate
( ii ) Foreign exchange market and other market variables: Real Effective Exchange Rate (REER); Consumer Price Index (CPI); Stock Prices(Nikkei); Industrial Production (Prod)
1Analysis presented in Section 4.
[Model 3]2:Effects of (i)capital flows (net) on (ii)monetary policy variables
( i ) Foreign Direct Investment (FDI); Portfolio Investment (Portfolio); Other Investment (Other), Derivatives (Derivative) ( ii ) Monetary policy variables: BOJ Current Account Balance
(BOJAC); Monetary Base (MB); Call Rate
2 Analysis presented in Section 5.
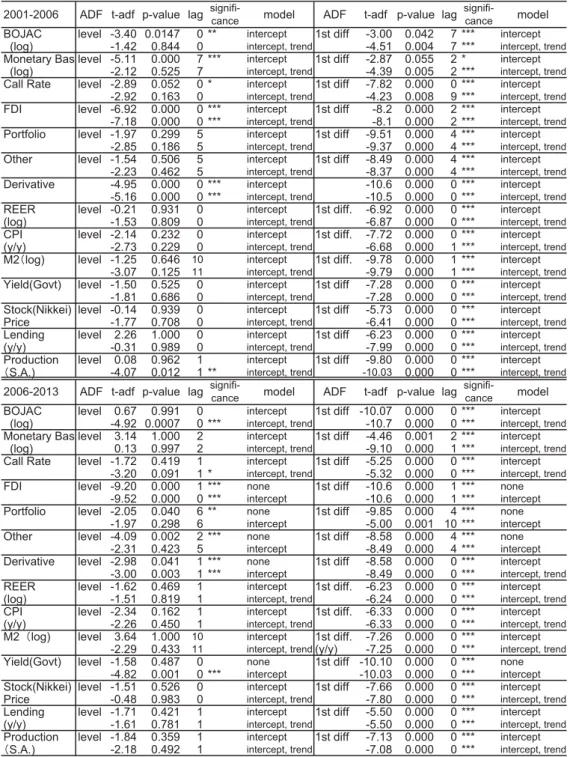
3.2 ADF Test and Stationarity of variables
Prior to the analysis based on VAR models, stationarity of the variables involved in the regression is tested by ADF (augmented Dickey-Fuller) method for the unit root tests (Table 1). FDI, derivatives, industrial production (y/y) has unit root without first lag. the ADF test results show that unit root is rejected for the first lag of other variables, which is expressed as I (1).
2001-2006 ADF t-adf p-value lag signifi-cance model ADF t-adf p-value lag signifi-cance model BOJAC level -3.40 0.0147 0 ** intercept 1st diff -3.00 0.042 7 *** intercept
(log) -1.42 0.844 0 intercept, trend -4.51 0.004 7 *** intercept, trend
Monetary Bas level -5.11 0.000 7 *** intercept 1st diff -2.87 0.055 2 * intercept
(log) -2.12 0.525 7 intercept, trend -4.39 0.005 2 *** intercept, trend
Call Rate level -2.89 0.052 0 * intercept 1st diff -7.82 0.000 0 *** intercept
-2.92 0.163 0 intercept, trend -4.23 0.008 9 *** intercept, trend
FDI level -6.92 0.000 0 *** intercept 1st diff -8.2 0.000 2 *** intercept
-7.18 0.000 0 *** intercept, trend -8.1 0.000 2 *** intercept, trend
Portfolio level -1.97 0.299 5 intercept 1st diff -9.51 0.000 4 *** intercept
-2.85 0.186 5 intercept, trend -9.37 0.000 4 *** intercept, trend
Other level -1.54 0.506 5 intercept 1st diff -8.49 0.000 4 *** intercept
-2.23 0.462 5 intercept, trend -8.37 0.000 4 *** intercept, trend
Derivative -4.95 0.000 0 *** intercept -10.6 0.000 0 *** intercept
-5.16 0.000 0 *** intercept, trend -10.5 0.000 0 *** intercept, trend
REER level -0.21 0.931 0 intercept 1st diff. -6.92 0.000 0 *** intercept
(log) -1.53 0.809 0 intercept, trend -6.87 0.000 0 *** intercept, trend
CPI level -2.14 0.232 0 intercept 1st diff. -7.72 0.000 0 *** intercept
(y/y) -2.73 0.229 0 intercept, trend -6.68 0.000 1 *** intercept, trend
M2䠄log) level -1.25 0.646 10 intercept 1st diff. -9.78 0.000 1 *** intercept
-3.07 0.125 11 intercept, trend -9.79 0.000 1 *** intercept, trend
Yield(Govt) level -1.50 0.525 0 intercept 1st diff -7.28 0.000 0 *** intercept
-1.81 0.686 0 intercept, trend -7.28 0.000 0 *** intercept, trend
Stock(Nikkei) level -0.14 0.939 0 intercept 1st diff -5.73 0.000 0 *** intercept
Price -1.77 0.708 0 intercept, trend -6.41 0.000 0 *** intercept, trend
Lending level 2.26 1.000 0 intercept 1st diff -6.23 0.000 0 *** intercept
(y/y) -0.31 0.989 0 intercept, trend -7.99 0.000 0 *** intercept, trend
Production level 0.08 0.962 1 intercept 1st diff -9.80 0.000 0 *** intercept
䠄S.A.) -4.07 0.012 1 ** intercept, trend -10.03 0.000 0 *** intercept, trend
2006-2013 ADF t-adf p-value lag signifi-cance model ADF t-adf p-value lag signifi-cance model BOJAC level 0.67 0.991 0 intercept 1st diff -10.07 0.000 0 *** intercept
(log) -4.92 0.0007 0 *** intercept, trend -10.7 0.000 0 *** intercept, trend
Monetary Bas level 3.14 1.000 2 intercept 1st diff -4.46 0.001 2 *** intercept
(log) 0.13 0.997 2 intercept, trend -9.10 0.000 1 *** intercept, trend
Call Rate level -1.72 0.419 1 intercept 1st diff -5.25 0.000 0 *** intercept
-3.20 0.091 1 * intercept, trend -5.32 0.000 0 *** intercept, trend
FDI level -9.20 0.000 1 *** none 1st diff -10.6 0.000 1 *** none
-9.52 0.000 0 *** intercept -10.6 0.000 1 *** intercept
Portfolio level -2.05 0.040 6 ** none 1st diff -9.85 0.000 4 *** none
-1.97 0.298 6 intercept -5.00 0.001 10 *** intercept
Other level -4.09 0.002 2 *** none 1st diff -8.58 0.000 4 *** none
-2.31 0.423 5 intercept -8.49 0.000 4 *** intercept
Derivative level -2.98 0.041 1 *** none 1st diff -8.58 0.000 0 *** intercept
-3.00 0.003 1 *** intercept -8.49 0.000 0 *** intercept, trend
REER level -1.62 0.469 1 intercept 1st diff. -6.23 0.000 0 *** intercept
(log) -1.51 0.819 1 intercept, trend -6.24 0.000 0 *** intercept, trend
CPI level -2.34 0.162 1 intercept 1st diff. -6.33 0.000 0 *** intercept
(y/y) -2.26 0.450 1 intercept, trend -6.33 0.000 0 *** intercept, trend
M2㸦log) level 3.64 1.000 10 intercept 1st diff. -7.26 0.000 0 *** intercept
-2.29 0.433 11 intercept, trend(y/y) -7.25 0.000 0 *** intercept, trend
Yield(Govt) level -1.58 0.487 0 none 1st diff -10.10 0.000 0 *** none
-4.82 0.001 0 *** intercept -10.03 0.000 0 *** intercept
Stock(Nikkei) level -1.51 0.526 0 intercept 1st diff -7.66 0.000 0 *** intercept
Price -0.48 0.983 0 intercept, trend -7.80 0.000 0 *** intercept, trend
Lending level -1.71 0.421 1 intercept 1st diff -5.50 0.000 0 *** intercept
(y/y) -1.61 0.781 1 intercept, trend -5.50 0.000 0 *** intercept, trend
Production level -1.84 0.359 1 intercept 1st diff -7.13 0.000 0 *** intercept
䠄S.A.) -2.18 0.492 1 intercept, trend -7.08 0.000 0 *** intercept, trend Note: The period is from April 2006 to August 2013 (to July 2013 for Capital flows [FDI, Portfolio, Other, Derivative])
Source: Author's calculation based on Bank of Japan and IFS database (IMF)
The variables which are confirmed stationarity with the first lag are as follows:
Portfolio; Other Investment; BOJ Current Account; Monetary Base; Real effective exchange rate (REER); Money Stock (M2); Nikkei Average (Nikkei); CPI (y/y); Average Government Bond yield (Yield); Bank Lending (Lend). It should be noted that some of the variables including Portfolio and Other investment show stationarity without first lag, depending on the period. The analyses based on the VAR models used the variables with first order difference, depending on the ADF test results.
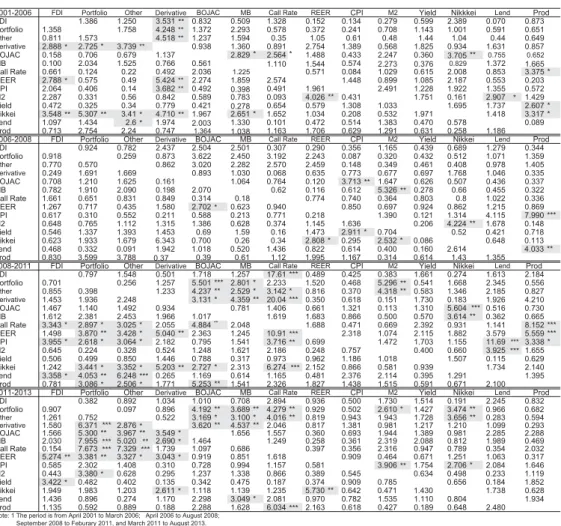
3.3 Granger Causality Test
This section focuses on the causality between the variables of monetary policy and foreign exchange rates, monetary and financial markets, as well as the real economy (industrial production). Granger causality tests are essentially those measures to improve in forecasting association and correlation between the variables. By using an F-test to jointly test for the significance of the lags on the explanatory variables, this in effect tests for Granger causality between these variables.
The analysis is based on the monthly data of each variable during the period April 2001 to August 2013, dividing 2001-2006 (Quantitative Easing), 2006-2008 (Post QE), 2008-2011 (Post Global Financial Crisis), and 2011-2013 (Comprehensive Monetary Easing and New Quantitative & Qualitative Easing Phase). The results of Granger Causality test of each variable, with the average of the first, 2nd, 3rd and 4th (quarter) lags are summarized in Table2.
Among the monetary policy variables, BOJ Current Account (BOJAC) Granger causes Nikkei stock prices, and Nikkei has Granger Causes industrial production (Prod) during the period 2001-2006, which indicates that there was causality route from BOJAC to Industrial production through the stock market. However, causality from BOJAC to industrial production and Nikkei to industrial production became insignificant after 2006, during the whole periods from 2006 to 2013.
Thus, the causality between the domestic monetary policy and the capital and financial market has become insignificant recently. In this regard, the period 2008-2011 was some special period when the Global Financial Crisis hit the global market, so that the significant causality from BOJAC and monetary base (MB) to Nikkei was not positive but negative one, as it is shown in the next section of impulse response functions.
BOJ Current Account and bank lending have no direct causal relationship with industrial production during the whole period of 2001-2013. This result suggests that industrial production by Japanese firms, especially large firms, have
not been dependent on monetary base and bank loans 4. In this regard, it could be
related to the significant monetary easing that was introduced in global scale.
4. The corporate profit of Japanese firms increased by more than 60 % (y/y) and reached to US$62.9 billion in November 2011. This would account for the decrease in the Japanese firms dependence on the bank loans significantly (Reuters 2012).
Table 2: Japan : Granger Causality (2001-2013)
2001-2006 FDI Portfolio Other Derivative BOJAC MB Call Rate REER CPI M2 Yield Nikkkei Lend Prod FDI 1.386 1.250 3.531 ** 0.832 0.509 1.328 0.152 0.134 0.279 0.599 2.389 0.070 0.873 Portfolio 1.358 1.758 4.248 ** 1.372 2.293 0.578 0.372 0.241 0.708 1.143 1.001 0.591 0.651 Other 0.811 1.573 4.518 ** 1.237 1.594 0.35 1.05 0.61 0.48 1.44 1.04 0.44 0.649 Derivative 2.888 * 2.725 * 3.739 ** 0.938 1.360 0.891 2.754 1.389 0.568 1.825 0.934 1.631 0.857 BOJAC 0.158 0.706 0.679 1.137 2.829 * 2.564 * 1.488 0.433 2.247 0.360 3.705 ** 0.755 0.652 MB 0.100 2.034 1.525 0.766 0.561 1.110 1.544 0.574 2.273 0.376 0.829 1.372 1.665 Call Rate 0.661 0.124 0.22 0.492 2.036 1.225 0.571 0.084 1.029 0.615 2.008 0.853 3.375 * REER 2.788 * 0.575 0.49 5.424 ** 2.274 1.859 2.574 1.448 0.899 1.085 2.187 0.553 0.203 CPI 2.064 0.406 0.14 3.682 ** 0.492 0.398 0.491 1.961 2.491 1.228 1.922 1.355 0.572 M2 2.287 0.331 0.56 0.842 0.589 0.783 0.093 4.026 ** 0.431 1.751 0.161 2.907 * 1.429 Yield 0.472 0.325 0.34 0.779 0.421 0.278 0.654 0.579 1.308 1.033 1.695 1.737 2.607 * Nikkei 3.548 ** 5.307 ** 3.41 * 4.710 ** 1.967 2.651 * 1.652 1.034 0.208 0.532 1.971 1.418 3.317 * Lend 1.097 1.434 2.6 * 1.974 2.003 1.330 0.101 0.472 0.514 1.383 0.470 0.578 0.089 Prod 0.713 2.754 2.24 0.747 1.364 1.038 1.163 1.706 0.629 1.291 0.631 0.258 1.186 2006-2008 FDI Portfolio Other Derivative BOJAC MB Call Rate REER CPI M2 Yield Nikkei Lend Prod FDI 0.924 0.782 2.437 2.504 2.501 0.307 0.290 0.356 1.165 0.439 0.689 1.279 0.344 Portfolio 0.918 0.259 0.873 3.622 2.450 3.192 2.243 0.087 0.320 0.432 0.512 1.071 1.359 Other 0.770 0.570 0.862 3.020 2.282 2.570 2.459 0.148 0.349 0.461 0.408 0.978 1.405 Derivative 0.249 1.691 1.669 0.893 1.030 0.068 0.635 0.773 0.677 0.697 1.768 1.046 0.335 BOJAC 0.708 1.210 1.625 0.161 1.064 0.764 0.120 3.713 ** 1.647 0.626 0.507 0.436 0.337 MB 0.782 1.910 2.090 0.198 2.070 0.62 0.116 0.612 5.326 ** 0.278 0.66 0.455 0.322 Call Rate 1.661 0.651 0.831 0.849 0.314 0.18 0.774 0.740 0.364 0.803 0.8 1.022 0.336 REER 1.267 0.717 0.435 1.580 2.702 * 0.623 0.940 0.850 0.697 0.924 0.862 1.215 0.869 CPI 0.617 0.310 0.552 0.211 0.588 0.213 0.771 0.218 1.390 0.121 1.314 4.115 7.990 *** M2 0.648 0.765 1.112 1.315 1.386 0.628 0.374 1.145 1.636 0.206 4.224 ** 1.678 0.148 Yield 0.546 1.337 1.393 1.453 0.69 1.59 0.16 1.473 2.911 * 0.704 0.52 0.421 0.718 Nikkei 0.623 1.933 1.679 6.343 0.700 0.26 0.34 2.808 * 0.295 2.532 * 0.086 0.648 0.113 Lend 0.468 0.332 0.091 1.942 1.018 0.520 1.436 0.822 0.614 0.400 0.160 2.614 4.033 ** Prod 0.830 3.599 3.788 0.37 0.39 0.61 1.12 1.995 1.167 0.314 0.614 1.43 1.355 2008-2011 FDI Portfolio Other Derivative BOJAC MB Call Rate REER CPI M2 Yield Nikkei Lend Prod FDI 0.797 1.548 0.501 1.718 1.257 17.61 *** 0.489 0.425 0.383 1.661 0.274 1.613 2.184 Portfolio 0.701 0.256 1.257 5.501 *** 2.801 * 2.233 1.520 0.468 5.296 ** 0.541 1.668 2.345 0.556 Other 0.855 0.398 1.233 4.237 ** 2.529 * 3.142 * 0.816 0.370 4.318 ** 0.583 1.346 2.185 0.827 Derivative 1.453 1.936 2.248 3.131 * 4.359 ** 20.04 *** 0.350 0.618 0.151 1.730 0.183 1.926 4.210 BOJAC 1.467 1.140 1.492 0.934 0.781 1.406 0.661 1.321 0.113 1.310 5.604 *** 0.516 0.730 MB 1.612 2.381 2.453 1.966 1.017 1.619 1.683 0.866 0.500 0.570 3.614 ** 0.362 0.665 Call Rate 3.343 * 2.897 * 3.025 * 2.055 4.884** 2.048 1.688 0.471 0.669 2.392 0.931 1.141 8.152 *** REER 1.498 3.870 ** 3.428 * 5.040 ** 2.363 1.245 10.91 *** 2.318 1.074 2.115 1.882 3.579 5.559 *** CPI 3.955 * 2.618 * 3.064 * 2.182 0.795 1.541 3.716 ** 0.699 1.472 1.703 1.155 11.69 *** 3.338 * M2 0.645 0.224 0.328 0.524 1.248 1.621 2.186 0.248 0.757 0.400 0.660 3.925 *** 1.655 Yield 0.506 0.499 0.850 1.446 0.788 0.317 0.973 0.962 1.186 1.018 1.507 0.115 0.629 Nikkei 1.242 3.441 * 3.352 * 5.203 ** 2.727 * 2.313 6.274 *** 2.152 0.866 0.581 0.939 1.734 2.140 Lend 3.358 * 4.053 ** 6.248 *** 0.265 1.169 0.614 1.165 0.481 2.376 2.114 0.395 1.291 1.395 Prod 0.781 3.086 * 2.506 * 1.771 5.253 ** 1.541 2.326 1.827 1.438 1.515 0.591 0.671 2.100 2011-2013 FDI Portfolio Other Derivative BOJAC MB Call Rate REER CPI M2 Yield Nikkei Lend Prod FDI 0.382 0.892 1.034 1.010 0.708 2.894 0.936 0.500 1.730 1.514 0.191 2.245 0.832 Portfolio 0.907 0.097 0.896 4.192 ** 3.689 ** 4.279 ** 0.929 0.502 2.610 * 1.427 3.474 ** 0.966 0.682 Other 1.261 0.752 0.522 3.169 * 3.100 * 4.016 ** 0.819 0.943 1.943 1.728 3.656 ** 0.283 0.594 Derivative 1.580 6.371 *** 2.876 * 3.620 ** 4.537 ** 2.046 0.817 1.381 0.981 1.217 1.210 1.099 0.293 BOJAC 1.566 5.300 ** 3.967 ** 3.549 * 1.656 1.557 0.360 0.693 1.944 1.389 0.981 2.285 2.288 MB 2.030 7.955 *** 5.020 ** 2.690 * 1.464 1.249 0.258 0.361 2.319 2.088 0.812 1.989 0.469 Call Rate 0.154 7.673 *** 7.329 *** 1.739 1.097 0.686 0.397 0.356 2.316 0.947 0.789 0.354 2.032 REER 5.274 ** 3.381 ** 3.327 * 3.043 * 0.919 0.851 1.618 0.909 0.464 0.671 1.251 1.063 0.317 CPI 0.585 2.302 1.408 0.310 0.728 0.994 1.157 0.581 3.906 ** 1.754 2.706 * 2.084 1.646 M2 0.443 3.380 * 0.628 0.295 1.237 1.338 0.866 0.389 0.545 0.634 0.498 0.233 1.119 Yield 3.422 * 0.482 0.402 0.135 0.342 0.475 0.187 0.374 0.909 0.785 0.656 0.184 1.852 Nikkei 1.949 1.983 1.203 2.611 * 1.118 1.139 1.235 5.730 ** 0.642 0.471 1.430 1.738 0.628 Lend 1.436 0.896 0.274 1.170 2.298 3.049 * 2.081 0.970 0.782 1.535 1.110 0.804 1.934 Prod 1.135 0.592 0.889 0.188 2.288 1.628 6.034 *** 2.163 0.618 0.427 0.189 0.648 2.480 Note: 1 The period is from April 2001 to March 2006; April 2006 to August 2008;
September 2008 to Feburary 2011, and March 2011 to August 2013. 2 Calculation based on the average of 1st to 4th lags of the variables 䚷䚷䚷䚷3 Figures are F-value. ***, **, * denote significance at 1%, 5%, and 10%. Source: Author's calculation based on IFS database (IMF), Bank of Japan
Call Rate, on the other hand, Granger Causes industrial production during the periods 2001-2006 and 2008-2011. The real effective exchange rate (REER) Granger Causes Call Rate and industrial production, while the direction of Granger causality from Call Rate to REER is not significant during the same period. These results sugget that the depreciation of yen during the period 2008-2011 is related to the interest rates, including Call Rate.
Bank lending Granger causes industrial production in a limited scale during 2006-2008 ; however, it is negatively correlated during the period. This indicates that the money has not been fully utilized for the domestic real economy.
Real effective exchange rate (REER) has granger causality with industrial production during 2008-2011. On the other hand, REER has no causality with BOJ Current Account (BOJAC) during the same period, and this could be caused by global monetary flows after the Lehman shock. It could be also accounted for by the fact that BOJAC and Monetary Base have no significant causality with domestic monetary market variables.
3.4 Variance Decomposition: The Influence of Monetary Policy Variables on the Domestic Real Economy
The analysis on variance decomposition shows that from which variables share variance is formed. The impact of the monetary policy on the real economy is analysed by variance decomposition of each monetary policy variables (BOJ Current Account, Monetary Base, Call Rate), as shown in Table 3. The variance decomposition indicates the share percentage of variables of real effective exchange rate(REER), and Nikkei average stock price (Nikkei), bank lending (Lend), industrial production (Prod), and monetary policy variables are included in the decomposition in the analysis. Thus, this analysis will identify the effects of monetary policy on exchange rate, stock prices, lending , as well as production through the degrees of variance decomposition.
The shares of BOJ Current Account in variance decomposition of industrial
production were 16.1%(10th lag period, heareafter) and 17.0% during 2006-2008
and 2008-2011, respectively, but it declined to 3.6% during 2011-2013. The share of monetary base in industrial production also declined from 10.4% during 2008-2011 to 2.2 % during 2008-2011-2013.
On the other hand, the shares of BOJ Current Account and Monetary Base in variance decompositions of lending remained relatively low over the whole period 2001-2013.
in variance decomposition in all the variables of bank lending and stock prices (Nikkei). Particularly, the share of REER for Nikkei among the decomposition including BOJAC was only 4.8% during 2001-2006, but it increased to 40.1% during 2011-2013. Similarly, the share of REER for Monetary Base and Call Rate increased from 4.97% to 45.3% , and from 8.1% to 41.0%, respectively, in the same period.
The results indicate that monetary policy variables have become increasingly innefective in industrial production, bank lending and stock prices. Also note that REER has increasingly influenced on the stock prices and bank lending. This could be due to the fact that the domestic real economy and financial markets have become increasingly influenced by capital flows and foreign exchange transactions after the Lehman Shock until recently. Thus, the impact of capital flows on the domestic markets and economy will be analysed in the next section.
Table3: Variance Decomposition of BOJ Account, Monetary Base and Call Rate 3 1 0 2 -1 1 0 2 1 1 0 2 -8 0 0 2 8 0 0 2 -6 0 0 2 6 0 0 2 -1 0 0 2 BOJ Account䚷䋻 Production
PeriodBOJACREER Nikkei Lend Prod BOJACREER Nikkei Lend Prod BOJACREER Nikkei Lend Prod BOJACREER Nikkei Lend Prod 1 12.78 3.248 0.292 1.368 82.31 27.31 16.72 1.812 1.369 52.78 14.66 22.60 0.677 0.008 62.06 3.613 0.002 0.906 1.180 94.30 10 11.87 3.279 5.845 1.445 77.56 16.11 27.99 10.73 15.17 29.99 16.95 45.53 0.674 11.78 25.07 3.592 3.054 3.450 12.09 77.81 BOJ Account䚷䋻 Lend
PeriodBOJACREER Nikkei Lend Prod BOJACREER Nikkei Lend Prod BOJACREER Nikkei Lend Prod BOJACREER Nikkei Lend Prod 1 0.50 0.237 1.181 98.08 0.000 0.44 1.259 1.132 97.17 0.000 0.04 0.03 5.820 94.11 0.000 7.478 14.30 5.256 72.97 0.000 10 4.19 0.344 4.294 89.31 1.870 8.755 4.954 11.11 70.21 4.972 8.85 17.47 3.395 67.15 3.129 7.071 18.10 8.570 57.57 8.693 BOJ Account䚷䋻 Nikkei
PeriodBOJACREER Nikkei Lend Prod BOJACREER Nikkei Lend Prod BOJACREER Nikkei Lend Prod BOJACREER Nikkei Lend Prod 1 7.29 1.587 91.13 0.00 0.000 37.24 0.59 62.17 0.00 0.000 3.736 39.16 57.10 0.000 0.000 1.200 43.98 54.82 0.000 0.000 10 11.89 4.770 81.78 0.29 1.272 25.65 7.32 39.35 9.81 17.87 26.26 29.51 33.73 5.557 4.937 9.987 40.10 47.57 0.150 2.190 Monetary Base䚷䋻 Production
PeriodBOJACREER Nikkei Lend Prod BOJACREER Nikkei Lend Prod BOJACREER Nikkei Lend Prod BOJACREER Nikkei Lend Prod 1 7.94 3.327 1.183 1.753 85.79 3.57 0.571 6.885 8.073 80.90 0.87 24.81 0.897 0.005 73.42 2.068 0.046 0.878 1.449 95.56 10 7.86 3.423 6.824 1.734 80.16 2.727 1.540 9.399 24.71 61.63 10.42 48.01 2.441 11.66 27.48 2.243 3.399 3.301 12.42 78.64 Monetary Base䚷䋻 Lend
PeriodBOJACREER Nikkei Lend Prod BOJACREER Nikkei Lend Prod BOJACREER Nikkei Lend Prod BOJACREER Nikkei Lend Prod 1 0.61 0.528 1.042 97.82 0.000 1.45 0.489 0.164 97.89 0.000 0.02 0.22 2.906 96.85 0.000 5.620 15.62 5.429 73.34 0.000 10 7.09 0.804 4.067 86.05 1.993 1.752 2.901 2.178 91.37 1.796 8.37 19.26 3.239 66.55 2.589 5.019 19.96 8.719 57.86 8.439 Monetary Base䚷䋻 Nikkei
PeriodBOJACREER Nikkei Lend Prod BOJACREER Nikkei Lend Prod BOJACREER Nikkei Lend Prod BOJACREER Nikkei Lend Prod 1 2.65 0.585 96.77 0.00 0.000 1.42 29.55 69.03 0.00 0.000 1.335 47.36 51.31 0.000 0.000 0.039 48.06 51.90 0.000 0.000 10 3.72 4.971 90.83 0.19 0.289 1.875 27.58 52.55 3.89 14.12 19.20 38.64 38.32 2.140 1.701 6.275 45.27 47.08 0.064 1.306 Call Rate䚷䋻 Production
Period CR REER Nikkei Lend Prod CR REER Nikkei Lend Prod CR REER Nikkei Lend Prod CR REER Nikkei Lend Prod 1 0.238 8.350 0.246 0.366 90.80 2.666 0.367 4.806 6.925 85.23 0.313 22.02 2.943 0.038 74.69 0.067 2.391 0.21 1.13 96.20 10 0.617 8.424 9.047 0.445 81.47 3.050 0.846 8.540 21.53 66.03 13.50 23.55 2.389 10.41 50.14 4.39 4.820 3.72 9.93 77.14 Call Rate䚷䋻 Lend
Period CR REER Nikkei Lend Prod CR REER Nikkei Lend Prod CR REER Nikkei Lend Prod CR REER Nikkei Lend Prod 1 1.651 0.011 0.092 98.25 0.000 0.849 0.021 0.026 99.10 0.000 0.173 0.523 0.320 98.98 0.00 0.723 23.08 4.736 71.47 0.000 10 2.098 0.786 5.054 90.04 2.026 8.848 2.543 0.896 86.49 1.225 6.665 2.348 0.724 89.73 0.54 1.395 25.85 8.467 56.85 7.439 Call Rate䚷䋻 Nikkei
Period CR REER Nikkei Lend Prod CR REER Nikkei Lend Prod CR REER Nikkei Lend Prod CR REER Nikkei Lend Prod 1 0.043 1.792 98.17 0.000 0.000 2.101 30.03 67.87 0.000 0.000 19.57 25.28 55.15 0.000 0.000 3.823 41.04 55.14 0.000 0.000 10 0.265 8.128 91.26 0.125 0.224 3.837 25.82 50.16 4.411 15.77 20.48 26.20 52.43 0.758 0.129 5.198 41.01 52.48 0.545 0.767
Notes䠖Standard errors are not shown in the table. Periods from 2nd to 9th in the variances are not shown in the table. Source: Author's calculation based on the data of Bank of Japan
4. Effects of Monetary Policy on the Domestic Market and Economy 4.1 Impulse Response Functions: Monetary Policy Shocks on the Financial
Markets and the Real Economy
In order to verify the effects of monetary policy (BOJ Current Account, Monetary Base, Call Rate) on the domestic economy, impulse response functions of the two VAR models are examined. The first model includes variables of bank lending, money stocks (M2), as well as government bond yield, to identify the effects of monetary policy instruments via financial markets and bank lending on industrial production. The second model includes variables of CPI, real effective eexchange rate (REER) and stock prices to test some effects on the production via exchange rate and stock markets. The two models are the same as the previous section (3.1).
[Model 1]: Effects of Monetary Policy on the monetary and financial market, aswell as the industrial production [Fig7-1, 2, 3*]
Y = (BOJAC [or MB or Call Rate], M2, Yield, Lend, Prod), c
[Model 2]: Effects of Monetary Policy on the foreign exchange rate , price and capital market, as well as the industrial production [Fig8-1, 2,3*] Y= (BOJAC [or MB or Call Rate]), REER, CPI, Nikkei, Production (Prod), c
*Appendix
In the above VAR models, the first variable is one of the variables related to monetary policy; Bank of Japan Current Account (BOJAC), Monetary Base, and Call Rate (overnight), followed by variables of monetary and financial markets as well as real economy. The results of impulse response functions are summarized as follows:
(i) Effects on the Real Economy
Over the period 2006-2013, the response functions of Bank of Japan Current Account (hereafter BOJAC) and Monetary Base (MB) show no significant impact
on the industrial production (Fig.7-1, 7-2) 5. Although the shocks of the BOJAC
and MB might have given some positive impact upon stock prices (Nikkei) during 2001-2006, which could pushed up the production, there is no evidence of such a route of positive response from the monetary policy variables since 2006 (Fig.8-1,
5. Iwata (2011) insists that BOJ s monetary easing policy may not directly increase in bank lending, but the policy may change the expection of inlation among the public, which may activate stock tradings and increase monetary velocity, and that would result in increase in bank lending for investment. The impulse response functions based on the VAR model in this paper, however, show no such a significant response.
8-2). The results of impulse response functions are in line with the results of Granger Causality test (Table 2).
The impulse response functions of Bank lending (Lend) to BOJAC and MB are not statistically significant, and even negative over the period 2001-2013, especially in recent period of 2011-2013, when MB increased significantly (Fig.7-1, 7-2). This indicates that the original objective of expanding production through bank lending by means of increasing monetary base has not been realized. Monetary base may be used for some other purposes such as financial investment in global markets recently.
The response of bank lending to call rate is insignificant during the whole period, while it shows negative response of industrial production during
2008-2011 (Fig.7-3) . The result is conformed to that of Granger causality test (Table 2) 6.
It may explain the fact that the interest rate could influence on the real economy during the period of Global Financial Crisis (2008-2011), however, the response function has become insignificant during 2011-2013. It should be noted that call rate has been set in principle in the narrow range of zero to 1 percent, and it
might have nullified the interest rate policy in the past decade 7.
(ii) Effects on Monetary / Financial Market
Monetary Base (incl. BOJAC) has neither significant effect on the money stock (M2) nor the government bond yield (Fig.7-1, 7-2). This indicates that quantitative monetary easing policy has very limited effect on the bond market (Fig.7-1, 7-2). However, the impulse response functions during 2011-2013 indicate significant shock to the M2 and bond yield, which shows positive response, rather than negative one. This indicates that money stock in the domestic market has not been influenced by monetary base, and it implies that monetary market has become influenced by capital flows, which are significantly correlated with the US monetary policy, especially after the QE 2 period. The response of yield to Call Rate has no significance (Fig.7-3).
The response of yield to BOJAC and Moteary Base had not been significant until 2011, while the response became significantly positive during 2011-2013, which is not in line with the orthodox monetary theory (Fig.7-1,7-2) .
6. Miyao (2006) demonsted that increase in monetary base would raise the interest rate, which may have negative impact on industrial production. The study, however, the covered period was from 1975 to 1998, so that the result may not be hold in the current market in Japan.
7. Harada and Masujima (2008) indicate that Fisher effect which accounts for increase in the long-term interest caused by the increase in monetary base. However, their argument is not focused on the BOJ call rate involved.
The impulse response of stock prices (Nikkei) to Monetary Base (incl.BOJAC) shows negative response, rather than positive one during 2008-2011 and 2011-2013. This shows that monetary easing has not been effective for stock prices since the Global Financial Crisis, which is different from the period 2001-2006, when some positive response of Nikkei price was seen (Fig.8-1, 8-2) .
The above results show that BOJ s monetary policy has very limited impact upon the domestic market. It should be also noted that the stock prices have no significant effect on the industrial production recently.
(iii)Effects on the Foreign Exchange Rate
Monetary base (incl. BOJAC) has not influenced on the real effective exchange rate (REER) over the whole period (2001-2011), while it has slight positive impact on the REER during the period 2011-2013(Fig.8-1, 8-2). However, the result of the Granger Causality test on BOJAC ( and Monetary Base) and REER shows no significant causality from BOJAC ( and Monetary Base) to REER during 2011-2013.
(iv)Effects on the Price Level (CPI)
The impulse functions of CPI to the shock of BOJ Current Account and Monetary Base shows no significant response of CPI (Fig.8-1) .While the response function of CPI to Monetary Base shows positive response only during the period
2011-2013, it is not statistically significant (Fig.8-2) 8. Call rate also has no siginificant
effect on CPI.
8. Miyao(2009) indicates that the money stock has put no significant influence on the price lvels since 2000.
-.02 .00 .02 .04 .06 2 4 6 8 10 (2001-2006) (2006-2008) (2008-2011) (2011-2013) -.0010 -.0005 .0000 .0005 .0010 .0015 2 4 6 8 10 M2 BO JA C -.05 .00 .05 .10 .15 .20 2 4 6 8 10 YIEL D -.2 -.1 .0 .1 .2 .3 2 4 6 8 10 LEN D -0.8 -0.4 0.0 0.4 0.8 1.2 2 4 6 8 10 PR O D
Japan : Impulse Response to BOJ Account [1]
-.08 -.04 .00 .04 .08 2 4 6 8 10 -.0010 -.0005 .0000 .0005 .0010 .0015 2 4 6 8 10 -.1 .0 .1 .2 2 4 6 8 10 -.4 -.2 .0 .2 .4 .6 2 4 6 8 10 -1 0 1 2 4 6 8 10 -.04 -.02 .00 .02 .04 2 4 6 8 10 -.0005 .0000 .0005 .0010 .0015 2 4 6 8 10 -.10 -.05 .00 .05 .10 .15 2 4 6 8 10 -.4 -.2 .0 .2 .4 .6 2 4 6 8 10 -2 -1 0 1 2 3 2 4 6 8 10 -.04 .00 .04 .08 2 4 6 8 10 -.0005 .0000 .0005 .0010 .0015 2 4 6 8 10 -.04 .00 .04 .08 2 4 6 8 10 -.2 -.1 .0 .1 .2 2 4 6 8 10 -2 -1 0 1 2 2 4 6 8 10 Fig.7-1: BOJ Account, M2, Yield, Lend, Production
-.004 .000 .004 .008 .012 2 4 6 8 10 -.0010 -.0005 .0000 .0005 .0010 .0015 2 4 6 8 10 M2 MB -.08 -.04 .00 .04 .08 .12 .16 2 4 6 8 10 YI EL D -.2 -.1 .0 .1 .2 .3 2 4 6 8 10 LE N D -0.5 0.0 0.5 1.0 1.5 2 4 6 8 10 PR O D
Japan: Impulse Response to Monetary Base [1]
-.010 -.005 .000 .005 .010 .015 2 4 6 8 10 -.0010 -.0005 .0000 .0005 .0010 .0015 2 4 6 8 10 -.1 .0 .1 .2 2 4 6 8 10 -.4 -.2 .0 .2 .4 .6 2 4 6 8 10 -1 0 1 2 4 6 8 10 -.008 -.004 .000 .004 .008 .012 2 4 6 8 10 -.0005 .0000 .0005 .0010 .0015 2 4 6 8 10 -.10 -.05 .00 .05 .10 .15 2 4 6 8 10 -.4 -.2 .0 .2 .4 .6 2 4 6 8 10 -2 -1 0 1 2 3 2 4 6 8 10 -.01 .00 .01 .02 .03 2 4 6 8 10 -.0005 .0000 .0005 .0010 2 4 6 8 10 -.04 .00 .04 .08 2 4 6 8 10 -.2 -.1 .0 .1 .2 2 4 6 8 10 -2 -1 0 1 2 2 4 6 8 10 (2001-2006) (2006-2008) (2008-2011) (2011-2013) Fig.7-2: Monetary Base , M2, Yield, Lend, Production
-.001 .000 .001 .002 .003 .004 2 4 6 8 10 -.0005 .0000 .0005 .0010 .0015 2 4 6 8 10 M2 C al l R ate -.05 .00 .05 .10 .15 .20 2 4 6 8 10 YI EL D -.2 -.1 .0 .1 .2 .3 2 4 6 8 10 LE N D -1.0 -0.5 0.0 0.5 1.0 1.5 2 4 6 8 10 PR O D
Japan: Impulse Response to Call Rate [1]
-.04 -.02 .00 .02 .04 .06 2 4 6 8 10 -.0010 -.0005 .0000 .0005 .0010 .0015 2 4 6 8 10 -.1 .0 .1 .2 2 4 6 8 10 -.4 -.2 .0 .2 .4 2 4 6 8 10 -1.0 -0.5 0.0 0.5 1.0 1.5 2 4 6 8 10 -.02 -.01 .00 .01 .02 .03 .04 2 4 6 8 10 -.0005 .0000 .0005 .0010 .0015 2 4 6 8 10 -.10 -.05 .00 .05 .10 .15 2 4 6 8 10 -.4 -.2 .0 .2 .4 .6 2 4 6 8 10 -2 -1 0 1 2 2 4 6 8 10 -.004 .000 .004 .008 2 4 6 8 10 -.0005 .0000 .0005 .0010 2 4 6 8 10 -.04 .00 .04 .08 .12 2 4 6 8 10 -.2 -.1 .0 .1 .2 2 4 6 8 10 -2 -1 0 1 2 2 4 6 8 10 (2001-2006) (2006-2008) (2008-2011) (2011-2013) Fig.7-3: Call Rate, M2, Yield, Lend, Production
-.02 .00 .02 .04 .06 2 4 6 8 10 -.004 .000 .004 .008 2 4 6 8 10 RE E R BOJ A C -.2 -.1 .0 .1 .2 .3 2 4 6 8 10 CP I -.02 -.01 .00 .01 .02 .03 2 4 6 8 10 N IKKEI -0.8 -0.4 0.0 0.4 0.8 1.2 2 4 6 8 10 PR OD -.04 .00 .04 .08 2 4 6 8 10 -.008 -.004 .000 .004 .008 .012 2 4 6 8 10 -.2 .0 .2 .4 .6 2 4 6 8 10 -.02 -.01 .00 .01 .02 2 4 6 8 10 -2 -1 0 1 2 2 4 6 8 10 -.02 -.01 .00 .01 .02 .03 .04 2 4 6 8 10 -.010 -.005 .000 .005 .010 .015 2 4 6 8 10 -.2 .0 .2 .4 .6 2 4 6 8 10 -.04 -.02 .00 .02 .04 2 4 6 8 10 -3 -2 -1 0 1 2 2 4 6 8 10 -.04 .00 .04 .08 2 4 6 8 10 -.010 -.005 .000 .005 .010 2 4 6 8 10 -.2 -.1 .0 .1 .2 .3 .4 2 4 6 8 10 -.03 -.02 -.01 .00 .01 .02 2 4 6 8 10 -2 -1 0 1 2 3 2 4 6 8 10
Japan: Impulse Response to BOJ Account [2]
(2001-2006) (2006-2008) (2008-2011) (2011-2013)
Japan: Impulse Response to Monetary Base [2] -.005 .000 .005 .010 .015 2 4 6 8 10 -.004 .000 .004 .008 2 4 6 8 10 RE E R -.2 -.1 .0 .1 .2 .3 2 4 6 8 10 CP I -.02 -.01 .00 .01 .02 .03 2 4 6 8 10 NI K K E I -0.8 -0.4 0.0 0.4 0.8 1.2 2 4 6 8 10 PR OD MB -.005 .000 .005 .010 .015 2 4 6 8 10 -.008 -.004 .000 .004 .008 .012 2 4 6 8 10 -.2 .0 .2 .4 .6 2 4 6 8 10 -.02 -.01 .00 .01 .02 2 4 6 8 10 -2 -1 0 1 2 2 4 6 8 10 -.005 .000 .005 .010 2 4 6 8 10 -.010 -.005 .000 .005 .010 .015 2 4 6 8 10 -.2 .0 .2 .4 .6 2 4 6 8 10 -.04 -.02 .00 .02 .04 2 4 6 8 10 -2 -1 0 1 2 2 4 6 8 10 -.01 .00 .01 .02 .03 2 4 6 8 10 -.010 -.005 .000 .005 .010 .015 2 4 6 8 10 -.2 -.1 .0 .1 .2 .3 .4 2 4 6 8 10 -.04 -.02 .00 .02 .04 2 4 6 8 10 -2 -1 0 1 2 3 2 4 6 8 10 (2001-2006) (2006-2008) (2008-2011) (2011-2013)
Fig.8-2: Monetary Base, REER, CPI, Nikkei, Production
-.002 -.001 .000 .001 .002 .003 .004 2 4 6 8 10 -.004 .000 .004 .008 .012 2 4 6 8 10 R EER C al l R ate -.2 -.1 .0 .1 .2 .3 2 4 6 8 10 CP I -.02 -.01 .00 .01 .02 .03 2 4 6 8 10 NI K K E I -0.8 -0.4 0.0 0.4 0.8 1.2 2 4 6 8 10 PR OD
Japan: Impulse Response to Call Rate [2]
-.04 -.02 .00 .02 .04 .06 2 4 6 8 10 -.008 -.004 .000 .004 .008 .012 2 4 6 8 10 -.2 .0 .2 .4 .6 2 4 6 8 10 -.02 -.01 .00 .01 .02 2 4 6 8 10 -2 -1 0 1 2 2 4 6 8 10 -.04 -.02 .00 .02 .04 2 4 6 8 10 -.010 -.005 .000 .005 .010 .015 2 4 6 8 10 -.2 .0 .2 .4 .6 2 4 6 8 10 -.04 -.02 .00 .02 .04 2 4 6 8 10 -2 -1 0 1 2 2 4 6 8 10 -.008 -.004 .000 .004 .008 2 4 6 8 10 -.010 -.005 .000 .005 .010 .015 2 4 6 8 10 -.2 -.1 .0 .1 .2 .3 .4 2 4 6 8 10 -.04 -.02 .00 .02 .04 2 4 6 8 10 -2 -1 0 1 2 3 2 4 6 8 10 (2001-2006) (2006-2008) (2008-2011) (2011-2013)
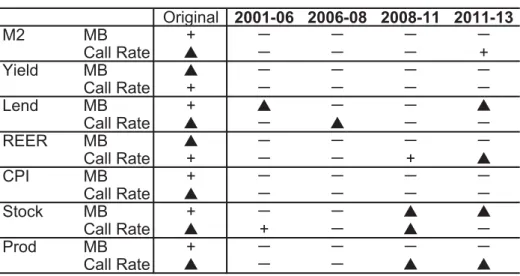
The above results of the impulse response functions on monetary policy variables (BOJAC, Base Money, and Call Rate) are summarized as follows:
First, the response of stock prices to BOJAC and Monetary Base (MB) shows no significant influence on the market and economy after the period of Monetary Easing (2001-2006), and there is even some negative response of the Nikkei stock prices to BOJAC and MB since 2008 until today. Monetary Base (and BOJAC) has not influenced on the money stock (M2) since 2006.
Second, Monetary Base and BOJAC have not put significant impact upon bank lending activities. This trend has become significant since 2006, when cross-border capital flows increased significantly. In fact, the response functions show that bank lending to the BOJAC and Monetary Base has put negative impact on bank lending since 2011.
Third, Monetary Base and BOJAC have no significant impact upon the real effective exchange rate (REER) over the period from 2001-2011. It should be noted that BOJAC and Monetary Base put pressure on appreciation of the real effective exchange rate (REER) since 2011, rather than depreciation, which is contrary to the orthodox theory, where monetary expansion has put the exchange rate to weaken. Therefore, the foreign exchange rate under extremely low interest rate bound, is largely determined by some other factors, such as economic outlook and interest rate differences between Japan and foreign markets, especially the US market.
Fourth, the impulse response of REER to Call Rate is not statistically significant over the whole period (2001-2013). This result indicates that normal monetary policy in interest rate cannot be effective in the monetary market in Japan. It is also to be noted that REER has Granger cause industrial production, but it has no significant causality with BOJAC and call rate. It shows that normal monetary policy through the changes in interest rate cannot be effective.
Thus, the results of analyses based on the VAR model clearly indicate that BOJ s monetary policy has become increasingly ineffective in stimulating the real economy through bank lending and other monetary policy instruments. Also noted that there is no effective impact of stock prices on the production through easing monetary policy (i.e. increase in the base money or BOJ Current Account).
5.The Effects of Capital Flows on Monetary Policy Instruments Discussion in the previous section suggests that the BOJ s domestic monetary policy has become very limited in controlling the domestic monetary market, as
well as the real economy recently. This section deals with the effects of capital flows on the monetary policy variables (BOJAC, MB, Call Rate), based on the VAR model, including the Granger Causality test and impulse response functions.
5.1 VAR (Vector Auto Regression) Model: Estimation of the Capital Flows on the Domestic Monetary Policy Instruments
The model deals with capital flow variables and monetary policy variables, and the Choleski ordering is determined as the shock of monetary policy variables and capital flows (net) as follows:
[Model 3]:Effects of (i)capital flows (net) on (ii)monetary policy variables ( i ) Foreign Direct Investment (FDI); Portfolio Investment (Portfolio); Other
Investment (Other), Derivatives (Derivative)
( ii ) Monetary policy variables: BOJ Current Account Balance (BOJAC); Monetary Base (MB); Call Rate
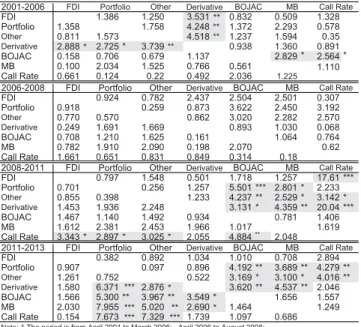
5.2 Capital Inflows and Monetary Policy Variables: Granger Causality Test
As shown in Table4, causality between the capital flows and domestic monetary policy variables has become significantly increased recently.
Table 4: Japan: Granger Causality (2001-2013)
2001-2006 FDI Portfolio Other Derivative BOJAC MB Call Rate
FDI 1.386 1.250 3.531 ** 0.832 0.509 1.328 Portfolio 1.358 1.758 4.248** 1.372 2.293 0.578 Other 0.811 1.573 4.518** 1.237 1.594 0.35 Derivative 2.888 * 2.725 * 3.739** 0.938 1.360 0.891 BOJAC 0.158 0.706 0.679 1.137 2.829 * 2.564 * MB 0.100 2.034 1.525 0.766 0.561 1.110 Call Rate 0.661 0.124 0.22 0.492 2.036 1.225
2006-2008 FDI Portfolio Other Derivative BOJAC MB Call Rate
FDI 0.924 0.782 2.437 2.504 2.501 0.307 Portfolio 0.918 0.259 0.873 3.622 2.450 3.192 Other 0.770 0.570 0.862 3.020 2.282 2.570 Derivative 0.249 1.691 1.669 0.893 1.030 0.068 BOJAC 0.708 1.210 1.625 0.161 1.064 0.764 MB 0.782 1.910 2.090 0.198 2.070 0.62 Call Rate 1.661 0.651 0.831 0.849 0.314 0.18
2008-2011 FDI Portfolio Other Derivative BOJAC MB Call Rate
FDI 0.797 1.548 0.501 1.718 1.257 17.61 *** Portfolio 0.701 0.256 1.257 5.501 *** 2.801 * 2.233 Other 0.855 0.398 1.233 4.237 ** 2.529 * 3.142 * Derivative 1.453 1.936 2.248 3.131 * 4.359 ** 20.04 *** BOJAC 1.467 1.140 1.492 0.934 0.781 1.406 MB 1.612 2.381 2.453 1.966 1.017 1.619 Call Rate 3.343 * 2.897 * 3.025 * 2.055 4.884** 2.048
2011-2013 FDI Portfolio Other Derivative BOJAC MB Call Rate
FDI 0.382 0.892 1.034 1.010 0.708 2.894 Portfolio 0.907 0.097 0.896 4.192 ** 3.689 ** 4.279 ** Other 1.261 0.752 0.522 3.169 * 3.100 * 4.016 ** Derivative 1.580 6.371 *** 2.876 * 3.620 ** 4.537 ** 2.046 BOJAC 1.566 5.300 ** 3.967 ** 3.549 * 1.656 1.557 MB 2.030 7.955 *** 5.020 ** 2.690 * 1.464 1.249 Call Rate 0.154 7.673 *** 7.329 *** 1.739 1.097 0.686
Note: 1 The period is from April 2001 to March 2006; April 2006 to August 2008; September 2008 to Feburary 2011, and March 2011 to August 2013 2 Calculation based on the average of 1st to 4th lags of the variables 䚷䚷䚷䚷3 Figures are F-value. ***, **, * denote significance at 1%, 5%, and 10%. Source: Author's calculation based on IFS database (IMF), Bank of Japan
There are strong causal relationship between BOJ Current Account (BOJAC) / Monetary Base and capital flow variables, especially short-term capital flows (portfolio, other investment, and derivatives) between 2011 and 2013. It should be noted that the causality between call rate and short term capital flows also became significant during 2011 and 2013, which was not observed until 2008.
This could be explained by the fact that short-term capital flows have become increasingly influenced on the domestic monetary policy variables, especially after the Global Financial Crisis. It could be result of increasing global capital flows in the post-Lehman Shock under the excessive liquidity provided by the major industrial countries, including the USA, EU and Japan. Thus, BOJ s monetary policy has become increasingly difficult to control over the money stock and the financial market thorough the major monetary policy instruments.
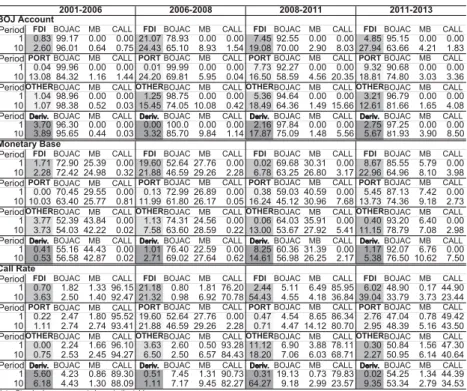
5.3 VAR Model and Variance Decomposition of the Capital Flow Variables
The impact of capital flows (FDI, Portfolio, Other Investment, and Derivatives) on the monetary policy variables (BOJAC, MB, Call Rate) are analysed by the variance decomposition (Table 5).
Table 5: Variance Decomposition of BOJ Account and Monetary Base (2)
2001-2006 2006-2008 2008-2011 2011-2013
BOJ Account
Period FDI BOJAC MB CALL FDI BOJAC MB CALL FDI BOJAC MB CALL FDI BOJAC MB CALL
1 0.83 99.17 0.00 0.00 21.07 78.93 0.00 0.00 7.45 92.55 0.00 0.00 4.85 95.15 0.00 0.00
10 2.60 96.01 0.64 0.75 24.43 65.10 8.93 1.54 19.08 70.00 2.90 8.03 27.94 63.66 4.21 1.83
PeriodPORT BOJAC MB CALL PORT BOJAC MB CALL PORT BOJAC MB CALL PORT BOJAC MB CALL
1 0.04 99.96 0.00 0.00 0.01 99.99 0.00 0.00 7.73 92.27 0.00 0.00 9.32 90.68 0.00 0.00
10 13.08 84.32 1.16 1.44 24.20 69.81 5.95 0.04 16.50 58.59 4.56 20.35 18.81 74.80 3.03 3.36
PeriodOTHERBOJAC MB CALL OTHERBOJAC MB CALL OTHERBOJAC MB CALL OTHERBOJAC MB CALL
1 1.04 98.96 0.00 0.00 1.25 98.75 0.00 0.00 5.36 94.64 0.00 0.00 3.21 96.79 0.00 0.00
10 1.07 98.38 0.52 0.03 15.45 74.05 10.08 0.42 18.49 64.36 1.49 15.66 12.61 81.66 1.65 4.08
Period㻰㼑㼞㼕㼢㻚 BOJAC MB CALL 㻰㼑㼞㼕㼢㻚 BOJAC MB CALL 㻰㼑㼞㼕㼢㻚 BOJAC MB CALL 㻰㼑㼞㼕㼢㻚 BOJAC MB CALL
1 3.70 96.30 0.00 0.00 0.00 100.0 0.00 0.00 2.16 97.84 0.00 0.00 2.75 97.25 0.00 0.00
10 3.89 95.65 0.44 0.03 3.32 85.70 9.84 1.14 17.87 75.09 1.48 5.56 5.67 81.93 3.90 8.50
Monetary Base
Period FDI BOJAC MB CALL FDI BOJAC MB CALL FDI BOJAC MB CALL FDI BOJAC MB CALL
1 1.71 72.90 25.39 0.00 19.60 52.64 27.76 0.00 0.02 69.68 30.31 0.00 8.67 85.55 5.79 0.00
10 2.28 72.42 24.98 0.32 21.88 46.59 29.26 2.28 6.78 63.25 26.80 3.17 22.96 64.96 8.10 3.98
PeriodPORT BOJAC MB CALL PORT BOJAC MB CALL PORT BOJAC MB CALL PORT BOJAC MB CALL
1 0.00 70.45 29.55 0.00 0.13 72.99 26.89 0.00 0.38 59.03 40.59 0.00 5.45 87.13 7.42 0.00
10 10.03 63.40 25.77 0.81 11.99 61.80 26.17 0.05 16.24 45.12 30.96 7.68 13.73 74.36 9.18 2.73
PeriodOTHERBOJAC MB CALL OTHERBOJAC MB CALL OTHERBOJAC MB CALL OTHERBOJAC MB CALL
1 3.77 52.39 43.84 0.00 1.13 74.31 24.56 0.00 0.06 64.03 35.91 0.00 0.40 93.20 6.40 0.00
10 3.73 54.03 42.22 0.02 7.58 63.60 28.59 0.22 13.00 53.67 27.92 5.41 11.15 78.79 7.08 2.98
Period㻰㼑㼞㼕㼢㻚 BOJAC MB CALL 㻰㼑㼞㼕㼢㻚 BOJAC MB CALL 㻰㼑㼞㼕㼢㻚 BOJAC MB CALL 㻰㼑㼞㼕㼢㻚 BOJAC MB CALL
1 0.41 55.16 44.43 0.00 1.01 76.40 22.59 0.00 8.25 60.36 31.39 0.00 1.17 92.07 6.76 0.00
10 0.53 56.58 42.87 0.02 2.71 69.02 27.64 0.62 14.61 56.98 26.25 2.17 5.38 76.50 10.62 7.50
Call Rate
Period FDI BOJAC MB CALL FDI BOJAC MB CALL FDI BOJAC MB CALL FDI BOJAC MB CALL
1 0.70 1.82 1.33 96.15 21.18 0.80 1.81 76.20 2.44 5.11 6.49 85.95 6.02 48.90 0.17 44.90
10 3.63 2.50 1.40 92.47 21.32 0.98 6.92 70.78 54.43 4.55 4.18 36.84 39.04 33.79 3.73 23.44
PeriodPORT BOJAC MB CALL PORT BOJAC MB CALL PORT BOJAC MB CALL PORT BOJAC MB CALL
1 0.22 2.47 1.80 95.52 19.60 52.64 27.76 0.00 0.47 4.54 8.65 86.34 2.76 47.04 0.78 49.42
10 1.11 2.74 2.74 93.41 21.88 46.59 29.26 2.28 0.71 4.47 14.12 80.70 2.95 48.39 5.16 43.50
PeriodOTHERBOJAC MB CALL OTHERBOJAC MB CALL OTHERBOJAC MB CALL OTHERBOJAC MB CALL
1 0.00 2.24 1.66 96.10 3.63 2.60 0.50 93.28 11.12 6.90 3.88 78.11 0.30 50.84 1.56 47.30
10 0.75 2.53 2.45 94.27 6.50 2.50 6.57 84.43 18.20 7.06 6.03 68.71 2.27 50.95 6.14 40.64
Period㻰㼑㼞㼕㼢㻚 BOJAC MB CALL 㻰㼑㼞㼕㼢㻚 BOJAC MB CALL 㻰㼑㼞㼕㼢㻚 BOJAC MB CALL 㻰㼑㼞㼕㼢㻚 BOJAC MB CALL
1 5.60 4.23 0.86 89.30 0.51 7.45 1.31 90.73 0.31 19.13 0.73 79.83 0.02 54.25 1.34 44.39
10 6.18 4.43 1.30 88.09 1.11 7.17 9.45 82.27 64.27 9.18 2.99 23.57 9.35 53.34 2.79 34.53
Note䠖Standard errors are not shown in the table. Source: Author's calculation based on the data of Bank of Japan
While capital inflows had not put any significant impact on the BOJ Current Account (BOJAC) as well as monetary base (MB) during the period 2001-2006, the result of variance decomposition shows increasing influence of capital flows on the monetary policy variables in recent years, and the results indicate the following facts:
First, the share of FDI of variance decomposition among all the monetary policy variables (BOJ Current Account, Monetary Base, and Call Rate) increased substantially after 2006 until recently. This fact indicates that monetary policy variables have become increasingly influenced by even relatively long-term investment as FDI recently. It could be due to the fact that capital flows under the category of FDI, including M&A and other forms of transactions have become financial transactions of short-term investment.
Second, the shares of variance decomposition of portfolio investment and other investment among the Monetary Base increased significantly during 2006-2013, as copared with the period 2001-2006. Thus, the capital flows, especially short-term investment flows, have increased the share of decomposition among the Monetary Base recently.
The share of derivatives of variance decomposition of all the monetary policy variables (BOJ Current Account, Monetary Base, and Call Rate) increased substantially especially during the Global Financial Crisis period (2008-2011). Particuyalrly, the increase in the share of derivatives among the call rate indicates the fact that unstable short-term transactions thourgh derivatives increased substantially, especially duing the Post Lehman Shock period of 2008-2011.
The results of variance decomposition on the monetary policy variables indicate that capital flows have played significant role in money/financial markets, and influenced on the BOJ urrent Account, Monetary Base, as well as Call Rate since 2006. Particularly, the impact of capital flows on the monetary policy variables during the post-Global Financial Crisis has increased significantly. The next section deals with Impulse Response Functions, which indicate that the impact of capital flows on the domestic monetary policy variables increased substantially.
5.4 Impulse Response Function Capital Flows and Monetary Policy Indicators
The influence of capital flows on the monetary policy variables (BOJ Current Account, Monetary Base, Call Rate) are analysed by the impulse response functions (Fig.9-1, 9-2, 9-3, 9-4) .
-1,000 0 1,000 2,000 3,000 1 2 3 4 5 6 7 8 9 10 -.02 .00 .02 .04 .06 1 2 3 4 5 6 7 8 9 10 BO JAC FD I -.005 .000 .005 .010 1 2 3 4 5 6 7 8 9 10 MB -.002 -.001 .000 .001 .002 .003 .004 1 2 3 4 5 6 7 8 9 10 Cal l Ra te
Japan: Impulse Response to FDI
-4,000 -2,000 0 2,000 4,000 6,000 1 2 3 4 5 6 7 8 9 10 -.08 -.04 .00 .04 .08 1 2 3 4 5 6 7 8 9 10 -.010 -.005 .000 .005 .010 .015 1 2 3 4 5 6 7 8 9 10 -.04 -.02 .00 .02 .04 .06 1 2 3 4 5 6 7 8 9 10 -4,000 -2,000 0 2,000 4,000 6,000 8,000 1 2 3 4 5 6 7 8 9 10 -.04 -.02 .00 .02 .04 1 2 3 4 5 6 7 8 9 10 -.005 .000 .005 .010 1 2 3 4 5 6 7 8 9 10 -.02 -.01 .00 .01 .02 .03 .04 1 2 3 4 5 6 7 8 9 10 -8,000 -4,000 0 4,000 8,000 1 2 3 4 5 6 7 8 9 10 -.04 -.02 .00 .02 .04 .06 .08 1 2 3 4 5 6 7 8 9 10 -.02 -.01 .00 .01 .02 .03 1 2 3 4 5 6 7 8 9 10 -.006 -.004 -.002 .000 .002 .004 .006 1 2 3 4 5 6 7 8 9 10 (2001-2006) (2006-2008) (2008-2011) (2011-2013)
Fig.9-1: FDI, REER, BOJAC, Monetary Base, Call Rate
-40,000 -20,000 0 20,000 40,000 60,000 1 2 3 4 5 6 7 8 9 10 -.01 .00 .01 .02 .03 .04 .05 1 2 3 4 5 6 7 8 9 10 BO JAC PO R T F O LI O -.004 .000 .004 .008 .012 1 2 3 4 5 6 7 8 9 10 MB -.002 -.001 .000 .001 .002 .003 .004 1 2 3 4 5 6 7 8 9 10 C al l R ate
Japan: Impulse Response to Portfolio
-80,000 -40,000 0 40,000 80,000 1 2 3 4 5 6 7 8 9 10 -.08 -.04 .00 .04 .08 1 2 3 4 5 6 7 8 9 10 -.010 -.005 .000 .005 .010 .015 1 2 3 4 5 6 7 8 9 10 -.04 -.02 .00 .02 .04 .06 1 2 3 4 5 6 7 8 9 10 -40,000 -20,000 0 20,000 40,000 60,000 1 2 3 4 5 6 7 8 9 10 -.04 -.02 .00 .02 .04 1 2 3 4 5 6 7 8 9 10 -.008 -.004 .000 .004 .008 .012 1 2 3 4 5 6 7 8 9 10 -.04 -.02 .00 .02 .04 .06 1 2 3 4 5 6 7 8 9 10 -40,000 -20,000 0 20,000 40,000 60,000 1 2 3 4 5 6 7 8 910 -.04 -.02 .00 .02 .04 .06 1 2 3 4 5 6 7 8 910 -.02 -.01 .00 .01 .02 1 2 3 4 5 6 7 8 910 -.006 -.004 -.002 .000 .002 .004 .006 1 2 3 4 5 6 7 8 910 (2001-2006) (2006-2008) (2008-2011) (2011-2013)
8 9 10 8 9 10 8 9 10 8 9 10 -40,000 -20,000 0 20,000 40,000 60,000 1 2 3 4 5 6 7 -.02 .00 .02 .04 .06 1 2 3 4 5 6 7 BO JA C OTH E R -.005 .000 .005 .010 1 2 3 4 5 6 7 MB -.002 -.001 .000 .001 .002 .003 .004 1 2 3 4 5 6 7 Cal l Ra te
Japan: Impulse Response to Other Investment
-80,000 -40,000 0 40,000 80,000 1 2 3 4 5 6 7 8 9 10 -.04 -.02 .00 .02 .04 .06 .08 1 2 3 4 5 6 7 8 9 10 -.005 .000 .005 .010 .015 1 2 3 4 5 6 7 8 9 10 -.04 -.02 .00 .02 .04 .06 1 2 3 4 5 6 7 8 9 10 -80,000 -40,000 0 40,000 80,000 1 2 3 4 5 6 7 8 910 -.04 -.02 .00 .02 .04 1 2 3 4 5 6 7 8 910 -.008 -.004 .000 .004 .008 1 2 3 4 5 6 7 8 910 -.04 -.02 .00 .02 .04 .06 1 2 3 4 5 6 7 8 910 -40,000 -20,000 0 20,000 40,000 60,000 1 2 3 4 5 6 7 8 9 10 -.04 -.02 .00 .02 .04 .06 1 2 3 4 5 6 7 8 9 10 -.01 .00 .01 .02 1 2 3 4 5 6 7 8 9 10 -.006 -.004 -.002 .000 .002 .004 .006 1 2 3 4 5 6 7 8 9 10 (2001-2006) (2006-2008) (2008-2011) (2011-2013)
Fig.9-3: Other, BOJAC, Monetary Base, Call Rate
-1,000 0 1,000 2,000 1 2 3 4 5 6 7 8 910 -.01 .00 .01 .02 .03 .04 .05 1 2 3 4 5 6 7 8 910 BO JAC Der iv a tiv e -.004 .000 .004 .008 .012 1 2 3 4 5 6 7 8 910 MB -.002 -.001 .000 .001 .002 .003 .004 1 2 3 4 5 6 7 8 910 Cal l Rat e
Japan: Impulse Response to Derivatives
-2,000 -1,000 0 1,000 2,000 3,000 1 2 3 4 5 6 7 8 9 10 -.04 -.02 .00 .02 .04 .06 .08 1 2 3 4 5 6 7 8 9 10 -.005 .000 .005 .010 .015 1 2 3 4 5 6 7 8 9 10 -.04 -.02 .00 .02 .04 .06 1 2 3 4 5 6 7 8 9 10 -2,000 -1,000 0 1,000 2,000 3,000 4,000 123 456789 10 11 12 -.02 -.01 .00 .01 .02 .03 .04 123 456789 10 11 12 -.008 -.004 .000 .004 .008 .012 123 456789 10 11 12 -.06 -.04 -.02 .00 .02 .04 123 456789 10 11 12 -1,000 0 1,000 2,000 3,000 1 2 3 4 5 6 7 8 910 -.04 -.02 .00 .02 .04 .06 .08 1 2 3 4 5 6 7 8 910 -.01 .00 .01 .02 .03 1 2 3 4 5 6 7 8 910 -.008 -.004 .000 .004 .008 1 2 3 4 5 6 7 8 910 (2001-2006) (2006-2008) (2008-2011) (2011-2013)
First, FDI has relatively small impact upon the response of monetary policy variables (BOJAC, MB, and Call rate) except during the period 2008-2011 (Fig.9-1). During the post-Lehman Shock period, FDI outflows increased especially in Asia under the increasing pressure of appreciation of Yen. It could explain the rise of call rate, as FDI outflows increased the result is broadly in line with the Granger Causality test.
Second, portfolio investment has significant impact on the monetary base (incl. BOJAC) and call rate since 2006 (2006-2013), and the result is in line with the Granger Causality test. The impulse response function of BOJAC and Monetary Base to portfolio investment shows negative response both periods 2008-2011 and 2011-2013 (Fig. 9-2). This suggests that portfolio investment has alternative sources to monetary base.
Third, the impulse response of BOJAC and Monetary Base to Other investment was limited during 2001-2006 (Fig.9-3). However, other investment has increasingly put impact on the monetary base and BOJAC during 2008-2011 and 2011-2013. The impulse response of call rate also shows significant response to short-term capital flows.
Finally, although general impact of derivatives on the monetary policy variables were limited and insignificant during the period 2001-2006 and 2006-2008, the effects of inflows of derivaives have increased since the Global Financial Crisis, especially during 2008-2011.
The above results indicate that short-term capital flows (portfolio, other investment, derivatives) have increased their influence on the levels of BOJCurrent Account and Monetary Base, as well as Call rate. Therefore, BOJ s monetary policy has become increasingly influenced by capital flows which have put impact upon the monetary policy variables recently.
6. The Effectiveness of Monetary Policy in Japan
6.1 Ineffectiveness of Domestic Monetary Policy and Influence of Capital Flows
The results of the analyses in the previous sections indicate that significant monetary easing policy has become ineffective in the domestic monetary market. Such a change is probably caused by significant increase in the global capital flows which have affected the domestic monetary policy in Japan recently. Major points of the analysis are summarized as follows: