INVITED PAPER
Special Section on Ambient Intelligence and Sensor NetworksRadiation Distribution Measurements in Fukushima Prefecture
Nobuo NAKAJIMA†a),Fellow
SUMMARY On March 11, 2011, a huge tsunami caused by the Great East Japan Earthquake destroyed all the electrical power facilities in the Fukushima Daiichi nuclear power plant. As a result, the reactors were badly damaged, and radioactive particles were widely scattered in the sur- rounding areas. In order to study the behavior of the radioactive particles emitted from the Fukushima Daiichi nuclear power plant, different mea- surement tools were developed. This paper describes two types of wireless radiation sensor networks and a two-dimensional radiation-level mapping system using a radio-controlled multi-copter. The measurements were an- alyzed, and the following conclusions were made regarding the radioactive particle distribution and its variation with time.
(1) Radiation level has gradually decreased with time.
(2) The rate of decrease in radiation is faster than that calculated from the half-life.
(3) The radiation-level distribution is not uniform and sharply varies even within short distances such as tens of meters.
(4) The locations of the hot spots have not changed, and the peak radiation levels are constantly decreasing.
By using two-dimensional maps, the radiation levels can be lowered more effectively by selectively removing the highly radioactive materials.
The residents can also use the map to reduce their exposure to radiation by avoiding hot spots.
key words: wireless, sensor, radiation, network
1. Introduction
At 2:46 p.m. on March 11, 2011, the Great East Japan Earth- quake hit the east coast of Japan. The earthquake triggered tsunami waves that destroyed all the electrical power facil- ities at the Fukushima Daiichi nuclear power plant. As a result, the reactors were damaged, leaking radioactive par- ticles into the surrounding areas. When the accident hap- pened, the radiation-level distribution around the Fukushima Daiichi nuclear power plant was unclear, because there was no tool to detect the radiation. After the accident, various sensing technologies were tried to measure the radiation- level distribution and its variation with time. People car- ried survey meters in cars and measured the radiation-level distribution along the roads. Airplanes were used to mea- sure the wide-area radiation-level distribution from the sky.
However, these methods consume a great amount of human resources and time in order to measure the wide area radia- tion distribution.
Wireless networks are well-suited for solving such Manuscript received April 15, 2014.
Manuscript revised May 4, 2014.
†The author is with The University of Electro-Communica- tions, Chofu-shi, 182-8585 Japan.
a) E-mail: [email protected] DOI: 10.1587/transcom.E97.B.1752
problems. Multiple radiation sensors are placed in the target area, and the measurement data are collected by the wireless network. Radiation levels can be measurement at any time without involving human resources. If additional radioac- tive particles happen to be emitted by the nuclear power plant, the change in the radiation level will be detected im- mediately. The radiation-level distribution varies with time according to climatic factors such as wind and rain. Long- term measurements made by the wireless sensor network are very important to analyze the resulting change in radioactiv- ity.
In this paper, two types of radiation sensor networks are described. The first type is based on collecting sensor data from a cellular network. These sensor networks can only be used in areas where a cellular network is available.
MEXT (Ministry of Culture, Sports, Science and Technol- ogy, Japan) uses such a network involving 2700 sensors for real-time radiation-level monitoring in the Fukushima pre- fecture.
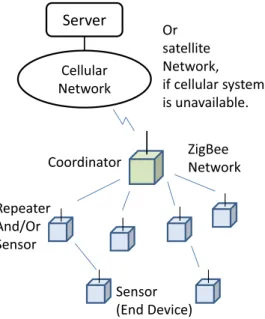
The second type is a short-range wireless system called ZigBee, which can be used in any area. In this network, the sensor data are transmitted and collected by an ad-hoc wire- less network. Therefore, these networks can be used even if the cellular system is unavailable or damaged by a disaster.
A low operational cost is another advantage because it does not use the cellular system, which would incur a monthly fee.
The wireless sensor networks mentioned above are useful for real-time and long-time radiation level mea- surements. However, it is difficult to prepare a detailed radiation-level distribution map because of the limited num- ber of sensing points. Usually, the sensors are located sev- eral hundred meters or several kilometers apart. However, measurements indicate that the radiation level can vary even over short distances such as tens of meters. This means that the radiation-level measurement by the wireless sensor net- work is not enough for evaluating the detailed radiation ef- fect on human safety. Thus, a measurement system that pro- vides a precise radiation-level distribution map was devel- oped and tested at the Fukushima prefecture. This system showed us a very small hot spot that could not be spotted using the high-altitude measurements made by an airplane.
Section 2 introduces the wireless radiation sensor net- work that uses the cellular network. Section 3 describes the wireless radiation sensor network that uses ZigBee and also presents the measurement results. Section 4 presents the measured radiation level distribution along the roads. Sec- Copyright c2014 The Institute of Electronics, Information and Communication Engineers
agement system, and rechargeable battery. The radiation sensor is placed either 50 cm or 1 m above the ground. Be- cause the post is powered by solar energy, it can be installed anywhere, even at locations where an electrical power sup- ply is not available. The sensor data are averaged and sent to the data center via the cellular system every 10 min. The height of the monitoring post is approximately 2 m. Figure 2 shows a photograph of the monitoring post. This system is currently operational, and the radiation levels are updated on the web site [1].
Fig. 1 Monitoring post system.
Fig. 2 Monitoring post.
short-range wireless ad-hoc mesh network system that has low power consumption because the RF output power is very low, and the transmission distance is limited to a few hundred meters in an outdoor environment. The advan- tages of Zigbee are that it is compact, inexpensive, and usable in areas where cellular networks are not available.
When many measurement points are needed to make a de- tailed radiation-level distribution map, ZigBee-type sensor networks are preferable because they are more economical.
Although the low output power limits the transmission dis- tance, ZigBee has a multi-hop function for a long distance communication.
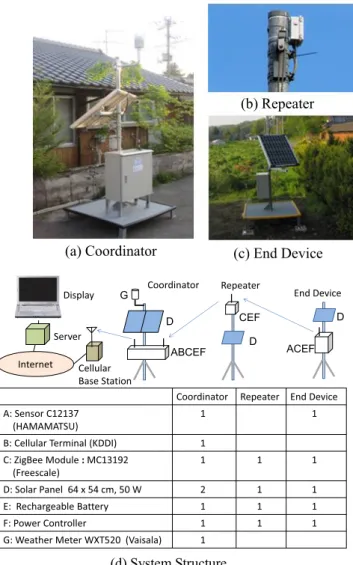
The experimental system is composed of a coordinator, a repeater, and two end devices. Figure 4 shows photographs and the system structure. The structure of the end device is almost the same as the monitoring post, except that a Zig- Bee wireless module is used in place of a cellular terminal.
The repeater is attached at the top of a tall pole (10 m) to support long-distance communication. The coordinator and end devices have radiation sensors. The coordinator also has a weather meter. Figure 5 shows the internal structure of the coordinator.
The major specifications of the equipment are (1) ZigBee module: Freescale MC13192
Fig. 3 Wireless sensor network using ZigBee.
Fig. 4 Wireless sensor network using ZigBee.
Fig. 5 Inside the coordinator.
(2) Cellular System: KDDI
(3) Radiation Sensor: HAMAMATSU C12137 Sensitivity137Cs/0.01µSv/h: 40 cpm Measurement Range: 0.01–100µSv/h Tolerance:<20%
Fig. 6 Kawauchi village, Fukushima prefecture.
Fig. 7 Sensor location.
(4) Solar Panel: 64×54 cm, 50 W (5) Weather Meter WXT520 (Vaisala)
Wind Speed, Direction, Pressure, Temperature, Humid- ity, Precipitation
The measured radiation data packet is transmitted from the end devices to the repeater every ten minutes, and the repeater passes the data packet to the coordinator. When the coordinator receives the data packet from the repeater, the packet is sent to the data server via the cellular network and internet.
Measurements began in May 2012 at the Kawauchi village in the Fukushima prefecture (Fig. 6). The distance from the nuclear power plant to the village is approximately 20 km. The sensor locations are marked in Fig. 7. The end devices 1 and 2 were placed at a distance of approximately 500 m and 200 m from the coordinator.
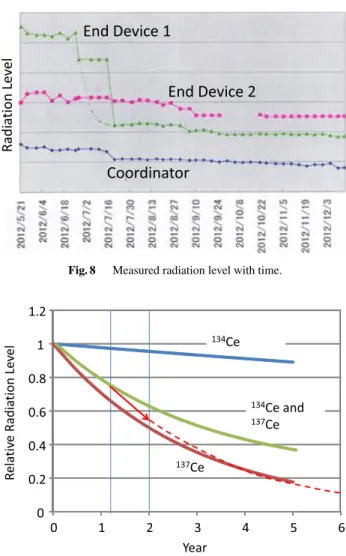
Figure 8 shows the measured radiation levels at three measuring points. The relative radiation level is plotted on the vertical axis. The radiation levels are different at dif- ferent locations, even if they are separated by only a few hundred meters. The radiation levels measured at End De-
Fig. 8 Measured radiation level with time.
Fig. 9 Radiation-level reduction with time.
vice 2 and Coordinator gradually decreased with time. On the other hand, the radiation level at End Device 1 suddenly decreased and then gradually decreased. This is because radioactive particles on the ground were removed in June 2012. The radiation level did not increase after the treat- ment.
Figure 8 shows that the long-range decreasing rate of the radiation level is approximately 35% per year. In the case of the Fukushima accident, the radiation is mainly from
134Ce and137Ce. The amounts of both radioactive particles are almost the same as those at the time of the accident. The half-life of134Ce is two years and that of137Ce is 30 years.
Using this information, the radiation-level reduction rate is calculated (Fig. 9). According to the calculation based on the half-life, the radiation level should decrease by approx- imately 20% during the measurement period. However, the actual rate of decrease was approximately 35%. The reason for this could be the diffusion of the radioactive particles by rain and wind. If this trend continues, the radiation level might decrease faster than the calculations based on the half- life of the radioactive materials indicate.
Fig. 10 Radiation level along the road.
Fig. 11 Measuring system for road-side radiation.
4. Radiation-Level Distribution Measurement along a Road
When we started our measurements, it was expected that the radiation-level distribution would be uniform and that it would not change much within a small area (for instance, within several hundred meters).
However, the readings we obtained along a road at the Kawauchi village (Fig. 10) indicate that the radiation levels varied markedly within tens of meters.
Thus, it is clear that radiation-level measurements at discrete points are not enough to make decisions regard- ing the safety of a locality. Although the measurements by an airplane generate a two-dimensional radiation-level dis- tribution map, it is too coarse for finding small hot spots.
Therefore, the next step of our project was to measure the radiation-level distributions and their variation with time along many more roads in Kawauchi village. Figures 11 and 12 show the structure and a photograph of the measur- ing system. The radiation was measured by a C12137 radio detection module, and the location was measured using GPS receiver A100 whose accuracy is<0.6 m with 95% proba- bility. The measurements (radiation level and GPS position) are stored in a PC with a time stamp.
Measurements were carried out roughly every two
Fig. 12 Photograph of the measuring system.
months between August 2012 and April 2013. Figure 13 shows the results. From these measurements, two things are clear. The radiation-level distribution profile has not changed. This may be because the radioactive particles are fixed to the ground and were not dislodged by rain or wind.
At almost every point, the radiation levels decreased grad- ually. Using these results, hot spots can be identified, and the removal the radioactive particles from such spots can be prioritized to reduce the overall radiation level efficiently.
5. Two-Dimensional Radiation-Level Distribution by a Multi-Copter
It is clear that measurements along the road are not enough to obtain a precise two-dimensional radiation-level map.
However, it is difficult to cover the entire area by foot or car.
Thus, we used a radio-controlled multi-copter for scouring the region.
Thanks to the progress of battery technology, an electrically-powered radio-controlled helicopter became useful tool for various purposes. Especially, multi-copters are popular for video photography from the sky. The flight can be made very stable with the aid of the onboard sen- sors (GPS, accelerometer, gyroscope, air pressure and geo- magnetism sensors). The flight time is approximately 10–
20 min.
For our measurements, multi-copter DJI S-800 model was used. The major specifications are
Diameter 80 cm
Height 32 cm
TakeoffWeight 6–8 kg Power Consumption 800 W Radio Control 2.4 GHz
Figure 14 shows the architecture of the measurement system. The radiation-level and position readings are trans- mitted by the multi-copter to the receiver, which is con- nected to a PC by USB. Wireless transmitter and receiver operating at 920 MHz are employed. A Google map is shown on the PC screen. The position of the multi-copter is indicated on the screen, and the radiation level is shown at the bottom of the screen. Figure 15 shows a photograph
Fig. 13 Radiation level along the road.
of the system, and Fig. 16 is an example of the flight course on the Google map.
The flight course of the multi-copter is set as a grid in order to obtain all the necessary information to map the entire area. The grid spacing is 5–10 m.
Figure 17 shows an example of the measured radiation- level distribution. The size of each colored square block is 5 m×5 m. The color indicates the radiation strength of the last measured data within a block. Figure 17 is not yet a two-dimensional map because there are many white spaces.
In order to fill in the map, a mathematical interpolation pro- cess is applied. The map is split into 5 m×5 m square pix- els. The radiation levels at the white (vacant) pixels are esti-
Fig. 15 Multi-copter (DJI S-800) for radiation measurement.
Fig. 16 Flight course on the Google map.
Fig. 17 Measured radiation level distribution.
mated using the readings for the measured pixels. A weight is assigned to every measured pixel using the distance be- tween the current white pixel point and the measured point.
A smaller weight is used for a greater distance between two
Fig. 18 Two-dimensional radiation level maps.
points. The weights are set so that the interpolation becomes smooth.
Figure 18 shows two-dimensional radiation-level dis- tribution maps. In Fig. 18(a), the radiation level is low along the road (upper left side). There is a dry grass area at the lower right side of the map, where the radiation level is high.
The radiation level is high in the dry grass area (lower side) in Fig. 18(b) as well. Figure 18(c) is a temporary storage
Fig. 19 Small multi-copter (Phantom 2) for radiation measurement.
area for radioactive garbage. Green sheets are used to cover the garbage.
The two-dimensional map shows that the radiation lev- els on the surrounding roads are almost normal, and high radiation levels were only observed on the garbage dumps.
During the measurement, the multi-copter flew with a walking speed in order to keep the accuracy of the measured radiation data. Measurements took 18, 16 and 25 minutes, for location A, location B and temporary storage area, re- spectively.
By using these two-dimensional maps, the highly ra- dioactive regions can be selectively cleaned. Moreover, res- idents can reduce exposure to radiation by avoiding the hot spots shown on the map.
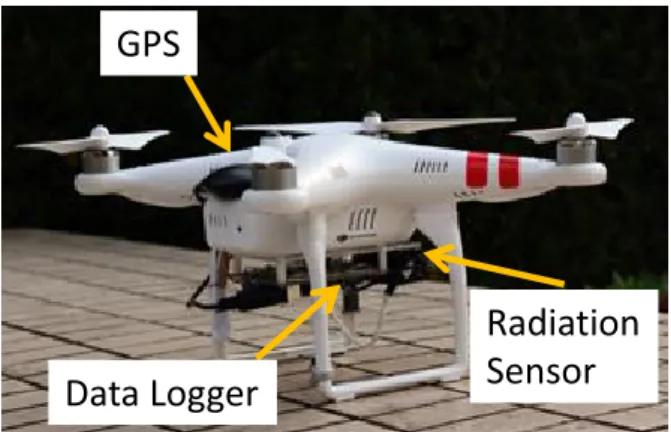
The multi-copter is a useful tool to study the radiation- level distribution. However, the aforementioned multi- copter is heavy and difficult to control by those unfamil- iar with a radio control system. To solve this problem, an advanced radiation measurement system using light weight multi-copter Phantom 2 was developed (Fig. 19). The major specifications are
Diameter 35 cm
Height 19 cm
TakeoffWeight 1 kg Power consumption 312 W Radiation sensor iMetry
Data Logger mbed
In order to minimize the weight, iMetry was used as the radiation sensor. Although iMetry is light, its sensitiv- ity is very high (60 cpm at137Cs/0.01µSv/h). The measured radiation and position data are logged in the memory of the microprocessor (mbed) during the measurement. This sys- tem is very compact, and the flight is very stable. Further, this system can be controlled by radio-control beginners af- ter a short training period.
6. Conclusion
This paper described two types of wireless radiation-level sensor networks and a two-dimensional radiation-level map- ping system. The measured results were analyzed, and the
following inferences were made about the characteristics of the radiation-level distribution and its variation with time.
(1) The radiation level has gradually decreased with time.
(2) The rate of decrease is greater than that calculated from the half-life.
(3) The radiation-level distribution is not uniform and varies even within short distances such as tens meters.
(4) The hot-spot locations have not changed, and the peak radiation levels are constantly decreasing.
By using two-dimensional maps, the decontamination of the radioactive materials may become more efficient be- cause they can be selectively removed. Moreover, the resi- dents can reduce their exposure to radiation by avoiding the hot spots shown on the map.
Acknowledgments
The author wishes to thank Prof. K. Kawatsu and Mr. S. Chiaki, Fukushima University for their cooperation and advice during measurements at the Fukushima Prefec- ture.
References
[1] http://radioactivity.nsr.go.jp/map/ja/
[2] N. Nakajima and K. Kawatsu, “Wireless radiation sensor network for Fukushima,” APCC2013 Special Session 1, 2013.
Nobuo Nakajima received B.S., M.S., and Ph.D. degrees in electrical engineering from To- hoku University, Sendai, Japan, in 1970, 1972, and 1982, respectively. In 1972, he joined NTT and was involved in the development of anten- nas. In 1998, he became the NTT DoCoMo se- nior vice president. In 2000, he moved to the University of Electro-Communications.