Spatial-Temporal Distribution of Carbon Capture
Technology Drawing on Patent Data
Huan LIU, Weisheng ZHOU, Xuepeng QIAN, Ken’ichi NAKAGAMI
Abstract
CCS is a currently available technology that can allow industrial sectors to meet deep emissions reduction goals. The development of carbon capture technology is vital to make CCS viable. As a significant output indicator of innovation, patent can provide a comprehensive view on innovation activities. This study aims to present an overview on carbon capture technology, in the attempt to characterize spatial and temporal distribution based on patent bibliometrics. We make a retrieval strategy and built a database set of 9847 patents in span of forty years from Derwent Innovations Index database. About temporal trend, this study reveals slow increasing phase and sharp increasing phase by annual patent count. Then presents emerging stage and growth stage by cumulative patent count drawing on theoretical model of technology life cycle. Year of 2006 is the turning point apparently, but it’s not an accident due to shifts emerged in governments, innovators and firms in years before. About spatial distribution, this study highlights eight countries (Japan, USA, France, China, Germany, Netherlands, UK and Korea) who have most of patents in the world in terms of top 50 patent assignee codes. The study tries to show the relative technical development trends across major countries. French occupies top mostly, China ranks up quickly, Japan, USA and Germany rank down relatively. Based on analysis above, we speculate that “Good Time” of carbon capture technology is coming, but operation of CCS project is still in slow growth due to some limitations.
1.Introduction
1.1.Climate change and CCS
2015 was the warmest year on record by far [1]. Most of the observed increase in global average temperatures since the mid-20th century is very likely ( > 90% probability) due to observed increase in anthropogenic greenhouse gases (GHGs) concentrations [2]. The climate will continue to change over the coming decades as more and more heat-trapping GHGs emitted by human activities accumulate in the atmosphere. On the other hand, in case of not focus on costs, humanity can solve the GHGs concentrations problem by fifteen available and implemented technologies, including carbon dioxide (CO2) capture and storage (CCS) [3]. CCS is a currently available technology
that can allow industrial sectors (e.g., fossil-fuel power generation, iron and steel, cement, natural gas processing, oil refining, etc.) to meet deep emissions reduction goals. CCS can contribute one-sixth of CO2 emission reductions
required in 2050, and can contribute 14% of the cumulative emissions reductions between 2015 and 2050 compared to a business-as-usual approach, which would correspond to a 6°C rise in average global temperature [4].
CCS is not a single technology but involves the implementation of the following processes in an integrated manner: separation of CO2 from mixtures of gases (e.g., the flue gases from a power station or a stream of CO2-rich natural
gas) and compression of this CO2 to a liquid-like state; transport of the CO2 to a suitable storage site; injection of the
CO2 into a geologic formation where it is retained by a natural (or engineered) trapping mechanism and monitored
as necessary [5]. For enhancing CO2 usage, utilization of CO2 is integrated into CCS as CCUS in some countries[6],
due to CO2 is used maturely in fields for instance enhanced oil recovery (EOR), enhanced coal-bed methane (ECBM),
CO2 chemical utilization and CO2 biotransformation. Nonetheless, these is no essential distinguish between CCS and
CCUS.
Many CCS technologies are commercially available today and can be applied across different sectors. CO2 capture
technologies include types of capture systems (see Fig. 1) such as post-combustion, pre-combustion and oxyfuel combustion, which have been available in natural gas processing, fertilizer manufacturing and hydrogen production. CO2 transport technologies are the most technically mature in CCS, including pipeline and shipping. CO2 storage
technologies include many of same in oil and gas industry and have been proven to be economically feasible under specific conditions.
1.2.Carbon capture innovation activity
In most CCS systems, the cost of capture (including compression) is the largest cost component due to an additional high energy penalty. This could be reduced by technical development and economies of scale [8,9]. Furthermore, in the view of technology, the development of CO2 capture technologies is vital to make CCS viable [10]. Meanwhile,
in the view of patent bibliometrics, we find that most of CCS patents refer to CO2 capture technologies in testing
extractions which were done at the beginning of this study. Some former studies also revealed that carbon capture patents account for a large part in CCS patents (e.g., [11,12]). Hence, suitability of CCS in industrial applications mostly depends on the costs and readiness of carbon capture [4]. As a result, we study on carbon capture technology in this paper.
There are a number of possibilities for the measurement of innovation [13], which can be divided into two categories: input-based indicators and output-based indicators. Patent is considered as a significant output indicator of innovation or a tangible sign of knowledge, which can give a valuable insight into innovative activity of an object technology [14]. The main advantage of patent is that they are publicly available for rather long time periods and provide detailed technological information [15]. Patent is used in providing a comprehensive view on innovation activities in many domains, including low-carbon without a doubt. In former refers on low-carbon innovation activities, patent count provides a wealth of information on innovations and inventors as a kind of indication, e.g., [16–23].
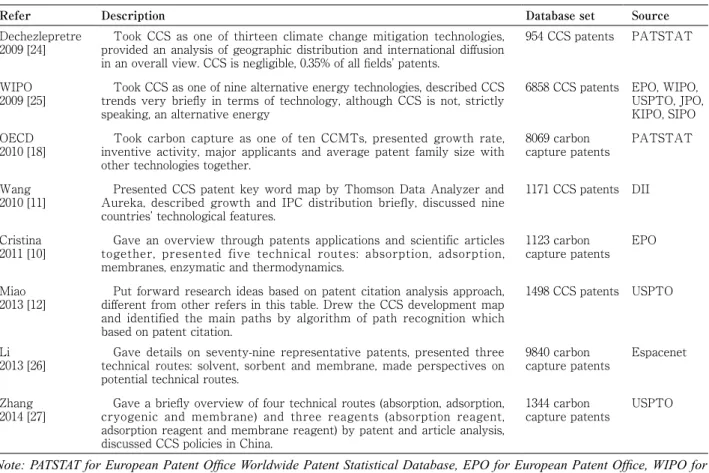
Several studies investigated CCS technology or carbon capture technology by using patent bibliometrics. Dechezlepretre [24], WIPO [25] and OECD [18] analyzed a cluster of CCMTs (climate change mitigation technologies), gave briefly overviews on CCS technology. Cristina [10], Li [26] and Zhang [27] focused on specific technical routes and reagents in carbon capture, by drawing on patent bibliometrics or, on patent and article bibliometrics together. Wang [11] drew patent map of CCS and discussed technological features in nine countries. Miao [12] drew development paths by patent citation analysis, a different method from others. We review these studies and make a general comparison (see Table 1).
First, by distinguishing the purpose of study, we divide these articles into two categories. One category is a general report which take CCS as a supplement field rather than an essential part. Another category is full of specialized words which focus on technical routes mainly. But few studies pay attention on an overall spatial-temporal analysis in scale of all carbon capture technologies. There is no deeper understand on developmental trend and on technological distribution as far as we know.
Second, patent count differs widely across studies from 945 to 9840, probably due to various databases, diverse retrieval strategies and distinguishing time span. In general but not absolutely, searching in several databases (e.g., WIPO [25] used six databases) or search in an integrated database (e.g., OECD [18] used PATSTAT and Li [26] used Espacenet), could provide a more reasonable result. However, Dechezlepretre [24] and Wang [11] got fewer patents from integrated database PATSTAT and Derwent Innovations Index database. The reason we examine is the incomplete search expression they used.
Finally, patent family was used popular. A patent family is a set of similar patents taken in various countries to protect a single invention. Therefore analysis by patent family reflects the number of inventions present more accurately.
Thereby, our study aims at extending these previous studies through the creation of a more complete database set from Derwent Innovations Index database, by using a more suitable search expressions. Then, highlights development stages in forty years and analyzes geographical feature in terms of countries.
The remainder of this article is structured as follows: Section 2 outlines the data source and retrieval strategy. Database in Section 2 is used in Section 3 to analyze temporal distribution of carbon capture in terms of yearly and cumulative. Section 4 shows spatial distribution. Section 5 contains a concluding discussion.
Table 1 Former studies related to carbon capture technology by patent bibliometrics.
Refer Description Database set Source
Dechezlepretre
2009 [24] Took CCS as one of thirteen climate change mitigation technologies, provided an analysis of geographic distribution and international diffusion in an overall view. CCS is negligible, 0.35% of all fields’ patents.
954 CCS patents PATSTAT
WIPO
2009 [25] Took CCS as one of nine alternative energy technologies, described CCS trends very briefly in terms of technology, although CCS is not, strictly speaking, an alternative energy
6858 CCS patents EPO, WIPO, USPTO, JPO, KIPO, SIPO OECD
2010 [18] Took carbon capture as one of ten CCMTs, presented growth rate, inventive activity, major applicants and average patent family size with other technologies together.
8069 carbon
capture patents PATSTAT
Wang
2010 [11] Presented CCS patent key word map by Thomson Data Analyzer and Aureka, described growth and IPC distribution briefly, discussed nine countries’ technological features.
1171 CCS patents DII Cristina
2011 [10] Gave an overview through patents applications and scientific articles together, presented five technical routes: absorption, adsorption, membranes, enzymatic and thermodynamics.
1123 carbon
capture patents EPO
Miao
2013 [12] Put forward research ideas based on patent citation analysis approach, different from other refers in this table. Drew the CCS development map and identified the main paths by algorithm of path recognition which based on patent citation.
1498 CCS patents USPTO
Li
2013 [26] Gave details on seventy-nine representative patents, presented three technical routes: solvent, sorbent and membrane, made perspectives on potential technical routes.
9840 carbon
capture patents Espacenet
Zhang
2014 [27] Gave a briefly overview of four technical routes (absorption, adsorption, cryogenic and membrane) and three reagents (absorption reagent, adsorption reagent and membrane reagent) by patent and article analysis, discussed CCS policies in China.
1344 carbon
capture patents USPTO
Note: PATSTAT for European Patent Office Worldwide Patent Statistical Database, EPO for European Patent Office, WIPO for World Intellectual Property Office, USPTO for United States Patent and Trademark Office, JPO for Japan Patent Office, KIPO for Korean Intellectual Property Office, SIPO for State Intellectual Property Office of the People’s Republic of China, DII for Derwent Innovations Index database.
2.Patent database set and retrieval strategy
In this study, Derwent Innovations Index (DII) database of Web of Science (from the I.S.I. Web of Knowledge) is used to search and analyze patent data set. DII database is a widely accepted patent data source that covers over 14.3 million basic inventions from 40 worldwide patent-issuing authorities. For patent bibliometrics study, the most fundamental task is to set the range of retrieval and choose appropriate index words. Based on former studies (see Table 1), search indicators in this study include two dimensions: search topics and search IPC codes.
About search topics, we collected key words of types of carbon capture processes, combined them as one topic search expression by logic operators. Whilst, for a more rigorous search result, we identified thesaurus details of IPC codes related to those key words, combined them as one IPC codes search expression by logic operators too. IPC system is the most popular hierarchical classification system of patents among countries or organizations with official patent offices, launched by the World Intellectual Property Organization (WIPO). We tested dozens of combined search topics and search IPC codes, compared results of inputting different expressions, adopted the most suitable expressions after trial and error. In testing, we found a dozen of world famous vehicle companies. But they are not professional in domain of carbon capture. We found that most of patents from vehicle companies related to automobile exhaust gases pollution control. Therefore, we excluded this interference technology expressions by using logic operator “not”. Comparing with foregoing studies, as far as we know, it is the first time to exclude exhaust
control technologies in patent data searching by logic operator, for accessing a more concentrative database set of carbon capture patents.
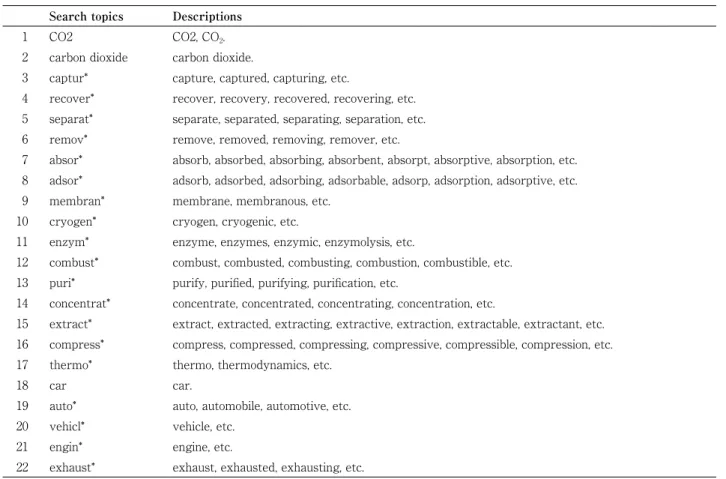
Expressions of search topics and search IPC codes used in this study are as below:
Search topics (description see Table 2a): (CO2 or (carbon dioxide)) and (captur* or recover* or separat* or remov* or absor* or adsor* or membran* or cryogen* or enzm* or combust* or puri* or concentrat* or extract* or compress* or thermo*) not (car or auto* or vehicl* or engin* or exhaust*).
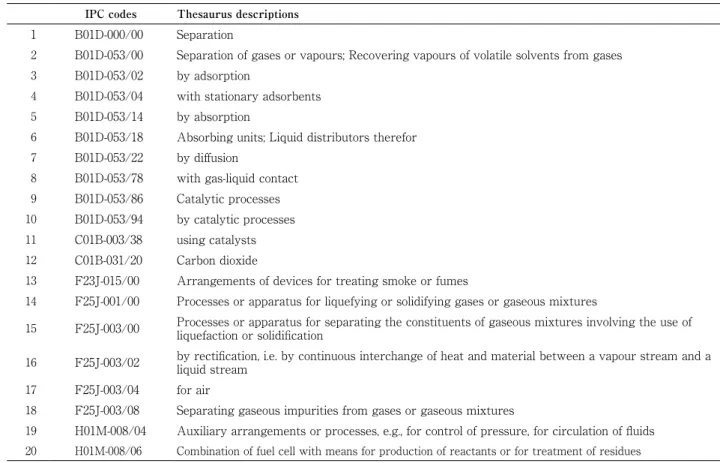
Search IPC codes (thesaurus description see Table 2b): (000/00 or 053/00 or 053/02 or B01D-053/04 or B01D-053/14 or B01D-053/18 or B01D-053/22 or B01D-053/78 or B01D-053/86 or B01D-053/94 or C01B-003/38 or C01B-031/20 or F23J-015/00 or F25J-001/00 or F25J-003/00 or F25J-003/02 or F25J-003/04 or F25J-003/08) not (H01M-008/04 or H01M-008/06).
The final patent data searching was conducted on April 2016. A total of 9847 patent files were found in time span of forty years from 1976 to 2015. For each patent in our database, several data fields were extracted such as authorization year, assignee name, assignee code and IPC code etc.
Table 2a Descriptions of search topics
Search topics Descriptions
1 CO2 CO2, CO2.
2 carbon dioxide carbon dioxide.
3 captur* capture, captured, capturing, etc.
4 recover* recover, recovery, recovered, recovering, etc.
5 separat* separate, separated, separating, separation, etc.
6 remov* remove, removed, removing, remover, etc.
7 absor* absorb, absorbed, absorbing, absorbent, absorpt, absorptive, absorption, etc.
8 adsor* adsorb, adsorbed, adsorbing, adsorbable, adsorp, adsorption, adsorptive, etc.
9 membran* membrane, membranous, etc.
10 cryogen* cryogen, cryogenic, etc.
11 enzym* enzyme, enzymes, enzymic, enzymolysis, etc.
12 combust* combust, combusted, combusting, combustion, combustible, etc.
13 puri* purify, purified, purifying, purification, etc.
14 concentrat* concentrate, concentrated, concentrating, concentration, etc.
15 extract* extract, extracted, extracting, extractive, extraction, extractable, extractant, etc.
16 compress* compress, compressed, compressing, compressive, compressible, compression, etc.
17 thermo* thermo, thermodynamics, etc.
18 car car.
19 auto* auto, automobile, automotive, etc.
20 vehicl* vehicle, etc.
21 engin* engine, etc.
Table 2b Thesaurus descriptions of search IPC codes
IPC codes Thesaurus descriptions
1 B01D-000/00 Separation
2 B01D-053/00 Separation of gases or vapours; Recovering vapours of volatile solvents from gases
3 B01D-053/02 by adsorption
4 B01D-053/04 with stationary adsorbents
5 B01D-053/14 by absorption
6 B01D-053/18 Absorbing units; Liquid distributors therefor
7 B01D-053/22 by diffusion
8 B01D-053/78 with gas-liquid contact
9 B01D-053/86 Catalytic processes
10 B01D-053/94 by catalytic processes
11 C01B-003/38 using catalysts
12 C01B-031/20 Carbon dioxide
13 F23J-015/00 Arrangements of devices for treating smoke or fumes
14 F25J-001/00 Processes or apparatus for liquefying or solidifying gases or gaseous mixtures
15 F25J-003/00 Processes or apparatus for separating the constituents of gaseous mixtures involving the use of liquefaction or solidification
16 F25J-003/02 by rectification, i.e. by continuous interchange of heat and material between a vapour stream and a liquid stream
17 F25J-003/04 for air
18 F25J-003/08 Separating gaseous impurities from gases or gaseous mixtures
19 H01M-008/04 Auxiliary arrangements or processes, e.g., for control of pressure, for circulation of fluids
20 H01M-008/06 Combination of fuel cell with means for production of reactants or for treatment of residues
3.Temporal distribution of carbon capture technology
Practitioners and researchers are often interesting in, regard to a certain technology field, what the tendency is and where will drive to. For evaluating progress in carbon capture innovation approach, we extract data of authorization year from database set, identify shifts by yearly growth and cumulative development, and then draw some similar conclusions from diverse views.
3.1.Yearly development of patent count
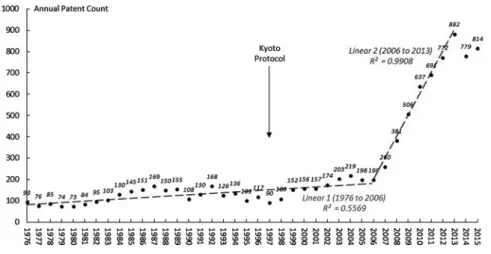
Fig. 2 presents authorized carbon capture patents yearly since 1976, as measured by patent count. The trend shows two phases clearly: 1) fluctuant and slow increasing phase; 2) sharp increasing phase. Apparently, year of 2006 is the turning point in technology development. In fluctuant and slow increasing phase before 2006, annual patent count increased slowly, even negative growth in some years. The AAGR (average annual growth rate) was only 2.6%. The annual average is about 133 patents. In sharp increasing phase since 2006, annual patent count increases quickly, the AAGR was 23.8% from 2006 to 2013. This phase presents a linear increasing with high curve similarity: R2 = 0.9908
(see Fig. 2). The annual average count from 2006 to 2015 is about 636, nearly 5 times of former phase. The shape increasing since 2006 is not an accident of course, implies many shifts.
First, there is a wide agreement among 100 experts surveyed in Alphen’s study [9] that capture facilities are not substantially different than for conventional industrial facilities. Thus in most years, carbon capture technology was applied in general sector and grew slowly. As carbon capture being a crucial technology in CCS chain, innovation
activities are booming.
Second, it is usually need years to deploy and implement innovation activities by governments and innovators. The increasing trend in carbon capture technology from new century seems to reflect a significant influence of climate change policies since the signing of the Kyoto Protocol in 1997. Dechezlepretre [24] also pointed out that Kyoto Protocol affected innovations in a cluster of climate change mitigation technologies including CCS technology, probably due to innovators reacted swiftly to policy changes, private sector received a strong signal and many countries took early action before ratification.
Third, the increasing trend also related to environmental concerns and commercial drives [26]. Sleipner project in Norwegian continental shelf is a milestone effort of carbon mitigation, which is called “the mother of all CCS projects”, separates and injects 1 Mt CO2 into saline formation each year since 1996 [28]. On the other hand, several
CCS projects are driven by commercial utilization of CO2 like CO2 injection for enhanced oil recovery (EOR).
In addition, patent counts in 2014 and 2015 do not correspond with the reality, due to the time lag between application and authorization. Thereby, the last two years are used for comparing rather than analyzing exactly.
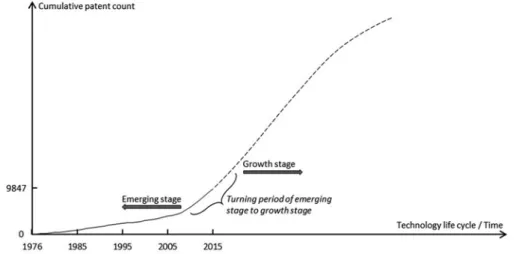
3.2.Technology life cycle of carbon capture
The concept of technology life cycle is always presented to measure technological changes began from Arthur [29]. Technology life cycle includes two dimensions and four stages. Two dimensions are competitive impact and integration in products or process ― patent can be regarded as a product of innovation activities. Four stages are emerging, growth, maturity and saturation stages. According to Arthur’s definition, the emerging stage is a new technology with low competitive impact and low integration in products or processes. In the growth stage, there are pacing technologies with high competitive impact that have not yet been integrated in new products or processes. In the maturity stage, some pacing technologies are integrated into products or processes. In the saturation stage, a technology becomes a base technology and might be replaced by a new technology. Fig. 3a illustrates the S-curve definition of four stages.
Fig. 2. Annual patent count of carbon capture by authorized year, linear 1 presents trend from 1976 to 2006, linear 2 presents trend from 2006 to 2013. (Data Source: Derwent Innovations Index Database, 2016.)
Fig. 3b presents cumulative patent count of carbon capture from 1976 to 2015. Comparing to theoretical model in Fig. 3a, turning period is highlighted in Fig. 3b. Two stages of technological life cycle are found: 1) the emerging stage and 2) the growth stage. We believe that the growth stage is coming, a sharp increasing of patent count will be available in future years. Need to point out that, two stages of technological life cycle are in terms of cumulative patent count. It is different from two phases by annual patent count mentioned in Fig. 2.
4.Spatial distribution of carbon capture technology
In the previous section, we give a discussion on temporal trend in overall countries. In this part, we focus on spatial distribution of technology for assessing which countries are leading in innovation. At first, distribution of patent is presented in terms of top 50 assignee codes. Then, some discussions relative development trends among high-tech countries is given.
We identify spatial distribution of patent across countries in terms of assignee code, and try to highlight the relative development trends among high-tech countries by using data of assignee code too. Thus, assignee code Fig. 3a. The S-curve concept of a technological life cycle by cumulative patent count. (Note: Modified based on
Ernst, 1997 [30].)
Fig. 3b. Technological life cycle of carbon capture by cumulative patent count. (Data Source: Derwent Innovations Index Database, 2016.)
should be discussed in front. The wide range of company name variations that can exist in any patent database is a documented problem. Between misspellings, transliterations from other languages, and abbreviations for common words (such as “Co.” for “Company” or “Ltd” for “Limited”), many different versions of a company name can be recorded in a patent database, and this can hamper accurate keyword retrieval [31]. Luckily, Derwent indexers address this problem by using assignee code. Every patentee in DII has one assignee code. An assignee code usually contains many patentee names. Patentee names that are contained in one assignee code always have relationships to each other in many cases, such as belonging to a same company, company merger and restructuring, even misspelling of name. Consequently, when we try to survey the innovational level of a company in DII, we extract patents by assignee code, then we won’t exclude valid data or include invalid data. DII is the only patent database that include assignee code. It is an important reason that we choose DII as patent data source in this study.
4.1.Spatial distribution of technology
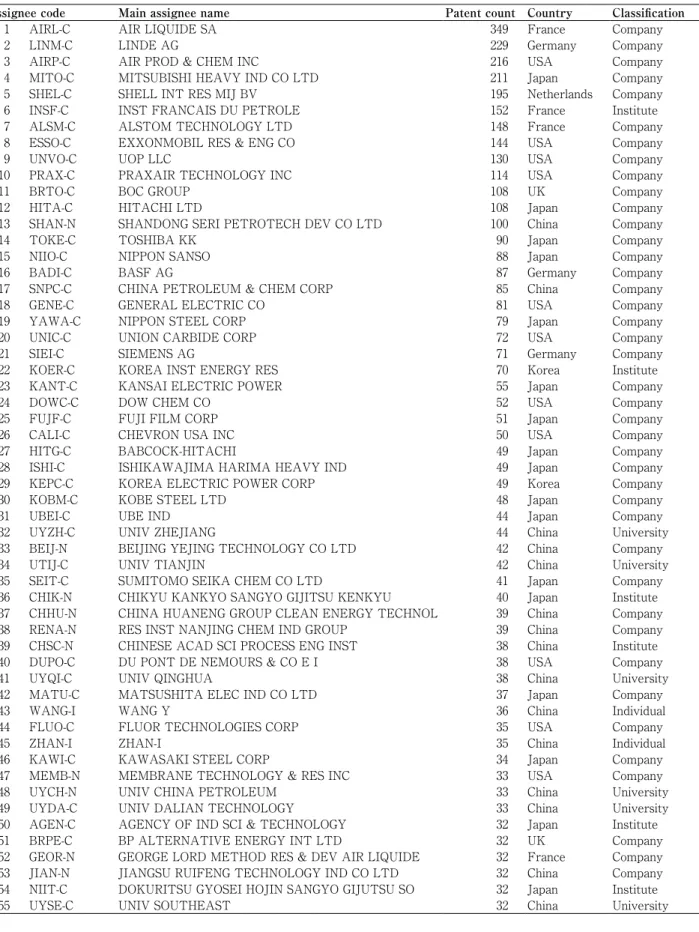
We extract data of assignee codes in carbon capture patent database set. For a more clear and valid result, we choose top 50 assignee codes from total 4613 codes (see Table 3). Those top 50 assignee codes own 4232 patent files together, account for 42.97% of all 9847 patent files. Top 50 assignees include most of influential companies, institutes and universities in carbon capture technology in the world. In addition, because of 6 assignee codes tying in 50th,
there are fifty-five assignee codes in top 50.
Fig. 4a shows that top 50 assignee codes and 4232 patents are concentrated in eight countries ― Japan, USA, France, China, Germany, Netherlands, UK and Korea in order from most to fewer. First, East Asia, EU and North America have most of patents in the world, comparing the economic vitalities in these areas. China is the only developing country in these areas, whose patent count is increasing quickly in last 5 years. Second, the performance of Japan is particular impressive as it ranks first both in patent count and assignee code count. Nevertheless, inventors from EU have more patents in average. Each inventor in Netherlands has 195 patents, in France has 170 and in Germany has 129. On the other hand, each inventor from USA, UK, Japan, Korea and China has 88, 70, 64, 60 and 45 patents. Third, countries in East Asia and France have more non-business assignees such as universities, institutes and individuals. 59% of patent files in Korea, 50% in China, 22% in France and 10% in Japan are contributed by non-business inventors. This status highlights the fundamental role of research-based organizations who achieve financial assistances from governments in these countries.
Table 3 Basic Information of Top 50 Assignee Codes. (Note: Totally 55 assignee codes because of 6 tying in 50th. Data Source: Derwent Innovations Index Database, 2016.)
Assignee code Main assignee name Patent count Country Classification
1 AIRL-C AIR LIQUIDE SA 349 France Company
2 LINM-C LINDE AG 229 Germany Company
3 AIRP-C AIR PROD & CHEM INC 216 USA Company
4 MITO-C MITSUBISHI HEAVY IND CO LTD 211 Japan Company
5 SHEL-C SHELL INT RES MIJ BV 195 Netherlands Company
6 INSF-C INST FRANCAIS DU PETROLE 152 France Institute
7 ALSM-C ALSTOM TECHNOLOGY LTD 148 France Company
8 ESSO-C EXXONMOBIL RES & ENG CO 144 USA Company
9 UNVO-C UOP LLC 130 USA Company
10 PRAX-C PRAXAIR TECHNOLOGY INC 114 USA Company
11 BRTO-C BOC GROUP 108 UK Company
12 HITA-C HITACHI LTD 108 Japan Company
13 SHAN-N SHANDONG SERI PETROTECH DEV CO LTD 100 China Company
14 TOKE-C TOSHIBA KK 90 Japan Company
15 NIIO-C NIPPON SANSO 88 Japan Company
16 BADI-C BASF AG 87 Germany Company
17 SNPC-C CHINA PETROLEUM & CHEM CORP 85 China Company
18 GENE-C GENERAL ELECTRIC CO 81 USA Company
19 YAWA-C NIPPON STEEL CORP 79 Japan Company
20 UNIC-C UNION CARBIDE CORP 72 USA Company
21 SIEI-C SIEMENS AG 71 Germany Company
22 KOER-C KOREA INST ENERGY RES 70 Korea Institute
23 KANT-C KANSAI ELECTRIC POWER 55 Japan Company
24 DOWC-C DOW CHEM CO 52 USA Company
25 FUJF-C FUJI FILM CORP 51 Japan Company
26 CALI-C CHEVRON USA INC 50 USA Company
27 HITG-C BABCOCK-HITACHI 49 Japan Company
28 ISHI-C ISHIKAWAJIMA HARIMA HEAVY IND 49 Japan Company
29 KEPC-C KOREA ELECTRIC POWER CORP 49 Korea Company
30 KOBM-C KOBE STEEL LTD 48 Japan Company
31 UBEI-C UBE IND 44 Japan Company
32 UYZH-C UNIV ZHEJIANG 44 China University
33 BEIJ-N BEIJING YEJING TECHNOLOGY CO LTD 42 China Company
34 UTIJ-C UNIV TIANJIN 42 China University
35 SEIT-C SUMITOMO SEIKA CHEM CO LTD 41 Japan Company
36 CHIK-N CHIKYU KANKYO SANGYO GIJITSU KENKYU 40 Japan Institute
37 CHHU-N CHINA HUANENG GROUP CLEAN ENERGY TECHNOL 39 China Company
38 RENA-N RES INST NANJING CHEM IND GROUP 39 China Company
39 CHSC-N CHINESE ACAD SCI PROCESS ENG INST 38 China Institute
40 DUPO-C DU PONT DE NEMOURS & CO E I 38 USA Company
41 UYQI-C UNIV QINGHUA 38 China University
42 MATU-C MATSUSHITA ELEC IND CO LTD 37 Japan Company
43 WANG-I WANG Y 36 China Individual
44 FLUO-C FLUOR TECHNOLOGIES CORP 35 USA Company
45 ZHAN-I ZHAN-I 35 China Individual
46 KAWI-C KAWASAKI STEEL CORP 34 Japan Company
47 MEMB-N MEMBRANE TECHNOLOGY & RES INC 33 USA Company
48 UYCH-N UNIV CHINA PETROLEUM 33 China University
49 UYDA-C UNIV DALIAN TECHNOLOGY 33 China University
50 AGEN-C AGENCY OF IND SCI & TECHNOLOGY 32 Japan Institute
51 BRPE-C BP ALTERNATIVE ENERGY INT LTD 32 UK Company
52 GEOR-N GEORGE LORD METHOD RES & DEV AIR LIQUIDE 32 France Company
53 JIAN-N JIANGSU RUIFENG TECHNOLOGY IND CO LTD 32 China Company
54 NIIT-C DOKURITSU GYOSEI HOJIN SANGYO GIJUTSU SO 32 Japan Institute
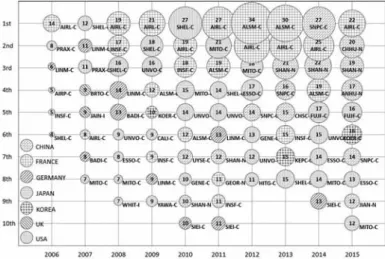
4.2.Rank changing in top 10 assignee codes
For trying to highlight the relative trends across major high-tech countries, we examine the top 10 assignee codes in last 10 years in terms of country. As noted in the previous, Japan, USA, France, China, Germany, UK and Korea have more patents than other countries. Thus, companies or institutes from these countries are consequently involved in top 10 assignee codes.
About Fig. 5a and 5b, the y-axis reports ranking of top 10 assignee codes by year. Fig. 5b is based on Fig. 5a, presenting the trends more visually by some arrows that represent countries. First, it is very impressive that French companies occupied in 1st and 2nd mostly, such as Alstom (ALSM-C) and Air Liquide (AIRL-C) topped the list
for seven times in ten years together. Second, Chinese companies emerged frequently since 2013, notably topped in 2014 (China Sinopec) and arranged from 2nd to 4th in 2015 (China Huaneng, Shanghai Longking and Anhui Huaertai).
It seems that inventors from China will apply more patent files in years. Third, ranks of companies from Japan, USA and Germany are lower than before, mainly due to initiatives of Chinese companies.
Fig. 5a. Top 10 assignee codes in 10 years, five-letter code presents assignee code, number in bubble presents patent count, bubble dimension represents the patent count belong to assignee code.
Fig. 5b. Top 10 assignee codes in 10 years and trends of countries, a bubble with capital letter represents an assignee code, capital letter in bubble represent country that own this assignee code, bubble dimension represents the patent count belong to assignee code, an arrow presents the relative development trend of country whose name is signed in arrow. (Note: Because of tied codes, assignee codes in last ranks were
5.Conclusion
Carbon dioxide is an inert gas that has no heating value of combustion and it is an environmental concern since it is the major greenhouse gas. Varied technologies have been developed for CO2 capture. This study adopts 6 patent
indicators and quantifies spatial-temporal distribution of carbon capture technology.
First, we speculate that “Good Time” of carbon capture technology is coming. As count of authorized patents keeps increasing rapidly since 2006, the technology life cycle of carbon capture is or will be soon in growth stage. If ever there will be time for R&D activities in carbon capture technology to come to the frontlines and provide leadership to solve problems in CCS projects, that time is now.
Second, more carbon capture patents are concentrated in few countries, Japan, USA, France, China, Germany, etc., but CCS projects are needed in much more counties. Patents are private properties belong to patentees. But environment is the public goods of the World. As private properties, companies and institutes won’t transfer technologies for free, even technologies can promote carbon emission. As public goods, companies lack simulation in buying technologies from ones who owned them. Closing the gap between CCS rhetoric and technical progress is critically important to global climate mitigation efforts. Developing strong international cooperation on CCS demonstration with global coordination, transparency, cost-sharing and communication as guiding principles would facilitate efficient and cost-effective collaborative global learning on CCS. Therefore, organizations, countries and companies should set up a mechanism for environment friendly technologies cooperation. This mechanism will balance well on economic benefit and environmental benefits.
Third, in the view of innovation, carbon capture technologies is vital to make CCS viable. However, in the view of commercialization, CCS project operation is impeded by some limitations, including CO2 sources and geological
conditions. From former studies [5,8,10,32], limitations also include lack of policy and economic drivers, restrictions from local laws and international conventions, environmental concerns on carbon escape from storage, etc. Therefore, high-tech is not the sufficient condition of a CCS project. For example, many so-called low-tech but oil-rich countries should be stimulated to develop more CO2-EOR (enhanced oil recovery) projects. More CCS projects should be
operated as soon as possible in countries like USA and China, the biggest developed and developing country. Each of them owns more carbon capture patents, is oil (gas) producing countries, depends heavily on coal as a fuel, and has vast territories and waters that make it possible to find more appropriate geologic formations.
This study also has some limitations that should be acknowledged. First, we give a review by means of patent count, but some biases exist due to patent count do not represent the whole portfolio of patent analysis. Second, there can be some biases in cross-country comparisons by top 50 or top 10 assignee codes rather than all assignees. Third, we can’t give deeply discussion on e.g., international technology diffusion due to insufficiency of research methods. In addition to address these limitations, further study will place more emphasis on the method of patent bibliometrics (e.g., citation analysis) by using visualizing and analyzing software. We’d like to provide a wider scale discussion and a precise analysis, characterize technology spillover and diffusion across countries, and present suggestions of CCS development for organizations, governments, innovators and firms.
References
[ 1 ] WMO. WMO Statement on the Status of the Global Climate in 2015. 2016.
[ 2 ] IPCC. Climate Change 2007 Synthesis Report. 2008. doi:10.1256/004316502320517344.
[ 3 ] Socolow RH, Pacala SW. A plan to keep carbon in check. Sci Am 2006;295:50–7. doi:10.1038/scientificamerican0906-50. [ 4 ] IEA. Energy Technology Perspectives 2012. 2012.
[ 5 ] IEA. Carbon Capture and Storage Technology Roadmap (2013 Edition), 2013.
[ 6 ] Ministry of Science and Technology (China). Technology roadmap study on carbon capture, utilization and storage in China. 2012.
[ 7 ] Rubin ES, Mantripragada H, Marks A, Versteeg P, Kitchin J. The outlook for improved carbon capture technology. Prog Energy Combust Sci 2012;38:630–71. doi:10.1016/j.pecs.2012.03.003.
[ 8 ] Leo MeyerMetz B, Davidson O, Coninck H de, Loos M, Meyer L. IPCC Special Report on Carbon Dioxide Capture and Storage. 2005.
[ 9 ] van Alphen K, Hekkert MP, Turkenburg WC. Accelerating the deployment of carbon capture and storage technologies by strengthening the innovation system. Int J Greenh Gas Control 2010;4:396–409. doi:10.1016/j.ijggc.2009.09.019.
[10] Quintella CM, Hatimondi SA, Musse APS, Miyazaki SF, Cerqueira GS, De Araujo Moreira A. CO2 capture technologies: An overview with technology assessment based on patents and articles. Energy Procedia 2011;4:2050–7. doi:10.1016/ j.egypro.2011.02.087.
[11] Xuemei W, Jingjing Z, Jiansheng Q. Patent Analysis on the International Carbon Capture and Storage Technologies. Sci Focus 2010;Vol.5 No.4. doi:10.15978/j.cnki.1673-5668.2010.04.003.
[12] Hong M, Wei Z, Lucheng H. Research on Carbon Capture and Storage Technology Development Based on Patent Citation. J Intell 2013;32.
[13] OECD. Main Science and Technology Indicators. 2016.
[14] Griliches Z. Patent Statistics as Economic Indicators: A Survey. vol. 28. 1990. doi:10.1016/S0169-7218(10)02009-5.
[15] Oltra V, Kemp R, Vries FP De. Patents as a measure for eco-innovation. Int J Environ Technol Manag 2010;13:130. doi:10.1504/ IJETM.2010.034303.
[16] Acs ZJ, Anselin L, Varga A. Patents and innovation counts as measures of regional production of new knowledge. Res Policy 2002;31:1069–85. doi:10.1016/S0048-7333(01)00184-6.
[17] Johnstone N, Hascic I, Popp D. Renewable energy policies and technological innovation: Evidence based on patent counts. Environ Resour Econ 2010;45:133–55. doi:10.1007/s10640-009-9309-1.
[18] OECD. Climate Policy and Technological Innovation and Transfer: An Overview of Trends and Recent Empirical Results. 2010. [19] Liu JS, Kuan CH, Cha SC, Chuang WL, Gau GJ, Jeng JY. Photovoltaic technology development: A perspective from patent
growth analysis. Sol Energy Mater Sol Cells 2011;95:3130–6. doi:10.1016/j.solmat.2011.07.002.
[20] Leu HJ, Wu CC, Lin CY. Technology exploration and forecasting of biofuels and biohydrogen energy from patent analysis. Int J Hydrogen Energy 2012;37:15719–25. doi:10.1016/j.ijhydene.2012.04.143.
[21] UKIPO. Eight Great Technologies Energy Storage - A Patent View. 2014.
[22] Albino V, Ardito L, Dangelico RM, Messeni Petruzzelli A. Understanding the development trends of low-carbon energy technologies: A patent analysis. Appl Energy 2014;135:836–54. doi:10.1016/j.apenergy.2014.08.012.
[23] Park JY. The evolution of waste into a resource: Examining innovation in technologies reusing coal combustion by-products using patent data. Res Policy 2014;43:1816–26. doi:10.1016/j.respol.2014.06.002.
[24] Dechezlepretre A, Glachant M, Hascic I, Johnstone N, Meniere Y. Invention and transfer of climate change mitigation technologies on a global scale: a study drawing on patent data. 2009.
[25] WIPO. Patent-based Technology Analysis Report–Alternative Energy Technology. 2009.
[26] Li B, Duan Y, Luebke D, Morreale B. Advances in CO2 capture technology: A patent review. Appl Energy 2013;102:1439–47. doi:10.1016/j.apenergy.2012.09.009.
[27] Wei Z, Man Z. CO2 Capture Situation Analysis Based on Patents and Articles. Sci Technol Manag Res 2014.
[28] Torp TA, Gale J. Demonstrating storage of CO2 in geological reservoirs: The Sleipner and SACS projects. Energy 2004;29:1361– 9. doi:10.1016/j.energy.2004.03.104.
[29] Arthur D. Little. The strategic Management of Technology. Eur. Manag. Forum, Davos: 1981.
[30] Ernst H. The Use of Patent Data for Technological Forecasting: The Diffusion of CNC-Technology in the Machine Tool Industry. Small Bus Econ 1997;9:361–81. doi:10.1023/A:1007921808138.
[31] Intellogist. Report:Derwent World Patents Index/File Data n.d. http://www.intellogist.com/wiki/Report:Derwent_World_ Patents_Index/Special_Indexing/Derwent_Assignee_Codes.
[32] Ying F, Lei Z, Xiaobing Z. An Analysis on Carbon Capture and Storage Technology, Regulations and Its Emission Reduction Potential. Adv Clim Chang Res 2010;6:362–9.
![Fig. 1. Carbon capture and storage (CCS) chain. (Note: Modified based on Rubin et al., 2012 [7] and IEA, 2013 [5].)](https://thumb-ap.123doks.com/thumbv2/123deta/6639257.1141227/2.892.225.715.1008.1093/carbon-capture-storage-chain-note-modif-based-rubin.webp)