九州大学学術情報リポジトリ
Kyushu University Institutional Repository
高速液体クロマトグラフィーを用いた尿中サルコシ ンの高感度測定法
立石, 多貴子
https://doi.org/10.15017/1931770
出版情報:Kyushu University, 2017, 博士(保健学), 課程博士 バージョン:
権利関係:
Preliminary study of a high-sensitivity method to determine sarcosine in urine using
high-performance liquid chromatography
Takiko Tateishi1, 2, Yuki Matsuba3, Kasumi Shimokawa4, Maiko Kawahara5, Miki Kawano1,
6, Yuki Tanaka7, Masahiro Manabe7, Masanori Okuma7, Katsuyoshi Ikeda7, Hirotaka
Matsui7, Eisaku Hokazono8, and Yuzo Kayamori8*
1Department of Health Sciences, Graduate School of Medical Sciences, Kyushu University;
3-1-1, Maidashi, Higashi-ku, Fukuoka 812-8582, Japan
2Department of Medical Laboratory Science, Junshin Gakuen University; 1-1-1,
Chikushigaoka, Minami-ku, Fukuoka 815-8510, Japan
3 Department of Clinical Laboratory, Miyazaki Prefectural Miyazaki Hospital; 5-30
Kitatakamatsu-cho, Miyazaki-shi, Miyazaki 880-8510, Japan.
4 Department of Health Sciences, School of Medicine, Kyushu University; 3-1-1, Maidashi,
Higashi-ku, Fukuoka 812-8582, Japan
5 Sanyo Osteoporosis Research Foundation Okamoto Clinic; 1-3-15 Maki, Ohita-shi, Ohita
870-0924, Japan.
6School of Health Sciences at Narita, International University of Health and Welfare; 4-3,
Kozunomori, Narita-shi, Chiba, 286-8686, Japan
7 Department of Laboratory Medicine, Kumamoto University Hospital, 1-1-1 Honjo, Chuo-
ku, Kumamoto 860-8556, Japan
8Department of Health Sciences, Faculty of Medical Sciences, Kyushu University; 3-1-1,
Maidashi, Higashi-ku, Fukuoka 812-8582, Japan
1 Summary
In recent years, urinary sarcosine has emerged as an early detection marker for prostate cancer
because it is found in increased levels in the urine of prostate cancer patients and exhibits better
sensitivity and specificity in the receiver operating characteristic (ROC) curve than prostate-
specific antigen (PSA). Sarcosine in urine can be analyzed using various methods that are
complicated, time-consuming, and expensive.
Herein, we have developed a method for determining urinary sarcosine using high-
performance liquid chromatography (HPLC) with NBD-F (4-fluoro-7-nitrobenzofurazan), a
fluorescent derivatizing agent for amines.
Using this method with a C18 column and gradient elution, we obtained a single peak at a
retention time of 8.37 min using an aqueous solution of derivatized sarcosine. We confirmed
this peak assignment was accurate by observing disappearance of the peak after adding
sarcosine oxidase (SOD), which decomposes sarcosine to a urine sample spiked with sarcosine
solution.
2
Linearity was obtained in the sarcosine concentration range of 0–100 μmol/L. The
average ratio of sarcosine peak area to internal standard peak area was 12.95 using a 100
μmol/L sarcosine solution (n=14), with a coefficient of variation of 1.42%.
In summary, we have developed a highly sensitive and highly specific fluorescence
method for determining sarcosine in urine by HPLC. Compared with gas
chromatography/mass spectrometry methods, the HPLC method is simpler and allows rapid
analyses.
Keywords: Sarcosine, High-performance liquid chromatography, NBD-F (4-fluoro-7-
nitrobenzofurazan), Sarcosine oxidase, Prostate cancer
3
1. Introduction
In recent years, owing to an increasingly ageing society and westernization of dietary habits,
the number of people suffering from prostate cancer in Japan has increased, exceeding 70,000
in 2012. According to a nationwide estimate1, the incidence rate for prostate cancer ranks fourth
among cancers in male patients, and the prevalence rate (against a population of 100,000) has
increased 26-fold since 1975. Furthermore, according to 2016 statistical cancer predictions, the
number of prostate-related cancers is predicted to increase further2. Early-stage prostate cancer
is hard to diagnose because symptoms develop only once the disease has progressed
considerably. Therefore, by the time the patient experiences symptoms and seeks diagnosis,
successful treatment becomes difficult. As the age of onset is expected to decrease in the future,
early detection and treatment are becoming increasingly important. A highly sensitive method
for the accurate quantification of markers specifically overexpressed in prostate cancer would
be an effective tool for early detection3.
Currently, prostate-specific antigen (PSA) is used as a diagnostic marker for prostate cancer.
However, PSA is a protein specific to prostate tissue and can appear in other prostate diseases,
4
such as benign prostatic hyperplasia and prostatitis. Moreover, PSA levels also increase with
increasing prostate weight4. The specificity of PSA is only approximately 80%, making it
difficult to detect in the early stages of prostate cancer. Furthermore, PSA levels may decrease
during treatment with drugs, including: chlormadinone acetate (Prostal), used to treat benign
prostatic hyperplasia; Finasteride (Propecia), used to treat male pattern alopecia; non-steroidal
anti-inflammatory drugs; statins, used to treat dyslipidemia; and thiazide diuretics, used to treat
hypertension5, 6, 7.
Reference PSA levels are set at 0.0–4.0 ng/mL for all ages, making PSA difficult to
detect in the early stages of prostate cancer. Furthermore, normal PSA levels have been
found in some rare cases of prostate cancer8, 9.
As it has been suggested that accurately diagnose prostate cancer is not possible based on
PSA levels alone, an additional rectal examination is recommended in medical checkups10, 11.
Furthermore, it is necessary to collect blood for serum PSA measurements, which involves
invasive procedures. Additionally, as the method used to determine PSA levels involves
immunological analyses, special reagents are required and the process is time-consuming.
5
Moreover, to determine total PSA from free PSA and PSA bound to α1-antichymotrypsin
and α2-macroglobulin, antibody specificity is required12, 13.
Pro PSA, a PSA precursor that can be determined with even higher sensitivity than PSA,
has recently attracted wide attention and is expected to be useful for early stage detection14, 15.
A study published in Nature recently claimed that sarcosine levels in urine are
significantly higher with prostate cancer16. For PSA levels of 0–20 ng/mL, no significant
differences were reported. However, in the low concentration range of 0–10 ng/mL,
sarcosine showed better sensitivity and specificity in the ROC curve. Furthermore, as urine
was used as the sample, the process was non-invasive.
Sarcosine (N-methyl glycine), an amino acid with a molecular weight of 89 Da, is an
intermediate in the synthesis of glycine and a degradation product in muscle and other
internal tissues.
In healthy people, the glycine-N-methyltransferase (GNMT) gene is expressed in the
nucleus. Sarcosine is synthesized from glycine by stimulating GNMT expression and is
further converted to glycine by sarcosine dehydrogenase (SARDH). In prostate cancer
6
patients, overexpression of the GNMT gene causes excessive production of sarcosine,
resulting in higher sarcosine levels in urine 17. Sarcosine is also known to induce
upregulation of HER2 expression in androgen-dependent prostate cancer cells17, 18.
It has been suggested that sarcosine levels markedly increase as prostate cancer
progresses and that its sensitivity and specificity are better than PSA in the receiver operating
characteristic (ROC) curve. Therefore, urinary sarcosine may be a new early detection
marker for prostate cancer19.
Currently, sarcosine levels in human urine are determined using gas or liquid
chromatography/mass spectrometry (GC/MS and LC/MS, respectively) 20, 21 or fluorescent
antibody methods22. However, these methods are time-consuming, cumbersome, and expensive.
Therefore, in this study, we aimed to establish a method to determine urinary sarcosine
using high-performance liquid chromatography (HPLC) using a fluorescent derivatizing
agent.
7
2. Materials and Methods
2.1 Chemicals
HEPES (2-[4-(2-hydroxyethyl)-1-piperazinyl] ethane sulfonic acid) was purchased
from Dojindo Laboratories (Kumamoto, Japan). Boric acid (JIS special grade) and sodium
tetraborate dehydrate (JIS special grade) were obtained from Wako Pure Chemical Industries,
Ltd (Osaka, Japan). Derivatizing reagent NBD-F (4-fluoro-7-nitrobenzofurazan) was
purchased from Wako Pure Chemical Industries, Ltd (Osaka, Japan). SOD (sarcosine
oxidase, from microorganisms EC 1.5.3.1) was purchased from the Toyobo Biochemical
Department (Osaka, Japan). Acetonitrile (HPLC grade) was obtained from Sigma-Aldrich
Co. LLC (Tokyo, Japan) and methanol (HPLC grade) was purchased from Kanto Chemical
Co. Inc. (Tokyo, Japan). Trifluoroacetic acid (Wako Special Grade), sarcosine (N-
methylglycine, Wako 1st Grade) and 6-aminohexanoic acid (Wako 1st Grade) were
purchased from Wako Pure Chemical Industries, Ltd (Osaka, Japan). Hydrochloric acid
(guaranteed reagent grade) was obtained from Nacalai Tesque, Inc. (Kyoto, Japan).
8 2.2 Principle
Sarcosine, a secondary amine, has no specific absorbance or fluorescence. Therefore,
detecting sarcosine in chromatography requires prior column derivatization with NBD-F (4-
fluoro-7-nitrobenzofurazan), a fluorescent derivatizing agent for amines. Derivatized
sarcosine was detected using a fluorescence detector at 530 nm under 470-nm excitation (Fig.
1).
2.3 HPLC conditions and instrumentation
A Hitachi HPLC system (La Chrom Elite, HPLC, Tokyo, Japan) with an L-2130 pump,
L-2200 autosampler, and L-2480 fluorescence detector, was used. A COSMOSIL 3C18-EB
packed analytical column (4.6 × 250 mm, φ= 3 µm; Nacalai Tesque, Inc. Kyoto, Japan) was
used. A D-51 glass electrode pH meter (Horiba Ltd., Kyoto, Japan), Taitec Thermo Minder
Jr-100 (Taiyo Chemical Industry CO., LTD., Saitama, Japan) and Dry Thermo Unit DTU-
1B (Ditech Corporation) thermostatic baths, an MX-307 micro high-speed refrigerated
centrifuge (Tomy Digital Biology Co., Ltd.), and an 8910 inverter multi-frame cooling
centrifuge (Kubota Seisakusho Co., Ltd.) were also used.
9
As shown in Fig. 2, gradient elution was performed using two eluent solutions, which
were prepared as follows: (a) deionized water and methanol were mixed in a 90:10 (v/v)
ratio and trifluoroacetic acid was added to a final concentration of 0.12% (v/v); (b) methanol
and deionized water were mixed in a 90:10 (v/v) ratio and trifluoroacetic acid was added to
a final concentration of 0.12% (v/v). Fig. 2-a shows the elution of sarcosine and IS, Fig. 2-
b shows the column cleaning stage, and Fig. 2-c shows column equilibration. The
fluorescence of NBD-amino acid was detected at 530 nm under excitation at 470 nm. The
flow rate was 1.0 mL/min, the column thermostat was set at 60 °C, the injection volume was
10 µL, and the interval between measurements was 10 min to allow the column to equilibrate.
2.4 Reagent preparation
The sarcosine stock solution was diluted to various concentrations to obtain standard
solutions for the calibration curve. The 100 μmol/L reference solution was obtained by
performing a 10-fold dilution of the stock solution. For the internal standard (IS) solution,
certified 6-aminohexanoic acid was dissolved in purified water to a concentration of 10
10
mmol/L. This 10 mmol/L IS solution was then diluted 100-fold with purified water to a
concentration of 100 μmol/L.
Urine samples spiked with sarcosine at various concentrations were prepared by mixing the
urine of healthy volunteers with sarcosine standard solutions in a ratio of 9:1 (v/v).
2.5 Sample preparation for HPLC analysis
Deproteinization. After urine samples were centrifuged at 3000 g for 10 min at 4 °C, 90 μL of the upper layer was separated and IS solution (40 μL), acetonitrile (160 µL), and
methanol (160 μL) were added. This mixed solution was vortexed and centrifuged at 3000
g for 10 min to obtain the deproteinized sample in the upper layer.
Derivatization of sarcosine. A 90-μL aliquot of deproteinized sample was transferred
to a screw-capped test tube and evaporated to dryness at 60 °C for 90 min. To this sample
was added borate buffer (162 μL, 0.2 mol/L, pH 8.5) and NBD-F solution (36 μL, 2.5
mmol/L), followed by mixing and incubation at 50 °C for 30 s. After cooling in ice,
11
hydrochloric acid (252 μL, 50 mmol/L) was added to stop the reaction. This final solution
was the sample used for analysis.
2.6 Analytical procedures
Identification of sarcosine and IS peaks using standard solutions. To determine the
retention time of sarcosine and the IS in the chromatogram, we analyzed a sample prepared
according to the procedure described in the “Reagent preparation” section.
Confirmation of the sarcosine peak using a urine sample spiked with sarcosine. To
confirm whether the peak ascribed to sarcosine was correct, sarcosine oxidase (SOD), which
decomposes sarcosine, was added as follows: To a urine sample spiked with sarcosine (50
μL) was added 14.4 kU/L SOD solution (50 μL) and the mixture was incubated at 37 °C for
10 min.
2.7 Method validation
Calibration curve. We analyzed six sarcosine solutions with different concentrations
(0, 20, 40, 60, 80, and 100 μmol/L) and constructed a calibration curve by plotting the ratio
of sarcosine peak area to IS peak area against sarcosine concentration.
12
Recovery. Three pooled urines of known sarcosine concentration were supplemented
with sarcosine, and performed the assay.
Imprecision. We analyzed the 100 μmol/L sarcosine solution for the within-day (n=14)
and between-day imprecision (n=5) and calculated the average value and coefficient of
variation for the ratio of sarcosine peak area to IS peak area.
Limits of detection and quantitation. The limits of detection (LOD) and quantitation
(LOQ) were calculated by determining the mean ratio of the base line area at the retention
time of sarcosine and IS for three measurements using purified water as the sample. The
LOD and LOQ were expressed as three times the signal/noise ratio and ten times the
signal/noise ratio, respectively.
13 3. Results
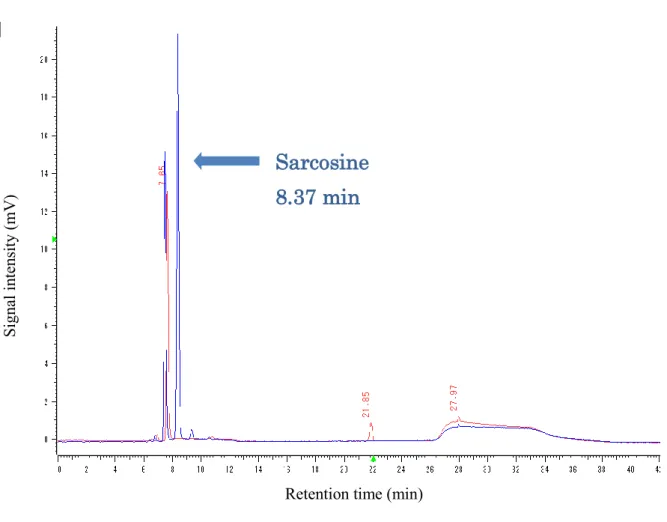
Identification of the sarcosine peak. The chromatogram of the 100 μmol/L sarcosine
solution is shown in Fig. 3. The retention times (RT) of sarcosine and IS were found to be
8.37 and 21.85 min, respectively. Although the retention time shown in Fig. 3 appears to be
8.37 min, we can report that the retention time changed from 8.37 to 8.39 min depending on
the analytical conditions.
Confirmation of the sarcosine peak. Fig. 4 shows chromatograms for before and after
SOD treatment. In the chromatogram of non-treated urine, a peak was present at 8.39 min,
but no peak was detected for the SOD-treated urine sample. Therefore, the peak at 8.39 min
was confirmed to be attributed to sarcosine.
Calculation of results. Quantitative results for the internal standard method were obtained from
the ratio of sarcosine peak area to IS peak area.
Calibration curve. The calibration curve showed good linearity in the sarcosine
concentration range 0–100 μmol/L, with a correlation coefficient of 0.998 (Fig. 5).
14
Recovery. Three urines of known sarcosine concentration (4.44, 2.08, and 22.15
μmol/L) were supplemented with sarcosine (10.0, 25.0, and 50.0 μmol/L), and assayed on
our method. The average analytical recovery of the three concentrations of sarcosine added
to the three urines was 93.5%.
Imprecision. Within-day (n=14) and between-day imprecision (n=5) were determined
by performing measurements on the 100 μmol/L sarcosine solution, which gave an average
ratio of sarcosine peak area to IS peak area of 12.95 and 12.97, with a coefficient of variation
of 1.42% and 3.49%, respectively.
Limits of detection and quantitation. Following the method described above, the LOD
and LOQ were determined as 0.10 μmol/L and 0.33 μmol/L, respectively.
15 4. Discussion
According to metabolomics research, urinary sarcosine is expected to be a marker for
prostate cancer, as it increases considerably during prostate cancer progression. Furthermore,
using urine as the sample presents a non-invasive option to the patient. From a clinical
examination perspective, urinary sarcosine is better than serum PSA, which is widely used
as a screening marker for prostate cancer, both in terms of sensitivity and specificity.
Therefore, in future, urinary sarcosine determination could potentially find clinical
application for the diagnosis of early-stage prostate cancer.
To develop a method for measuring sarcosine levels in urine, we focused on sarcosine as
a secondary amine and used NBD-F as the fluorescent derivatizing agent23. We established
experimental conditions for determining urinary sarcosine levels and performed a method
validation of the developed method.
In prostate cancer patients, the sarcosine concentration in urine is as low as approximately
5 μmol/L16. Therefore, the analytical method must be able to determine trace sarcosine with
high sensitivity. To achieve this, conditions were set for derivatization and HPLC
16
measurements accordingly, with NBD-F concentration, reaction time, and reaction temperature
for derivatization optimized to minimize urine contaminant peaks.
The NBD-F concentration was set at 2.5 mmol/L. NBD-F reacts under weakly alkaline
conditions at 60 °C within 1 min23, but we set reaction conditions to 50 °C for 30 s to reduce
the analysis temperature and time, assuming that sarcosine could react with NBD-F at a
lower temperature and in a shorter time than other substances (data not shown).
Acetonitrile, widely used in HPLC analysis, was initially chosen as the solvent.
Acetonitrile exhibits low absorption, providing decreased noise and higher sensitivity.
Furthermore, many organic compounds are highly soluble in acetonitrile.
However, after treating the sarcosine-spiked urine sample with SOD, using acetonitrile
in the analysis resulted in a peak at a retention time identical to that of the sarcosine peak.
Therefore, we concluded that sarcosine was not adequately separated in acetonitrile, and
methanol was selected as the solvent instead.
Using methanol, the sarcosine peak was adequately separated. As methanol has higher
viscosity, the pressure on the column increased. We examined the flow rate and minimized the
17
pressure on the column by setting the flow rate to 1.0 mL/min, which afforded optimal peak
separation for sarcosine and other substances.
Regarding column temperature, it was possible to reduce the effect of methanol viscosity
by adopting an optimal upper limit of 60 °C.
We selected a gradient elution method and gradually changed the concentration gradient
of the eluents until IS was eluted. Sarcosine separation was improved by reducing the slope of
the concentration gradient near the eluent composition at which sarcosine was eluted.
We increased the slope after sarcosine elution to shorten analysis time. The analytical
conditions are shown in Fig. 3.
The individual peaks for sarcosine and IS were first identified in the aqueous samples. Then,
the chromatograms of SOD-treated and non-treated samples were compared to confirm the peak
attributed to sarcosine in urine (Fig. 4).
As shown in Fig. 4, when urine sample spiked with sarcosine was treated with SOD, the
peak at 8.39 min mostly disappeared, giving and almost the same area as the reference obtained
with purified water. Therefore, this peak was confirmed as the only sarcosine peak.
18
The analysis of biological samples is complicated by the sample composition with content
of both structure analog of sarcosine and inorganic components. Therefore the influence of
urea (16.7 mmol/L), Uric acid (0.59 mmol/L), and creatinine (381 μmol/L) was studied.
None of these components had significant on the retention time of sarcosine (data not shown).
Additionally the influence of glycine, L-proline, and N-ethylglycine was tested due to their
similarity in chemical structure. We found that it was confirmed to be different from
retention time of sarcosine (data not shown).
Furthermore, the calibration curve showed good linearity from 0 to 100 μmol/L with a
correlation coefficient of 0.998, as determined by method validation.
The within-day and between-day coefficient of variation for the ratio of sarcosine peak
area to IS peak area were 1.42% and 3.49%, respectively. These were a good result.
Using this method, sarcosine, which is reportedly found in higher levels in the urine of
prostate cancer patients, was detected as a single peak, allowing its traces to be determined.
In conclusion, a highly sensitive analytical method for determining urinary sarcosine by
HPLC using NBD-F as a fluorescent derivatizing agent was developed and evaluated.
19
Conflicts of interest
The authors declare no conflict of interests.
References
1. Katanoda K, Hori M, Matsuda T, et al.: An updated report on the trends in cancer
incidence and mortality in Japan, 1958–2013 [Jpn]. J Clin Oncol, 45: 390-401, 2015.
2. Katanoda K, Kamo K, Saika K, et al.: Short-term projection of cancer incidence in Japan
using an age-period interaction model with spline smoothing [Jpn]. J Clin Oncol, 44: 36-
41, 2014.
3. Kelly RS, Vander Heiden MG, Giovannucci E and Mucci LA: Metabolomic biomarkers
of prostate cancer: Prediction, diagnosis, progression, prognosis, and recurrence. Cancer
Epidemiol Biomarkers Prev, 25: 887-906, 2016.
4. Stenman UH, Leinonen J, Zhang WM and Finne P: Prostate-specific antigen. Semin Cancer
Biol, 9: 83-93, 1999.
20
5. Fujimoto K, Hirao Y, Masumori N, et al.: Prostate-specific antigen changes as a result of
chlormadinone acetate administration to patients with benign prostatic hyperplasia: a
retrospective multi-institutional study. Int J Urol, 13: 543-549, 2006.
6. España F, Martínez M, Royo M, et al.: Changes in molecular forms of prostate-specific
antigen during treatment with finasteride. BJU Int, 90: 672-677, 2002.
7. Chang SL, Harshman LC and Presti JC Jr.: Impact of common medications on serum total
prostate-specific antigen levels: analysis of the national health and nutrition examination
survey. J Clin Oncol, 28: 3951-3957, 2010.
8. The Committee for Establishment of the Guidelines on Screening for Prostate Cancer and
Japanese Urological Association: Updated Japanese Urological Association Guidelines on
prostate-specific antigen-based screening for prostate cancer in 2010. Int J Urol, 17: 830-
838, 2010.
9. Gann PH, Hennekens CH and Stampfer MJ: A prospective evaluation of plasma
prostate-specific antigen for detection of prostatic cancer. JAMA, 273 : 289-294,
1995.
21
10. Hamashima C, Nakayama T, Sagawa M, Saito H and Sobue T: The Japanese guideline for
prostate cancer screening [Jpn]. J Clin Oncol, 39: 339-351, 2009.
11. Crawford ED, Grubb R 3rd, Black A, et al.: Comorbidity and mortality results from a
randomized prostate cancer screening trial. J Clin Oncol, 29: 355-361, 2011.
12. Stenman UH, Leinonen J, Alfthan H, Rannikko S, Tuhkanen K, Alfthan O: A complex
between prostate-specific antigen and alpha 1-antichymotrypsin is the major form of
prostate-specific antigen in serum of patients with prostatic cancer: assay of the complex
improves clinical sensitivity for cancer. Cancer Res, 51: 222-226, 1991.
13. Lilja H, Christensson A, Dahlén U, et al.: Prostate-specific antigen in serum occurs
predominantly in complex with alpha 1-antichymotrypsin. Clin Chem, 37: 1618-1625,
1991.
14. Khan MA and Partin AW: Evolving role of pro-PSA as a new serum marker for the early
detection of prostate cancer. Rev Urol, 4: 198-200, 2002.
22
15. Mikolajczyk SD, Catalona WJ, Evans CL, et al.: Proenzyme forms of prostate-specific
antigen in serum improve the detection of prostate cancer. Clin Chem, 50: 1017-1025, 2004.
16. Sreekumar A, Poisson LM, Rajendiran TM, et al.: Metabolomic profiles delineate potential
role for sarcosine in prostate cancer progression. Nature, 457 (7231): 910-914, 2009.
17. Cernei N, Heger Z, Gumulec J, et al.: Sarcosine as a potential prostate cancer biomarker-a
review. Int. J. Mol. Sci, 14: 13893-13908, 2013.
18. Dahl M, Bouchelouche P, Kramer-Marek G, Capala J, Nordling J and Bouchelouche K:
Sarcosine induces increase in HER2/neu expression in androgen-dependent prostate
cancer cells. Mol Biol Rep, 38: 4237-4243, 2011.
19. Jentzmik F, Stephan C, Miller K, et al.: Sarcosine in urine after digital rectal examination
fails as a marker in prostate cancer detection and identification of aggressive tumors.
Eur Urol, 58: 12-18, 2010.
20. Bohm L, Serafin AM, Fernandez P, Van der Watt G, Bouic P J D and Harvey J: Plasma
sarcosine does not distinguish early and advanced stages of prostate cancer. S Afr Med J,
102: 677-679, 2012.
23
21. Meyer TE, Fox SD, Issaq HJ, et al.: A reproducible and high-throughput HPLC/MS
method to separate sarcosine from α- and β-alanine and to quantify sarcosine in human
serum and urine. Anal Chem, 83: 5735-5740, 2011.
22. Heger Z, Cernei N, Krizkova S, et al.: Paramagnetic nanoparticles as a platform for
FRET-based sarcosine picomolar detection. Sci Rep, 5: 1-7, 2015. DOI:
10.1038/srep08868.
23. Watanabe Y and Imai K: Sensitive detection of amino acids in human serum and dried
blood disc of 3 mm diameter for diagnosis of inborn errors of metabolism. J Chromatogr,
309: 279-286, 1984.
24 Urinary sarcosine Derivatizing agent
NBD-F*
Product λex: 470 nm λem: 530 nm
* NBD-F: 4-fluoro-7-nitrobenzofurazan
Fig.1. Derivatization of sarcosine with a fluorescent agent.
25
Fig. 2. Elution conditions.
* a. Elution of sarcosine and IS, b. column cleaning, c. column equilibration.
0 10 20 30 40 50 60 70 80 100 90
0 10 20 30 40
Percentage occupied by eluents A and B (%)
Retention time (min)
溶離液A 溶離液B
*a *b *c
Eluent A
Eluent B
26
Fig. 3. Chromatogram of a 100 μmol/L sarcosine solution .
Red chromatogram: purified water (with IS). Blue chromatogram: 100 μmol/L sarcosine
aqueous solution (without IS).
Retention time (min)
Sarcosine 8.37 min
Signal intensity (mV)
27
Fig. 4. Comparison of chromatograms of SOD-treated and non-treated urine
samples.
The urine sample was spiked with a 100 μmol/L sarcosine solution.
Red chromatogram corresponds to urine sample treated with sarcosine oxidase (SOD); blue
chromatogram corresponds to a non-treated urine sample.
non-treated urine
SOD-treated urine Retention time (min)
Signal intensity (mV)
28
Fig. 5. Calibration curve for the sarcosine determination.
Y-axis represents the ratio of sarcosine peak area to IS peak area; x-axis represents the
sarcosine concentration.
0 2 4 6 8 10 12 14 16
0 20 40 60 80 100
Sarcosine / IS peak area ratio
Sarcosine concentration (μmol/L) r = 0.998