九州大学学術情報リポジトリ
Kyushu University Institutional Repository
高圧ねじり変形加工による高強度材開発に関する研 究
李, 昇原
九州大学大学院工学府
https://doi.org/10.15017/22006
出版情報:Kyushu University, 2011, 博士(工学), 課程博士 バージョン:
権利関係:
Production of High Strength Materials Using High-Pressure Torsion
By
Seungwon LEE
Under Supervision of:
Professor Zenji Horita
January 2012
Contents
Chapter 1. Introduction
1.1. Background………...1
1.1.1. Severe plastic deformation (SPD)………1
1.1.2. High-pressure torsion (HPT)………....5
1.1.3. Strengthening of metals………...………6
1.1.4. Strengthening due to both grain refinement and fine precipitation…...14
1.2. Objective of thesis ………..………….17
References………...17
Chapter 2. Production of ultrafine structured refractory metals by high-pressure torsion 2.1. Production of ultrafine structured group V metals in periodic table by high-pressure torsion ………..20
2.1.1. Introduction………20
2.1.2. Experimental materials and procedures……….……….21
2.1.3. Results and discussions…...………24
2.1.4. Summary and conclusions………..………31
References……….……..40
2.2. Production of ultrafine structured group VI metals in periodic table by high- pressure torsion………....42
2.2.1. Introduction………42
2.2.2. Experimental materials and procedures………..……43
2.2.3. Results and discussions ……….………46
2.2.4. Summary and conclusions………..64
References………...65
Chapter 3. Simultaneous strengthening of Al alloys through grain refinement and fine precipitation using high-pressure torsion and subsequent aging 3.1. Enhancement of strength and ductility of Al-Ag alloys processed by high-pressure torsion and aging……….………....68
3.1.1. Introduction………...……….68
3.1.2. Experimental materials and procedures………..69
3.1.3. Results and discussions ……….73
3.1.4. Summary and conclusions………...94
References………...………94
3.2. Age-hardening of Al-Li-Cu-Mg alloy (2091) processed by high-pressure torsion……....……….………….………96
3.2.1. Introduction………96
3.2.2. Experimental materials and procedures………..97
3.2.3. Results and discussions ………...………100
3.2.4. Summary and conclusions………113
References……….……….117
Chapter 4. Aging behavior of ultrafine structured Fe-50at%Ni alloy after processing by high-pressure torsion
4.1. Introduction……….119
4.2. Experimental materials and procedures…..……….119
4.3. Results and discussions ………..121
4.4. Summary and conclusions………...………128
References………...………..128
Chapter 5. Summary ………130
Acknowledgements
Certificate
The undersigned reviewing committee members hereby certify that Seungwon LEE defended his thesis entitled “Production of high strength materials using high- pressure torsion” on February, 2012 and the thesis was accepted in fulfillment of the requirement for the degree of Doctor of Engineering at Kyushu University.
Zenji HORITA
(Professor, Faculty of Engineering, Kyushu University)
Minoru NISHIDA
(Professor, Faculty of Engineering Sciences, Kyushu University)
Kenji MATSUDA
(Professor, Faculty of Engineering, University of Toyama)
Chapter 1. Introduction
1.1. Background
1.1.1. Severe plastic deformation (SPD)
There are several important methods for improving mechanical properties of material for example, work hardening, grain refinement, solid solution hardening and precipitation hardening. Among them, grain refinement is well defined by Hall-Petch equation [1, 2]
(1.1)
where σ is the yield strength, d is the average grain diameter, and σ0 and k are constants that depend on the material. However, at very small grain sizes, it is clear that exceptional properties would be expected if this relation continues to hold. Because of this potential, researchers have tried to make materials with as smaller grain size as possible. Early researches were based on traditional thermo-mechanical processing, i.e., heavy cold work followed by low-temperature recrystallization heat treatments.
Two decades ago, bulk ultrafine/ nano structured materials started to research by methods of severe plastic deformation (SPD). The SPD process is very attractive and interesting method to specialists who are in the field of materials science because of their powerful ability to generate ultrafine/nano sized grains [3].
The materials which are processed with SPD methods can be compared with conventional methods, where intense strain is imposed by the SPD process without any
significant change in the overall dimensions of the sample. Several methods were developed for the SPD process, which mainly include equal-channel angular pressing (ECAP), accumulative roll-bonding (ARB), and high-pressure torsion (HPT) and they are at present the most developed SPD processing techniques.
The method of ECAP was introduced by Segal et al. [4] in 1981 as illustrated in Fig. 1.1, it is designed to impose shear stress into billets. During ECAP processing, a billet is multiple pressed through a special die using an ECAP facility in which the angle of intersection of two channels is usually 90o. During repetitive processing, billet is deformed with shear introduced by die angle. Equivalent strain can be calculated by the following equation [5].
(1.2)
where N is the number of passes through the die, Φ is the angle between the two parts of the channel and Ψ is the angle for the outer arc of curvature. For the channel angle φ = 90° and a corner angle approximately ψ = 20°, the equivalent strain for each pass subjected to each specimen is about 1.05 [4].
ARB was developed by Saito et al. in 1998. The principle of the ARB process is schematically illustrated in Fig. 1.2. The ARB is a kind of SPD process using rolling deformation. In the ARB process, for example, a 2mm thick sheet is first rolled by 50%
reduction in thickness.
Figure 1.1. Schematic illustration for ECAP process [4].
Figure 1.2. Schematic illustration for ARB process [6].
The rolled sheets are cut into two halves, stacked to obtain the initial dimensions and then rolled again. The equivalent strain after n cycles of the ARB can be expressed as [6]
(1.3)
where t0, t, and r are initial thickness of the stacked sheets, the thickness after roll- bonding, and the reduction in thickness per cycle, respectively. When 1mm thickness samples are subjected to ARB process, equivalent strain can be described with 0.8n [6].
1.1.2. High-pressure torsion (HPT)
Basic concept of HPT process was introduced first by Bridgman in 1935 [7], as illustrated in Fig. 1.3(a). It was designed to introduce large strain into disk samples. A small thin disk is put between two hardened steel anvils and shear strain is introduced by rotating the two anvils with respect to each other. In order to achieve high pressures, a modified facility is usually used for HPT [8]. As illustrated in Fig.1.4, the modified facility consists of massive upper and lower anvils having a shallow flat-bottomed hole at the center. A small thin disk is placed in the shallow hole of the lower anvil and the lower anvil is raised to contact the upper. A high hydrostatic pressure is applied to the sample and intense shear strain is introduced by rotating the lower anvil with respect to the upper anvil. Here, the equivalent strain is given by [9]
(1.4)
where r is the distance from the disk center, N is the number of revolutions and t is the thickness of the disk. Figure 1.5 shows an HPT facility which used for this study and sample after HPT processing. There are some advantages of HPT process compared to other SPD processes.
1) HPT process can produce smaller grains with enhanced mechanical properties because of its extremely large strain.
2) During HPT process, fracture or crack propagation is suppressed because of its high pressure.
3) Material selection for HPT process has less limitation even in hard-to-deform materials such as refractory metals (V, Cr, Nb, Mo [10, 11], W [12], ceramics Al2O3 [13] and intermetallics Ni3Al [14]).
4) The application of HPT process has been extended not only to bulk metals but also to powders [5, 16], composites [17, 18], ceramic powders [19] and Amorphous compounds [20, 21], etc.
Despite these advantages, HPT process has one disadvantage in scaling up sample size when compared with other SPD processes. Thus some attempts have been conducted to scale up the sample size and developed with new methods such as ring- HPT [22] and continuous HPT [23].
1.1.3. Strengthening of metals
There are four methods of increasing the hardness of metallic materials (i) Work hardening
(ii) Solid-solution hardening, (iii) Precipitation hardening (iv) Grain refinement hardening
Figure 1.3. Schematic illustration of Bridgeman anvil.
Figure 1.4. Schematic illustration for modified HPT facility.
Figure 1.5. HPT facility used in this study (left) and Al sample after HPT processing (right).
Work hardening
The primary species responsible for work hardening are dislocations. Dislocations interact with each other by generating stress fields in the material. The interaction between the stress fields of dislocations can impede dislocation motion by repulsive or attractive interactions. Additionally, if two dislocations cross, dislocation line entanglement occurs, causing the formation of a jog which opposes dislocation motion.
These entanglements and jogs act as pinning points, which oppose dislocation motion.
As both of these processes are more likely to occur when more dislocations are present, there is a correlation between dislocation density and stress flow [24, 25]
(1.5)
where is a constant in the range of 0.3-1.0, G is the shear modulus, b is the Burgers vector, and ρ is the dislocation density. Increasing the dislocation density leads to an increase in the flow stress flow which results in a higher shear stress required to move the dislocations. This process is easily observed while working a material.
Solid solution strengthening
For this strengthening mechanism, solute atoms of one element are added to another, resulting in either substitutional or interstitial point defects in the crystal. The solute atoms cause lattice distortions that impede dislocation motion, increasing the yield stress of the material. Solute atoms have stress fields around them which can interact with those of dislocations. The presence of solute atoms imparts compressive or tensile stresses to the lattice, depending on solute size, which interfere with nearby dislocations, causing the solute atoms to act as potential barriers to dislocation
propagation and/or multiplication. The shear stress required to move dislocations in a material is [26]
(1.6)
where c is the solute concentration and ε is the strain on the material caused by the solute. Increasing the concentration of the solute atoms will increase the yield strength of a material, but there is a limit to the amount of solute that can be added, and one should look at the phase diagram for the material and the alloy to make sure that a second phase is not created. In general, the solid solution strengthening depends on the concentration of the solute atoms, shear modulus of the solute atoms, size of solute atoms, valence of solute atoms (for ionic materials), and the symmetry of the solute stress field.
Precipitation hardening
In most binary systems, alloying more than solidus compositions in the equilibrium phase diagram will cause the formation of a second phase. A fine dispersion of second phase particles can also be created by mechanical or thermal treatments. The fine particles that compose the second phase formed by precipitation through aging act as pinning points to dislocation motion in a similar manner to solutes, though the particles are not necessarily single atoms.
The dislocations in a material can interact with the precipitate atoms in one of two ways in Fig. 1.6. If the precipitate atoms are small, the dislocations would cut through them. As a result, new surfaces, Fig. 1.6, of the particle would be exposed to the matrix
and the particle/matrix interfacial energy would increase. For larger or harder precipitate particles, looping or bowing of the dislocations would occur which results in dislocations getting longer.
Grain refinement
In grain refinement hardening, the grain boundaries act as pinning points impeding further dislocation propagation. Since the lattice structure of adjacent grains differs in orientation, it requires more energy for a dislocation to change directions and move into the adjacent grain. The grain boundary is also much more disordered than inside the grain, which also prevents the dislocations from moving in a continuous slip plane. Impeding this dislocation movement will hinder the onset of plasticity and hence increase the yield strength of the material. Under an applied stress, dislocations are generated by Frank-Read Sources [27]. Dislocations will move through a crystalline lattice until encountering a grain boundary, where the large atomic mismatch between different grains creates a repulsive stress field to oppose continued dislocation motion.
As more dislocations propagate to this boundary, dislocation 'pile up' occurs as dislocations are unable to move past the boundary. Decreasing grain size decreases the amount of possible pile up at the boundary, increasing the amount of applied stress necessary to move a dislocation across a grain boundary.
There is an advantage to adopt grain refinement strengthening when compared to other strengthening methods. Other methods, work hardening, solid solution hardening and precipitation hardening are shown all decrease elongation and toughness, although strength is increased. In contrast, hardening by grain refinement does not have this undesirable effect. The effect of grain size on hardening by grain refinement can be
Figure 1.6. Dislocation interaction with particle.
expressed by the Hall-Petch relationship as given in Eq .1.1.
Strengthening of refractory metals by grain refinement
The metals of groups Va and VIa of the periodic system of elements are commonly called "refractory metals". They are vanadium, niobium and tantalum, and chromium, molybdenum and tungsten. They all have high melting points, Table 1.1, which is why their mechanical properties can be exploited to much higher temperatures than those of the common metals and alloys.
The majority of investigations about SPD process, both experimental and theoretical, have concentrated on metals with face-centered cubic (fcc) structures. In this regard, Al, Cu, Ni and its alloys have received maximum attention owing to the ease in making ultrafine- grain and nanocrystalline structure of these metals [28].
Much less publication can be found on processing and properties of ultrafine- grain and nanocrystalline structured metals with body-centered cubic (bcc) structures. It is well defined that the deformation mechanism and microstructure evolution of Cu, fcc structured, during HPT process [29]. In the case of bcc structured metals, only a few reports are available on processing and testing of ultrafine- grain and nanocrystalline structured Fe before 2004 [12].
The primary reason is believed to be the difficulty in producing fully dense bcc metal. Most representative bcc metals are refractory metals, and are very susceptible to interstitial impurities and their yield strength is usually higher than fcc structured metals, in Fig. 1.7. However, using HPT process, it is possible to produce ultrafine-grain and nanocrystalline structure because of its higher capacity for applying strain and suppressing the crack propagation during pressing when compared to other SPD process.
Table 1.1 Important physical properties and mechanical room-temperature properties of pure refractory metals [30].
Therefore, in the case of refractory metals, more investigation is needed. We will deal with deformation behavior, microstructure evolution and its mechanical properties after HPT process in Chapter. 2.
1.1.4. Strengthening due to both grain refinement and fine precipitation
Grain refinement is an important process to increase the strength of metallic materials. It is also well established that a fine dispersion of precipitate particles during aging enhances the strength of alloys. The general comments are already mentioned in Chapter 1.1.3. However, it is generally difficult to achieve combined effects of both grain refinement and fine dispersion of precipitates. This is because grain refinement to the submicrometer range is not easy in practice in alloys with supersaturated conditions using conventional thermo mechanical treatment. Provided that such a supersaturation is achieved in an ultrafine-grained alloy, another important task is to make fine precipitation within the fine grains by subsequent aging while keeping the grain size small.
The process of severe plastic deformation (SPD) offers a good opportunity for the grain refinement in any type of metallic materials regardless of internal states.
There are a few reports aiming at the combined effects of grain refinement with ECAP process and fine precipitation in age-hardenable alloys [32-39]. However, there is no publication about combining two strengthening methods both grain refinement and precipitation hardening after HPT process. HPT process is powerful method to generate small grains, defects and dislocations which can be used as pathway for diffusion. Post aging behavior after HPT process will be dealt with Chapter. 3.
Figure 1.7. Effect of temperature on yield strength [31].
Figure 1.8. Concept of combining two different strengthening methods.
1.2. Objectives of thesis
HPT process has been applied to a wide range of metals and alloys for its large capacity of applicable strain. It gives a chance to produce ultrafine/ nano structured bcc refractory materials. It is well known that they are hard to deform with conventional deforming methods at room temperature.
Combining two different strengthening methods both grain refinement and precipitation hardening is very interesting field. It is not easy to predict the possibility of combining two methods because of grain coarsening.
In this present investigation, some bcc refractory metals are subjected to HPT process with various conditions. Their mechanical properties and microstructural evolutions are investigated. Age-hardenable alloys, Al-Ag alloy and Al 2091 and FeNi alloy are used to evaluate their annealing behavior after HPT processing.
References
1. E.O. Hall, Proc. Phys. Soc. London Sect. B 64 (1951) 747-753.
2. N.J. Petch, J. Iron Steel Inst. 173 (1953) 25-28.
3. R.Z. Valiev, R.K. Islamgaliev, I.V. Alexandrov, Prog. Mater. Sci. 45 (2000) 103-189.
4. M. Segal, V.I. Reznikov, A.E. Dobyshevskiy, V.I. Kopylov, Russian Metall. 1 (1981) 115-123.
5. Y. Iwahashi, J. Wang, Z. Horita, M. Nemoto, T.G. Langdon, Scripta Mater. 35 (1996) 143-146.
6. Y. Saito, N. Tsuji, H. Utsunomiya, T. Sakai, R.G. Hong. Scripta Mater. 39 (1998) 1221–1227.
7. P.W. Bridgman, Phys. Rev. 48 (1935) 825-847.
8. A. Vorhauer, R. Pippan, Scripta Mater. 51 (2004) 921-925.
9. R.Z. Valiev, Y.V. Ivanisenko, E.F. Rauch, B. Baudelet, Acta Mater. 44 (1996) 4705- 4712.
10. S. Lee, K. Edalati, Z. Horita, Mater. Trans. 51 (2010) 1072-1079 11. S. Lee, Z. Horita, Mater. Trans. 53 (2012) 38-45.
12. Q. Wei, H.T. Zhang, B.E. Schuster, K.T. Ramesh, R.Z. Valiev, L.J. Kecskes, R.J.
Dowding, L. Magness, K. Cho, Acta Mater. 54 (2006) 4079-4089.
13. K. Edalati, Z. Horita, Scripta Mater. 63 (2010) 174-177.
14. A.V. Korznikov, G. Tram, O. Dimitrov, G.F. Korznikova, S.R. Idrisova , Z. Pakiela, Acta Mater. 49 (2001) 663-671.
15. H. Shen, B. Guenther, A.V. Koanikov, R.Z. Valiev, Nunostruct. Mater. 6 (1995) 385-388.
16. R.Z. Valiev, R.S. Mishra, J. Groza, A.K. Mukherjee, Scripta Mater. 34 (1996) 1443- 1448.
17. I.V. Alexandrov, Y.T. Zhu, T.C. Lowe, R.K. Islamgaliev, R.Z. Valiev, Metall.
Mater. Trans. A 29 (1998) 2253-2260.
18. V.V. Stolyarov, Y.T. Zhu, T.C. Lowe, R.K. Islamgaliev, R.Z. Valiev, Mater. Sci.
Eng. A 282 (2000) 78-85.
19. K. Edalati, Z. Horita, Scripta Mater. 63 (2010) 174-177.
20. A.R. Yavari, W.J. Botta, C.A.D. Rodrigues, C. Cardoso, R.Z. Valiev, Scripta Mater.
46 (2002) 711-716.
21. J. Sort, D.C. Ile, A.P. Zhilyaev, A. Concustell, T. Czeppe, M. Stoica, S. Surinach, J.
Eckert, M.D. Baro, Scripta Mater. 50 (2004) 1221-1225.
22. Y. Harai, Y. Ito, Z. Horita, Scripta Mater. 58 (2008) 469-472.
23. K. Edalati, Z. Horita, J. Mater. Sci. 45 (2010) 4578-4582.
24. G.I. Taylor. Proc Roy Soc A145 (1934) 362-387.
25.U.F. Kocks, H. Mecking. Prog Mater Sci, 48 (2003) 171-273.
26. T. Kan, P. Haasen. Mater. Sci. Eng. A 5 (1970) 176-178.
27. W. T. Read Jr., Dislocations in crystals, McGraw-Hill Book Co. Inc., New York, 1953.
28. M.A. Meyers, A. Mishra, D.J. Benson, Prog. Mater. Sci. 51 (2006) 427-556.
29. K. Edalati, T. Fujioka, Z. Horita: Mater. Sci. Eng. A 497 (2008) 168-173.
30. E. Pink, R. Eck, In: Materials Science and Technology 8, Eds. R.W. Cahn, P. Haasen, E.J. Kramer, Ed. K. Matucha, VCH-Verlag, Weinheim-New York (1996) 589-641.
31. L. Northcott, J. Less-Common Metals 3 (1961) 125-148.
32. J.K. Kim, H.G. Jeong, S.I. Hong, Y.S. Kim, W.J. Kim, Scripta Mater. 45 (2001) 901-907.
33. Z. Horita, K. Ohashi, T. Fujita, K. Kaneko, T.G. Langdon, Adv. Mater. 17 (2005) 1599-1602.
34. E. Cerri, P. Leo, Mater. Sci. Eng. Mater. Sci. Eng. A 410–411 (2005) 226-229.
35. K. Ohashi, T. Fujita, K. Kaneko, Z. Horita, T.G. Langdon, Mater. Sci. Eng. A 437 (2006) 240-247.
36. W.J. Kim, J.Y. Wang, Mater. Sci. Eng. A 464 (2007) 23-27.
37. H.J. Roven, M. Liu, J.C. Werenskiold, Mater. Sci. Eng. A 483-484 (2008) 54-58.
38. V. Vidal, Z.R. Zhang, B. Verlinden, J. Mater. Sci. 43 (2008) 7418-7425.
39. T. Radeti, M. Popovi, E. Romhanji, B. Verlinden, Mater. Sci. Eng. A 527 (2010) 634-644.
Chapter 2. Production of ultrafine structured refractory metals by high-pressure torsion
2.1. Production of ultrafine structured group V metals in periodic table by high-pressure torsion
2.1.1. Introduction
Materials with small grain sizes have several advantages over their coarse-grained counterparts because they have higher strength and better ductility. The significance of grain refinement by severe plastic deformation (SPD) was recognized almost 2 decades ago [1]. Several methods were developed for the SPD process, which include equal- channel angular pressing (ECAP), high-pressure torsion (HPT), accumulative roll bonding (ARB), multi directional forging (MDF), cyclic extrusion and compression (CEC) and repetitive corrugation and strengthening (RCS) [2]. In particular, the HPT process produces grain sizes finer than the other processes [3] and it is possible to apply to hard materials and powder consolidation without heating process [4, 5]. The principle of the HPT processing is that the sample, in the form of a disk or a ring, is placed between two anvils which are rotated with respect to each other under application of compressive pressure, P, of several GPa to create a torsional strain in the sample [6].
Using the HPT process, researches were conducted on many face-centered cubic (fcc) metals and alloys [7, 8] including hexagonal-closed packed (hcp) metals and alloys [9].
However, except for Fe and its alloys, there are few researches on body-centered cubic (bcc) metals and alloys and thus, it should be worth investigating grain refinement
behavior of bcc structure materials using the HPT process.
There are twelve kinds of bcc metals according to periodic table. Among them, it is possible to apply practically the HPT process to 7 metals such as V23, Cr24, Fe26, Nb41, Mo42, Ta73 and W74 in 5, 6 groups and 4, 5, 6 periods on the periodic table. For the other 5 bcc metals such as Na11, K19, Rb37, Cs55 and Ba56, it is not easy to apply the HPT process because they have low melting points and are susceptible to oxidation at room temperature. Although many reports are available for Fe [10-13], very limited applications have been reported on the bcc metals using the HPT process [14-19]. In this research, three bcc refractory metals in 5 group, V23, Nb41, and Ta73, are selected.
2.1.2. Experimental materials and procedures
The materials used in this research were high purity V (99.9%), Nb (99.9%) and Ta (99.9%). They were purchased in a form of 10×10×1 mm3 chips and these chips were rolled down to a thickness of 0.85 mm. Disks of 0.85mm thickness and 10 mm diameter were then cut by a wire-cutting electric discharge machine (EDM). The disks were processed by HPT under a selected pressure of 2, 4 and 6 GPa with 1/4, 1, 2 or 5 revolutions at a rotation speed of 1 rpm at room temperature. The alignment around the rotation axis of the upper and lower axes was adjusted to well within ±0.01 mm.
Slippage between the disk and the anvils was measured after 1/4 revolutions as described in Ref [20, 21].
The disks were mechanically polished to a mirror-like surface and then the Vickers microhardness was measured along 12 radial directions at every 0.5 mm from the disk center to the edge. The average was calculated from the twelve separate measurements at the same distances from the center. The disk processed for 5
revolutions at each pressure was cut to two halves and polished to a mirror-like surface and the hardness measurements were further conducted across the thickness on the cross sectional plane at every 0.08 mm from one surface to the other. Each hardness measurement was conducted by using a load of 200 g for a duration time of 15 s.
After processing by HPT, the disks were mechanically polished to a thickness of
~0.50 mm and tensile specimens were cut from the polished disks using an electric discharge machine (EDM) at the 2mm off-center position as illustrated in Fig.2.1.1 with the dimensions of 1.5mm gauge lengths and 0.7mm widths. The tensile specimens were pulled to failure at a room temperature using a testing machine operating at a constant rate of cross-head displacement with the initial strain rate of 3.0 × 10⁻³ s−1. The fracture surface was observed by a Keyence VE7800 scanning electron microscope (SEM) and Hitachi S-4300SE (FE-SEM) operating at 20 kV.
Disks with 3mm diameter were punched out from the center and edge parts of HPT-processed disks as illustrated in Fig.2.1.1. They were ground to a thickness of 0.15 mm and then thinned using a twin-jet electro-polishing facility in a solution of 90vol% CH3COOH and 10vol% HClO4 at room temperature with an application of 29 V for V, a solution of 4vol% H2SO4 and 96vol% CH3OH at 263K with an application of 20 V for Nb and a solution of 5vol% H2SO4, 2vol%HF and 93vol%CH3OH at 258K for Ta. The microstructures were observed using a Hitachi H-8100 transmission electron microscope (TEM) operating at 200 kV. Selected area electron diffraction (SAED) patterns were taken from regions having diameters of 6.3 μm.
Figure 2.1.1. Dimensions of disk sample including positions for TEM disks and tensile specimen.
.
2.1.3. Results and discussions 2.1.3. (1) Hardness measurement
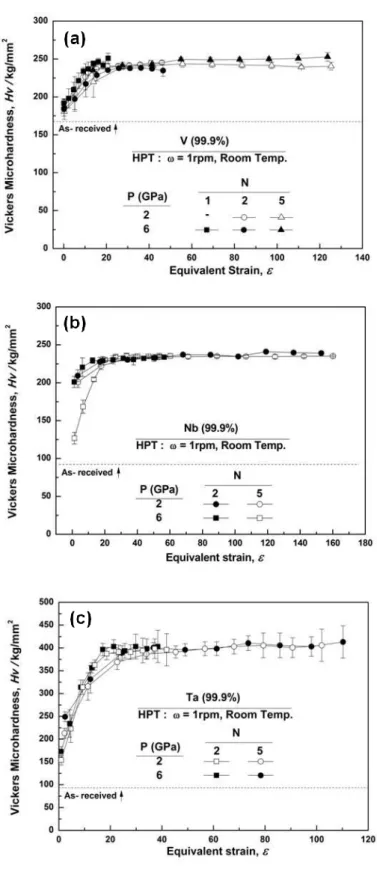
The average values of Vickers microhardness are plotted in Fig.2.1.2 as a function of the distance from the disk center after HPT processing for N= 1, 2 and 5 revolutions under the pressures of 2 and 6 GPa. For all V, Nb and Ta, Vickers microhardness increases with the distance from the disk center for all numbers of revolutions under both pressures but the hardness saturates to constant levels. In all cases, there is no changing in hardness after reaching the saturation level. Saturation levels are 240 Hv, 230Hv and 400Hv for V, Nb and Ta, respectively. These results are similar to Mo and V as described in chapter 2.2. The reason for this should be due to the difference in shear modulus. Earlier study showed that when hardness is plotted against equivalent strain divided by shear modulus, a universal plot is attained [23]. Thus under a given pressure, the sample with larger shear modulus requires more strain to reach a steady state than the sample with smaller shear modulus.
All Vickers microhardness values in Fig. 2.1.3 are plotted as a function of the equivalent strain in Fig. 2.1.3. Here, the following equation is used for the calculation of the equivalent strain [18].
(2.1.1)
where r is the distance from the disk center, N is the number of revolutions, s is the fraction of slippage and t(N) is the disk thickness as a function of N during HPT processing. The value of s was measured at each pressure for all metals using a procedure as described earlier [18] and was found to be in the rage of 0.1 to 0.2. The
form of t(N) was determined as a function of N by measuring the thicknesses after several different revolutions as in Ref. [9]. It is apparent that the microhardness data fall on a single curve. Microhardness increases with increasing equivalent strain at an initial stage of straining and saturates to steady-state levels at high strains where the hardness remains unchanged with further straining.
To investigate homogeneity of the HPT-processed disks, hardness measurement was conducted across the thickness on the cross sectional plane cut along the diameter of each disk. Figure 2.1.4 plots hardness against the distance from the disk surface at the disk center and at the distances of 2 and 4 mm located from the disk center.
Microhardness is almost constant across the thickness, although the hardness levels become higher with increasing distance from the disk center in consistence with hardness variations shown in Figs. 2.1.2 and 2.1.3. These results demonstrate that the samples after HPT processing are homogeneously deformed throughout the thickness at any location from the center.
2.1.3. (2) Tensile tests
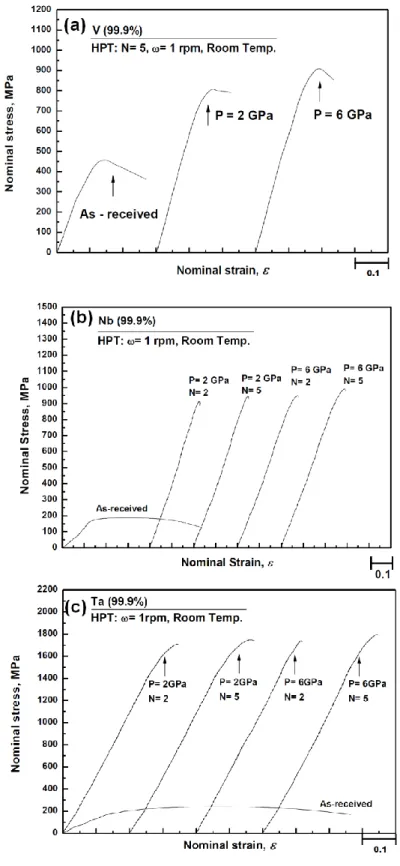
Strain-stress curves are displayed in Fig. 2.1.5 for V, Nb and Ta from tensile testing conducted at room temperature with an initial strain rate of 3.0 × 10⁻³ s-1. The tensile strength is significantly increased by the HPT processing in all materials when compared with the as-received conditions with an elongation to failure retained to some extent. It should be noted that V, Nb and Ta exhibit almost the same tensile strength for both pressures of 2 and 6 GPa and this is consistent with Figs. 2.1.2 and 2.1.3 where the hardness levels are the same once they reach the saturation.
Figure 2.1.2. Vickers microhardness plotted against distance from center for V, Nb and Ta after HPT processing under 2 and 6 GPa for various revolutions.
Figure 2.1.3. Vickers microhardness plotted against equivalent strain for V, Nb and Ta after HPT processing under 2 and 6 GPa for various revolutions.
Figure 2.1.4. Vickers microhardness plotted against height from bottom on cross sectional plane for V, Nb and Ta.
Figure 2.1.5. Nominal stress versus nominal strain curves for V, Nb and Ta under pressures of 2 and 6 GPa.
2.1.3. (3) Fractography
The fracture surfaces after tensile testing of individual specimens are shown in Figs. 2.1.6, 2.1.7 and 2.1.8 for V, Nb and Ta, respectively, where (a) corresponds to as- received specimen, (b) and (c) correspond to the specimens processed at 2 and 6 GPa.
Higher magnification views are shown on the right side of the overall views of the fracture surfaces where the selected square regions correspond to the magnified images.
Fractographs in Figs. 2.1.6, 2.1.7 and 2.1.8 shows that there appears to be little difference in the surface morphology between the samples as-received and processed at 2 and 6 GPa. HPT processed samples contain some regions having fine dimple structures on the fracture surfaces and these features are consistent with the stress-strain curves exhibiting some extent of ductility as shown in Fig. 2.1.5. It is considered that the fine structures after fracture appear to reflect ultrafine-grained structures produced by HPT processing.
2.1.3. (4) Transmission electron microscopy
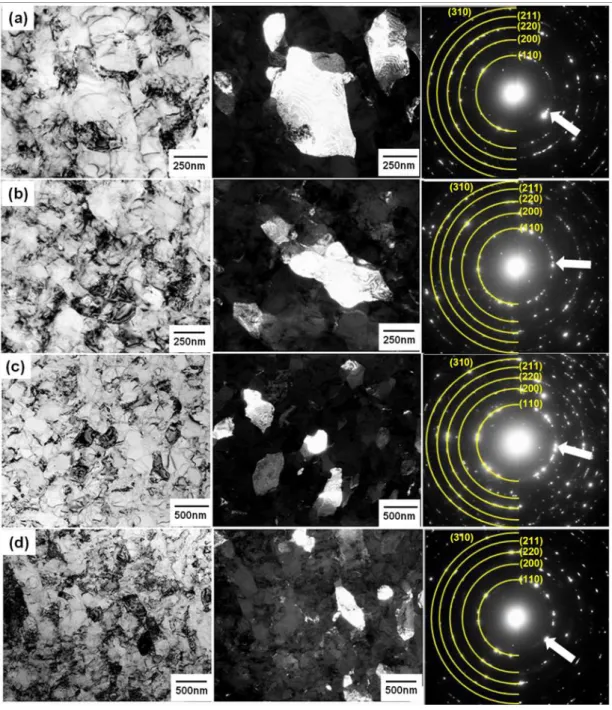
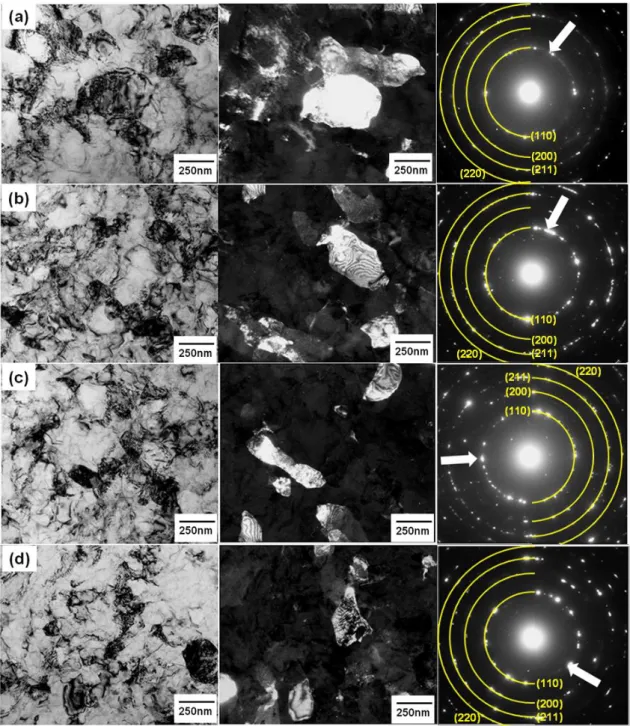
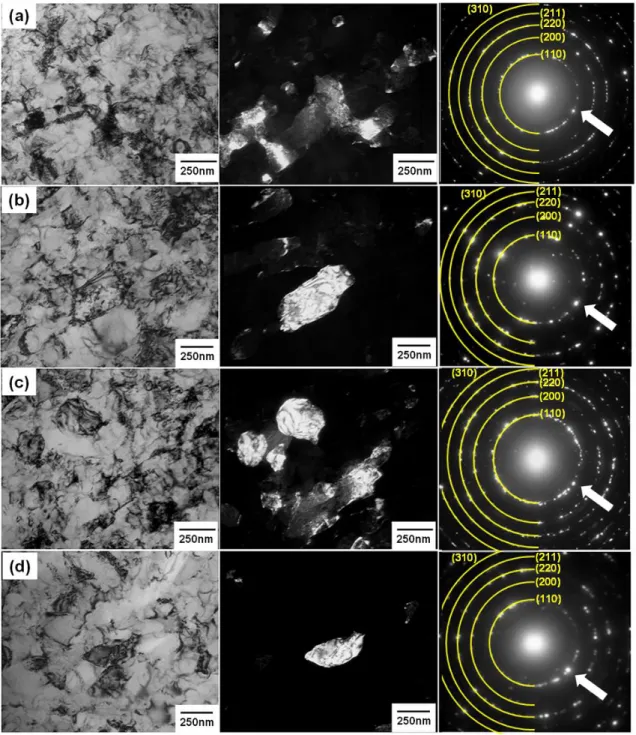
Figures 2.1.9, 2.1.10 and 2.1.11 show TEM micrographs including SAED patterns of V, Nb and Ta processed for 5 revolutions under 2 and 6 GPa, respectively: in each figure, bright-field images on the left, dark-field images on the center and the SAED patterns on the right. The dark field images were taken with the diffracted beams indicated by arrows in the SAED patterns. The microstructures obtained under 2 GPa are shown in (a) N=2, (b) N=5 and those under 6 GPa are in (c) N=2, (d) N=5 for each of Figs. 2.1.9, 2.1.10 and 2.1.11. As illustrated in Fig. 2.1.1, the microstructures were taken from the edge parts of disks corresponding to the saturation of hardness.
The grain size distributions are shown in Fig. 2.1.12 for V, Nb and Ta, respectively,
where Fig. 2.1.12 (a), (c) and (e) are for 2 GPa and Fig. 2.1.12 (b), (d) and (f) are for 6 GPa. The average grain sizes are given in Table 2.1.1. Grain size is decreased with increasing the applied pressure. Inspection of the SAED patterns indicates that the misorientation angle of the grain boundary increases with straining because the patterns tend to form rings. This is consistent with reports that the microstructure evolves from subgrains with low angle boundaries to grains with high angle boundaries with straining by severe plastic deformation [8].
2.1.4. Summary and Conclusions
Vickers microhardness data of V, Nb and Ta fall well on a single curve when they are plotted against equivalent strain. The hardness increases with strain and saturates to a constant level. TEM observation reveals that the grain size is reduced to 240~380 nm at the saturation level throughout the sample. The tensile test shows that the strength significantly increases with some ductility reserved. This ductility is consistent with the fractography showing the presence of fine dimples on the fracture surface.
Figure 2.1.6. SEM fractographs for V: (a) As-received, (b) HPT under P=2 GPa and (c) HPT under P=6 GPa. Left: overall views. Right: magnified view from square areas
in overall views.
Figure 2.1.7. SEM fractographs for Nb: (a) As-received, (b) HPT under P=2 GPa and (c) HPT under P=6 GPa. Left: overall views. Right: magnified view from square areas
in overall views.
Figure 2.1.8. SEM fractographs for Ta: (a) As-received, (b) HPT under P=2 GPa and (c) HPT under P=6 GPa. Left: overall views. Right: magnified view from square areas
in overall views.
Table 2.1.1 Grain sizes for V, Nb, and Ta after HPT process.
Figure 2.1.9. TEM micrographs and SAED patterns of V: under P= 2 GPa for (a) N=2 and (b) N=5 and under P= 6 GPa for (c) N=2 and (d) N=5.
Figure 2.1.10. TEM micrographs and SAED patterns of Nb: under P= 2 GPa for (a) N=2 and (b) N=5 and under P= 6 GPa for (c) N=2 and (d) N=5.
Figure 2.1.11. TEM micrographs and SAED patterns of Ta: under P= 2 GPa for (a) N=2 and (b) N=5 and under P= 6 GPa for (c) N=2 and (d) N=5.
Figure 2.1.12. Grain size distribution of (a)(b) for V, (c)(d) for Nb, and (e)(f) for Ta.
References
1. R.Z. Valiev, R.K. Islamgaliev, I.V. Alexandrov, Prog. Mater. Sci. 45 (2000) 103-189.
2. R.Z. Valiev, Y. Estrin, Z. Horita, T. G. Langdon, M. J. Zehetbauer, Y. T. Zhu, JOM 58 (2006) 33-39.
3. G. Sakai, K. Nkamura, Z. Horita, T.G. Langdon, Mater. Sci. Forum 503-504 (2006) 391-396.
4. N.A. Smirnova, V.I. Levit, V.I. Pilyugin, R.I. Kuznetsov, L.S. Davydova, V. A.
Sazonova, Fiz. Met. Metalloved. 68 (1986) 1170-1177.
5. T. Hebesberger, H.P. Stuwe, A. Vorhauer, F. Wetscher, R. Pippan, Acta Mater. 53 (2005) 393–402.
6. A. P. Zhilyaev, T. G. Langdon, Prog. Mater. Sci. 53 (2008) 893-979.
7. K. Edalati, T. Fujioka, Z. Horita, Mater. Sci. Eng. A 497 (2008) 168-173.
8. Y. Ito, Z. Horita, Mater. Sci. Eng. A 503 (2009) 32-36.
9. J. Čížek, I. Procházka, B. Smola, I. Stulíková, R. Kužel, Z. Matěj, V. Cherkaska, R.K.
Islamgaliev, O. Kulyasova, Mater. Sci. Eng. A 462 (2007) 121-126.
10. K. Edalati, T. Fujioka, Z. Horita, Mater. Trans. 50 (2009) 44-50.
11. R. Z. Valiev, Yu. V. Ivanisenko, E. F. Rauch, B. Baudelet, Acta Mater. 44 (1996) 4705-4712.
12. Y. Todaka, M. Umemoto, J. Yin, Z. Liu, K. Tsuchiya, Master. Sci. Eng. A 462 (2007) 264-268.
13. F. Wetscher, A. Vorhauer, R. Pippan, Master. Sci. Eng. A 410-411 (2005) 213-216.
14. A.V Korznikov, S.Idrisova, N. I. Noskova, Phys. Met. Metall. 85 (1998) 327-331.
15. Y. R. Kolobov, B. Kieback, K. V. Ivanov, T. Weissgaerber, N. V. Girsova, Y. I.
Pochivalov, G. Grabovetskaya, M. B. Ivanov, V. U. Kazyhanov, I. V. Alexandrov, Int. J.
Refract. Met. Hard Mater. 21 (2003) 69-73.
16. R. Wadsack, R. Pippan, B. Schedler, Fusion Eng. Des. 66–68 (2003) 265-269.
17. E.N. Popova, V.V. Popov, E.P. Romanov, V.P. Pilyugin, Phys. Met. Metall. 103 (2007) 407-413.
18. E.N. Popova, V.V. Popov, E.P. Romanov, V.P. Pilyugin, Phys. Met. Metall. 101 (2006) 52-57.
19. Q. Wei, H.T. Zhang, B.E. Schuster, K.T. Ramesh, R.Z. Valiev, L.J. Kecskes, R.J.
Dowding, L. Magness, K. Cho, Acta Mater. 54 (2006) 4079–4089.
20. K. Edalati, T. Fujioka , Z. Horita, Mater. Trans. 50 (2009) 44-50.
21. K. Edalati, Z. Horita , T. G. Langdon, Scripta Mater. 60 (2009) 9-12.
22. K. Edalati, E. Matsubara, Z. Horita, Mater. Sci. Eng. A 40(2009) 2079-2086.
23. K. Edalati, Z. Horita, S. Yagi, E. Matsubara, Mater. Sci. Eng. A 523(2009) 277-281.
24. K. Edalati, Z. Horita, Y. Mine, Mater. Sci. Eng. A 527 (2010) 2136-2141.
2.2. Production of ultrafine structured group VI metals in periodic table by high-pressure torsion
2.2.1. Introduction
Ultrafine/ nano grained materials have advantages with higher strength and better ductility over their coarse-grained ones. In recent years, much effort has been devoted to develop grain refinement methods and investigating their unusual mechanical properties.
Several methods using severe plastic deformation (SPD) have been developed for last 2 decades and typical examples are equal-channel angular pressing (ECAP), high-pressure torsion (HPT) and accumulative roll bonding (ARB) [1, 2].
The fundamental concept of HPT was introduced by Bridgman, where intense shear strain was imparted under high applied pressure [3]. In the HPT processing, a thin disk is subjected to compression and torsion to produce much larger strain than other SPD methods like ECAP and ARB. It has been demonstrated that HPT is effective to refine the grain size not only of conventional metallic materials but also of hard and brittle materials [4].HPT has two advantages over other SPD processes: first, it tends to produce both smaller grain sizes and higher fractions of high-angle grain boundaries and second, it is applicable to hard and brittle materials because application of high pressure prevents cracks from initiation and propagation during processing. It is then anticipated that it can be applicable to hard materials such as refractory metals as investigated in this study [5-7].
HPT has been applied to many face-centered cubic (fcc) metals and alloys [8, 9]
and also, applied to some hexagonal-closed packed (hcp) metals and alloys [10-13].
Application of SPD processing to body-centered cubic (bcc) metals and alloys is rather
few [5, 14-18], especially to the metals in Group V and VI which have high melting points. It is well known that they are all hard-to-deform metals with higher yield strengths. Although a few reports are available for SPD processing on Cr and Nb [17, 19-21], they focused on their thermal properties for example, ductile to brittle transition temperature and annealing behavior after SPD processing. This study aims to investigate evolution of mechanical properties and microstructures on two bcc metals, Cr and Mo after HPT processing.
2.2.2. Experimental Materials and Procedures
High purity Cr (99.9%) and Mo (99.9%) were received in the form of 10×10×1 mm3 chips and these chips were ground mechanically to a thickness of 0.85 mm. The average grain size was determined using the linear intercept method and they were of 70 μm and 250 μm for Cr and Mo, respectively. These disks were cut with diameter of 10 mm by a wire-cutting electric discharge machine (EDM). The disks were subjected to HPT under a selected pressure of 2 and 6 GPa for 1/4, 1, 2, 3, 4, 5 or 10 revolutions with a rotation speed of 1 rpm at room temperature. The alignment around the rotation axis of the upper and lower axes was adjusted to well within ±0.01 mm for HPT process.
Slippage between the disk and the anvils was measured after 1/4 revolutions using the procedure described in Ref. [18, 19].
Vickers microhardness was measured along 12 radial directions at every 0.5 mm from the disk center to the edge on mechanically polished surface. Averages were taken from the twelve measurements at the same distances from the disk center. The disks processed for 4 and 5 revolutions in Cr and 5 revolutions in Mo at each pressure were cut to two halves and polished the cross sectional plane to a mirror-like surface.
Figure 2.2.1. Dimensions of disk sample including positions for TEM disks and (a) tensile specimen and (b) bending specimen.
The hardness measurements were conducted across the thickness on the cross sectional plane at every 0.1 mm from one surface to the other. Each hardness measurement was conducted by using a load of 200 g for a duration time of 15 s.
After processing by HPT, the disks were mechanically polished to a thickness of
~0.50 mm and tensile specimens were cut from the polished disks using the EDM at the 2mm off-center position as illustrated in Fig. 2.2.1(a) with the dimensions of 1.5mm gauge lengths and 0.7mm widths. The tensile specimens were pulled to failure at room temperature using a testing machine operating at a constant rate of cross-head displacement with the initial strain rate of 3.0×10⁻³ s−1.
In this study, bending tests were adopted to evaluate the ductility with inclusion of a compression mode. Bending specimens with dimensions of 0.5×0.5×9 mm3 rod were cut from the HPT-processed disks at the position 2 mm from the disk center as illustrated in Fig. 2.2.1(b). Three-point bending tests were conducted at room temperature with a cross-head speed of 0.5 mm/s using 8mm supporting span. Loading was undertaken toward the direction parallel to the pressing direction of the HPT samples. The bending stress was measured using the following Euler–Bernoulli beam theory [23]
(2.1.1)
where F is the bending load, l is the supporting span (8 mm), w and h are the width and length of the bending specimen (0.5 mm and 0.5 mm), respectively. With bending test, it is possible to apply compression component to sample, and therefore deformation in compression and tension is applied at the same time.
The fracture surfaces after the bending tests were observed using a Hitachi S- 4300SE and JEOL JSM-5600 scanning electron microscope (SEM) operating at 20 kV.
Disks with 3mm diameter were punched out of the HPT-processed disks at 3.5 mm from the disk center as illustrated in Fig. 2.2.1(a) and (b). Samples for transmission microscopy (TEM) were made so as to represent the microstructures at midpoint of the thickness. They were ground to a thickness of 0.15 mm and then thinned using a twin-jet electro-polishing facility in a solution of 5vol% HClO4 and 95vol% CH3COOH at room temperature with an application of 10 V for Cr, and a solution of 10vol% H2SO4
and 90vol% CH3OH at 253K with an application of 13.5 V for Mo. The microstructures were observed using a Hitachi H-8100 transmission electron microscope operating at 200 kV. Selected area electron diffraction (SAED) patterns were taken from regions having diameters of 6.3 μm.
2.2.3. Results and discussions 2.2.3. (1) Hardness measurement
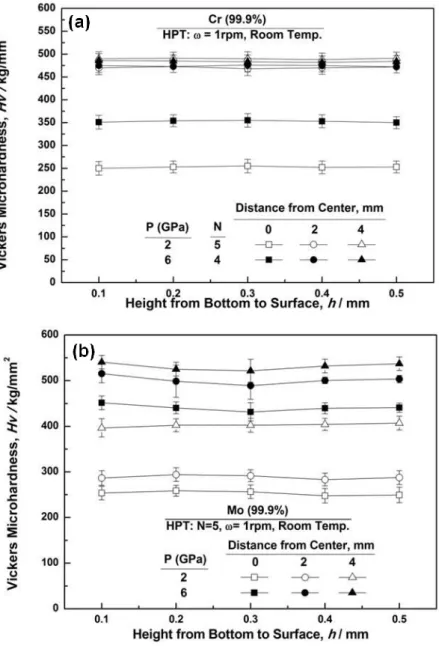
The average values of Vickers microhardness are plotted in Fig. 2.2.2 as a function of the distance from the disk center after HPT processing for N= 1, 2, 3, 4, 5 or 10 revolutions under the pressures of 2 and 6 GPa. For both Cr and Mo, Vickers microhardness increases with the distance from the disk center for all numbers of revolutions under both pressures but the hardness saturates to constant levels. The hardness level at the saturation appears to be dependent on the applied pressure in Mo while it is almost the same in Cr irrespective of the pressure. In both cases, there is no changing in hardness after reaching the saturation level. Recent study showed that when hardness is plotted against equivalent strain divided by shear modulus, a universal
plot is attained [24]. Thus under a given pressure, the sample with larger shear modulus requires more strain to reach a steady state than the sample with smaller shear modulus.
All Vickers microhardness values in Fig. 2.2.2 are plotted as a function of the equivalent strain in Fig. 2.2.3. Here, the following equation is used for the calculation of the equivalent strain [18].
(2.2.2)
where r is the distance from the disk center, N is the number of revolutions, s is the fraction of slippage and t(N) is the disk thickness as a function of N during HPT processing. The value of s was measured at each pressure for both metals using a procedure as described in Ref. [18] and was found to be in the rage of 0.1 to 0.2. The form of t(N) was determined as a function of N by measuring the thicknesses after several different revolutions as in Ref. [9].
In the case of Cr, it is apparent that the microhardness data fall on a single curve.
Microhardness increases with increasing equivalent strain at an initial stage of straining and saturates to steady-state levels at high strains where the hardness remains unchanged with further straining. Close examination reveals that the levels obtained at the applied pressures of 2 GPa and 4 GPa tend to increase with straining although the increase is very gradual. This suggests that, when the applied pressure is low, the microstructure gradually evolves with straining and reaches a steady state where a balance between hardening and softening is established as described in a report [19]. It should be noted that the evolution under the higher pressure of 6 GPa is similar to the one obtained in Cu, Fe and other metals and alloys [7, 10]. It is considered that the slow
evolution of hardness at the lower pressures can be due to insufficiency of the pressure when compared with Cr.
To check homogeneity of the HPT-processed disks, hardness measurement was conducted across the thickness on the cross sectional plane cut along the diameter of each disk. Figure 2.2.4 plots hardness against the distance from the disk surface at the disk center and at the distances of 2 and 4 mm located from the disk center.
Microhardness is almost constant across the thickness, although the hardness levels become higher with increasing distance from the disk center in consistence with hardness variations shown in Figs. 2.2.2 and 2.2.3. These results demonstrate that the samples after HPT processing are homogeneously deformed throughout the thickness at any location from the center.
2.2.3. (2) Transmission electron microscopy
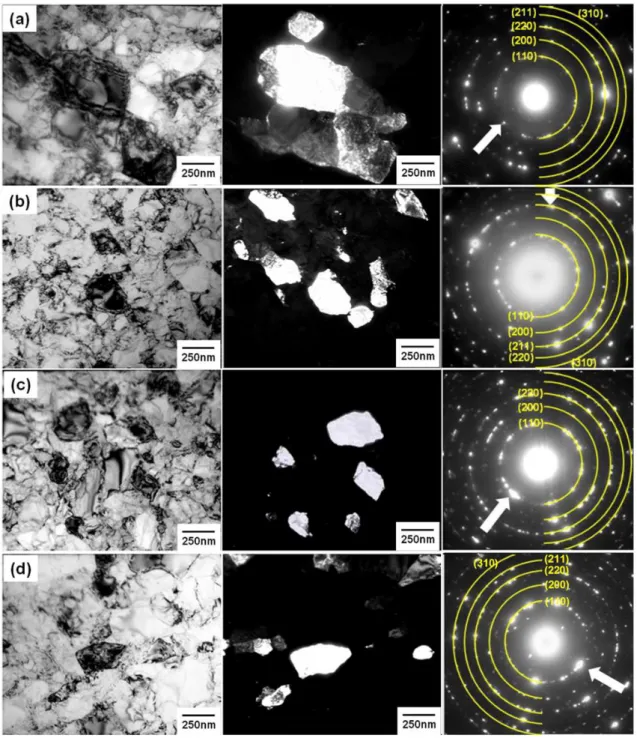
TEM micrographs are summarized in Figs. 2.2.5 and 2.2.6 including SAED patterns for Cr and Mo after HPT processing, respectively: in each figure, bright-field images on the left, dark-field images on the center and SAED patterns on the right.
The dark field images were taken with the diffracted beams indicated by arrows in the SAED patterns. The microstructures obtained under 2 GPa are shown in Fig. 2.2.5 (a) and (b) for 2 and 5 revolutions and those under 6 GPa are in (c) and (d) for 2 and 4 revolutions in Cr. In the case of Mo, as illustrated in Fig. 2.2.1(b), the microstructures were taken from the center parts and edge parts of disks and they are shown in (a) and (c) for the center parts and in (b) and (d) for the edge parts for each of Fig. 2.2.6. The microstructures were taken from the regions corresponding to the steady-state, which are at 3 mm away from the disk center.
Figure 2.2.2. Vickers microhardness plotted against distance from center for Cr and Mo after HPT processing under 2 and 6 GPa for various revolutions.
Figure 2.2.3. Vickers microhardness plotted against equivalent strain for Cr and Mo after HPT processing under 2 and 6 GPa for various revolutions.
Figure 2.2.4. Vickers microhardness plotted against height from bottom on cross sectional plane for (a) Cr and (b) Mo.
The microstructures were taken from the regions corresponding to the steady-state, which are at 3 mm away from the disk center. The grain size distributions are shown in Figs. 2.2.7 and 2.2.8 at each HPT condition in Cr and Mo, respectively, where (a), (b) is for 2 GPa and (c), (d) for 6 GPa. The average grain sizes and standard deviations are summarized in Table 2.2.1. The grain size was obtained from the dark-field images as in Figs. 2.2.5 and 2.2.6 where the two orthogonal axes of the bright areas were measured for a total of more than 100 grains.
With these results, it is found that the average grain size becomes slightly smaller with increasing pressure and increasing number of revolutions. Inspection of the SAED patterns shows also that the misorientation angle of the grain boundary increases with shear straining because the patterns tend to form a net type under 2 GPa in both metals as shown in Figs. 2.2.5(a) and 2.2.6(a). Thus, the microstructures after processing by HPT under 2 GPa for 2 revolutions consists of grains with low angle boundaries (subgrains) with the average sizes of ~250 nm in Cr. In Figs. 2.2.5(b), (c) and (d), and 2.2.6(c) and (d), ring types of SAED patterns form and thus the angles between two neighboring grains becomes high. The grain size decreases to the size of ~200 nm in Cr and ~350 nm in Mo with many dislocations within the grains. Inspection of the SAED patterns indicates that the misorientation angle of the grain boundary increases with straining because the patterns tend to form a net at the center part and a ring at the edge part. This is consistent with reports that the microstructure evolves from subgrains with low angle boundaries to grains with high angle boundaries with straining by severe plastic deformation [9].
In Figs. 2.2.5(b), (c), (d) and 2.2.6(c), (d), ring types of SAED patterns form and thus the angles between two neighboring grains becomes high.
Figure 2.2.5. TEM micrographs and SAED patterns of Cr: under P= 2 GPa for (a) 2 revolutions and (b) 5 revolutions, and under P= 6 GPa for (c) 2 revolutions and
(d) 4 revolutions.
Figure.2.2.6.TEM micrographs and SAED patterns of Mo: after 5 revolutions under P= 2 GPa near (a) center part and (b) edge part, and under P= 6 GPa near (c) center part
and (d) edge part.
Figure 2.2.7. Grain size distribution of Cr: under P= 2 GPa for (a) 2 revolutions and (b) 5 revolutions, and under P= 6 GPa for (c) 2 revolutions and (d) 4 revolutions.
Figure 2.2.8. Grain size distribution of Mo: under P= 2 GPa with 5 revolutions for (a) center part and (b) edge part, and under P= 6 GPa with 5 revolutions for (c) center part
and (d) edge part.
Table 2.2.1 Grain sizes for Cr and Mo after HPT process.
The grain size decreases to the size of ~200 nm in Cr and ~350 nm in Mo with many dislocations within the grains. Inspection of the SAED patterns indicates that the misorientation angle of the grain boundary increases with straining because the patterns tend to form a net at the center part and a ring at the edge part. This is consistent with reports that the microstructure evolves from subgrains with low angle boundaries to grains with high angle boundaries with straining by severe plastic deformation [9].
Comparison of the microstructures between Cr and Mo indicates that the effect of the applied pressure is different: it is little on Cr so that the microstructure including the grain size formed at 2 GPa is almost the same as the one formed at 6 GPa, but the difference is significant between the two pressures in Mo. It is apparent that subgrain structures well develop not only in the center part but also in the edge part in Mo under the pressure of 2 GPa and the grain size is more than 5 times larger under 2 GPa than 6 GPa. This microstructural observation is in accordance with the difference in the hardness levels observed at the two pressures. It is then confirmed that the microstructural evolution is slow in Mo at the applied pressure of 2 GPa. It is considered that this slow evolution of the microstructure is attributed to lower applied pressure with respect to the high yield strength in Mo. Thus, the generation of dislocation is not sufficient to refine the grain size. It was shown that dislocations play an important role to form grain boundaries with high angle of misorientations [7]. More intense generation of dislocations and less recovery lead to finer grain sizes during severe plastic deformation [8]. It should be discussed why the microstructure becomes finer in Mo as the applied pressure is higher despite the fact the total strain is the same.
It is well established that the strain is determined in proportion to the product of dislocation density and slip distance. Under a high-pressure constrained condition,
dislocations are forced to be generated more but at the same time they are forced to be annihilated. This should be less likely when the pressure is low. The saturation level is determined by the balance between dislocation generation and annihilation. The case of larger dislocation density and shorter slip distance at the high-pressure constrained condition yields the same strain as the case of smaller dislocation density and longer slip distance at the low-pressure constrained condition. The difference between the two conditions is that the grain size becomes smaller with higher angle boundaries in the former because the generated dislocations are more annihilated at grain boundaries. The difference in the microstructure as well as the saturation level arises from the difference in dislocation activity such as generation and annihilation which is more intense at a high-pressure constrained condition than at a low-pressure constrained condition.
2.2.3. (3) Tensile and Bending Tests
Stress-strain curves after tensile tests are delineated in Fig. 2.2.9(a) and (b) for Cr and Mo, respectively. For Cr, all tensile specimens were failed during loading except the as-received specimen. For Mo, the tensile strength significantly increased to ~1450 MPa with some ductility. The results after bending tests are shown in Fig. 2.2.10 to delineate nominal stress-displacement curves for Cr. Both tensile tests and bending tests are well consistent, where no ductility is present in the HPT-processed Cr. It is shown that bending stress is increased with increasing in applied pressure. Little ductility in Cr can be due to the effect of invisible cracks generated during the HPT process despite application of high pressure.
Figure 2.2.9. (continue)
Figure 2.2.9. Nominal stress versus nominal strain curves after tensile testing for (a) Cr and (b) Mo under pressures of 2 and 6 GPa.
Figure.2.2.10. Nominal bending stress versus displacement curves after bending testing for Cr under pressures of 2 and 6 GPa.
2.2.3. (4) Fractography
Figure 2.2.11. SEM fractographs after tensile testing for Cr: (a) as-received sample, (b) HPT-processed sample under P=2 GPa for N= 5 and (c) HPT-processed sample under
P=6 GPa for N=4. Magnified views are shown from selected square areas in overall views.
Figure 2.2.12. SEM fractographs after tensile testing for Mo: (a) as-received sample, (b) HPT-processed sample under P=2 GPa for N= 5 and (c) HPT-processed sample under
P=6 GPa for N=5. Magnified views are shown from selected square areas in overall views.
Fractographs after tensile testing are displayed in Figs. 2.2.11 and 2.2.12 for Cr and Mo, respectively, where (a) represents the as-received sample and (b) and (c) correspond to HPT-processed samples under the pressures of 2 and 6 GPa for the largest number of revolutions. Figure 2.2.11 shows a brittle type of fracture in both as-received and HPT-processed specimens. The fracture surfaces of the as-received specimen are rough in the low magnification view but many smooth areas are visible in the high magnification view. For the HPT-processed specimens, the surfaces are smooth with sharp edges on the cross sections in the low magnification view but roughness finely appears on the fractured surfaces as found in the high magnification view. This fine roughness is then considered to be attributed to the fine-grained structure obtained by HPT.
The difference in the fractography is prominent between the fracture surfaces of the specimens processed at 2 and 6 GPa as shown in Fig. 2.2.12. Fine dimple patterns are visible for the specimen processed at 2 GPa but the smoother surface exhibits cleavage for the sample at 6 GPa. The latter surface appears because the specimen becomes hardened by intense straining and thus cracks form and propagate through the specimen. These features are then consistent with the fracture modes with some ductility in the former and brittleness in the latter as shown in Fig. 2.2.9(b).
2.2.4. Summary and Conclusions
1. Vickers microhardness data fall on a single curve when plotted as a function of equivalent strain for only Cr after HPT processing.
2. The hardness increases with increasing in the equivalent strain at an early stage of straining and reaches into a steady-state where the microhardness remains
unchanged even further straining.
3. TEM observation reveals that the grain size is reduced to 200~250 nm in Cr and
~350 nm in Mo at the saturation level throughout the sample. It is consistent with the tendency of microhardness plotting and grains are arranged along the torsion direction during HPT process
4. The hardness behavior of Mo is different from Cr. The hardness values lie on a single curve when the applies pressure is high as 6 GPa but, when it is lower, the hardness increase is gradual to the saturation level, and the hardness level deviates far below the saturation level as the pressure becomes lower. TEM observation reveals that the grain size is reduced to ~350 nm at the saturation level but the microstructure becomes coarser as the applied pressure is lower.
The high tensile strength of ~1.4 GPa is achieved at a lower applied pressure as 2 GPa with some ductility but the tensile specimen fractures in a brittle manner when it is processed at the higher pressure of 6 GPa. The difference in the tensile behavior is well reflected in the fractography with fine dimples on the former but with smooth and cleaved surface on the latter.
5. The slower evolution of microstructure as well as of hardness to the saturation level observed in Mo is due to the applied pressure which is lower than the yield stress so that the dislocation activity is not sufficient to refine the grain size.
References
1. R.Z. Valiev, R.K. Islamgaliev, I.V. Alexandrov, Prog. Mater. Sci. 45 (2000) 103-189.
2. R.Z. Valiev, Y. Estrin, Z. Horita, T. G. Langdon, M. J. Zehetbauer, Y. T. Zhu, JOM 58 (2006) 33-39.
3. P.W. Bridgman, Phys. Rev. 48 (1935) 825-847.
4. G. Sakai, K. Nakamura, Z. Horita, T. G. Langdon, Mater. Sci. Forum 503-504 (2006) 391-396.
5. S. Lee, K. Edalati, Z. Horita, Mater. Trans. 51 (2010) 1072-1079.
6. N.A. Smirnova, V.I. Levit, V.I. Pilyugin, R.I. Kuznetsov, L.S. Davydova, V.A.
Sazonova, Fiz. Met. Metalloved. 68 (1986) 1170-1177.
7. T. Hebesberger, H.P. Stuwe, A. Vorhauer, F. Wetscher, R. Pippan, Acta Mater. 53 (2005) 393-402.
8. K. Edalati, T. Fujioka, Z. Horita, Mater. Sci. Eng. A 497 (2008) 168-173.
9. Y. Ito, Z. Horita, Mater. Sci. Eng. A 503 (2009) 32–36.
10. K. Edalati, Z. Horita, Y. Mine, Mater. Sci. Eng. A 527 (2010) 2136-2141.
11. K. Edalati, Z. Horita, S. Yagi, E. Matsubara, Mater. Sci. Eng. A 523 (2009) 277-281.
12. K. Edalati, E.Matsubara, Z. Horita, Metall. Mater. Trans. A 40 (2009) 2097-2086.
13. K. Edalati, A. Yamamoto, Z. Horita , T. Ishihara, Scripta Mater. 64 (2011) 880-883.
14. F. Wetscher, A. Vorhauer, R. Pippan, Master. Sci. Eng. A 410-411 (2005) 213-216.
15.Y.R. Kolobov, B.Kieback, K.V. Ivanov, T.Weissgaerber, N.V. Girsova, Y.I.
Pochivalov, G. Grabovetskaya, M.B. Ivanov, V.U. Kazyhanov and I.V. Alexandrov, Int.
J. Refract. Met. Hard Mater. 21 (2003) 69-73.
16. Q. Wei, H.T. Zhang, B.E. Schuster, K.T. Ramesh, R Z. Valiev, L.J. Kecskes, R.J.
Dowding, L. Magness, K. Cho, Acta Mater. 54 (2006) 4079-4089.
17. R. Wadsack, R. Pippan. B. Schedler, Fusion Eng. Des. 66–68 (2003) 265-269.
18. K. Edalati, T. Fujioka, Z. Horita, Mater. Trans. 50 (2009) 44-50.
19. K. Edalati, Z. Horita , T. G. Langdon, Scripta Mater. 60 (2009) 9-12.
20. E.N. Popova, V.V. Popov, E.P. Romanov, V.P. Pilyugin, Phys. Met. Metall. 103
(2007) 407-413.
21. E.N. Popova, V.V. Popov, E.P. Romanov, V.P. Pilyugin, Phys. Met. Metall. 101 (2006) 52-57.
22. V.V. Popov, E.N. Popova, A.V. Stolbovskiy, V.P. Pilyugin, Master. Sci. Eng. A 528 (2011) 1491-1496.
23. ASTM E290, Standard Test Methods for Bend Testing of Material for Ductility, ASTM International, West Conshohocken, PA, 2009.
24. K. Edalati, Z. Horita, Mater. Trans. 51 (2010) 1051-1054.
Chapter 3. Simultaneous strengthening of Al alloys through grain refinement and fine precipitation using high-pressure
torsion and subsequent aging
3.1. Enhancement of strength and ductility of Al-Ag alloys processed by high-pressure torsion and aging
3.1.1. Introduction
In 1938, Gunier [1] and Preston [2] reported so-called GP zones in Al-rich, fcc Al-Cu plate-like precipitates and later Al-Ag spherical precipitates [3]. Precipitation in Al-Ag alloys was studied by Guinier, Geisler and Köster and their various collaborators [4]. Hardy and Heal [5] suggested that the most probable sequence of precipitation is spherical G.P. zones (possibly ordered) γ` plates (Ag2Al, formed on stacking faults or faulted during growth) γ (formed by discontinuous precipitation, a solute-rich hexagonal-close-packed (hcp) phase inside of face-centered-cubic (fcc) solid solution).
Strength of the alloys is improved along with such a well dispersed fine precipitation sequence during aging.
Grain refinement also increases the strength of metallic materials through the Hall-Petch relation [6, 7].
(3.1.1)
where σo is the friction stress required to move a dislocation and k is a material-