Kyushu University Institutional Repository
パーライト鋼のミクロ組織変化と不均質変形の関係
王, 延緒
https://doi.org/10.15017/1931880
出版情報:Kyushu University, 2017, 博士(工学), 課程博士 バージョン:
権利関係:
Microstructure evolution and
heterogeneous deformation of pearlite steels
パーライト鋼のミクロ組織変化と 不均質変形の関係
By Yanxu Wang
Department of Materials Physics and Chemistry Kyushu University
2018
Acknowledgements
First and foremost, I would like to express my deepest and sincere gratitude to my supervisor, Prof. Takahito Ohmura for his guidance, support and sharing his knowledge in this field. His profound knowledge and rigorous attitude towards academy set a good model for me to learn from in the future research life.
Sincerely appreciate my supervisor Prof. Takahito Ohmura again.
Meanwhile, I would like to gratefully thank Prof. Yo Tomota who introduced me to Prof. Takahito Ohmura. He expertly introduced me into the new research field of metallic metallurgy and patiently answered my questions in neutron measurement. His strictness and diligence, intelligence and wisdom, and his humor and wit impressed me deeply. He showed me the qualities of the scholar, and the way to carry on research. For the first time in my life, I realize that I can make scientific attributions to human being.
I would like to greatly appreciate the constructive comments, abundant discussion and thoughtful guidance provided by Prof. Setsuo Takaki and Prof.
Osamu Furukimi. I am really grateful for their valuable corrections and excellent advice on my doctoral thesis.
I would like to express my sincere thanks to Dr. Stefanus Harjo, Dr. Satoshi Morooka and Dr. Wu Gong for invaluable advice and support in experiment, and for sharing with me their deep knowledge on neutron diffraction.
My warm acknowledgments will go to all members at High Strength Materials Group in National Institute for Materials Science (NIMS) for creating a pleasant office atmosphere and for their assistant in experiments and daily life. Grateful thanks go to all my friends in China and overseas for their concern and greetings.
I am deeply grateful to my mother. She never hesitates to educate me. She
works hard for her whole life but never asks me for something. She taught me to study hard and be an upright and promising man. I have been always missing my father. He is not good at verbal expression but I never failed to feel his love.
Without them, my life was so miserable. Last but not the least, I would want to thank my sisters. I really wish that they live a peaceful and happy life with their husbands and adorable children.
Contents
1 Background ... 1
1.1 Pearlite transformation and its microstructures ... 1
1.2 Mechanical properties ... 7
1.2.1 Yield strength ... 7
1.2.2 Work hardening behavior ... 11
1.2.3 Fracture behavior ... 14
1.3 Research aim and outline ... 18
2 Experimental methods ... 20
2.1 Neutron diffraction and scattering ... 20
2.1.1 Neutrons vs. X-rays ... 20
2.1.2 Neutron diffraction ... 20
2.1.3 Data treatment ... 23
2.1.4 Neutron diffraction application in steels ... 24
2.2 Nanoindentation studies of bulk materials ... 25
2.2.1 Nanoindentation ... 25
2.2.2 Incipient plasticity (pop-in) ... 26
3 Origins of internal stress/strain of pearlite steels ... 31
3.1 Introduction ... 31
3.2 Experimental procedures ... 32
3.2.1 Specimen preparation ... 32
3.2.2 In situ neutron diffraction at ENGIN-X ... 32
3.2.3 In situ neutron diffraction at TAKUMI ... 33
3.3 Results and discussion ... 34
3.3.1 Transformation and coherent strains ... 34
3.3.2 Thermal strain ... 41
3.4 Conclusions ... 42
4 Yielding behavior of pearlite steels ... 44
4.1 Introduction ... 44
4.2 Experimental procedures ... 45
4.3 Results and discussions ... 47
4.3.1 Tensile behavior ... 47
4.3.2 Influence of strain aging ... 47
4.3.3 Microstructural features ... 48
4.3.4 Diffraction profile line broadening ... 56
4.3.5 Plasticity initiation during nanoscale deformation ... 58
4.4 Conclusions ... 62
5 Work-hardening behavior of pearlite steels ... 64
5.1 Introduction ... 64
5.2 Experimental procedures ... 65
5.3 Results and discussions ... 66
5.3.1 Microstructure and macroscopic stress-strain response ... 66
5.3.2 Diffraction profile ... 68
5.3.3 Characterization of internal lattice strain ... 70
5.4 Conclusions ... 80
6 Low-cycle fatigue behavior of pearlite steels ... 82
6.1 Introduction ... 82
6.2 Experimental procedures ... 83
6.3 Results and discussions ... 86
6.3.1 Macroscopic stress-strain response ... 86
6.3.2 Neutron diffraction profiles ... 87
6.3.3 Phase strain behavior ... 90
6.3.4 Changes in FWHM with cyclic deformation ... 95
6.4 Conclusions ... 100
7 Summary and conclusions ... 102
References ... 104
Appendix ... 115
1
1 Background
The requirements for energy conservation and emissions reductions are becoming increasingly strict due to global economic development. Materials should have high strength, plasticity, and toughness, and low production costs.
Many engineering materials consist of multiple phases and usually exhibit superior properties compared to those of single-phase materials. Pearlite steels have a two-phase structure and are widely used in industrial applications due to their high strength and sufficient ductility for the application. In this thesis, the current knowledge regarding this material is reviewed. Based on this, the aim and scope of the current study is discussed. The experimental results of this study are presented in four parts, followed by a discussion. Finally, a short summary of the work, its implications, and scope for future work is shown.
1.1 Pearlite transformation and its microstructures
Pearlite is the product of the decomposition of austenite (γ) iron via a diffusional eutectoid transformation, super-cooled below the A1 temperature (727 °C for the Fe-C binary system) to form a lamellar (or layered) structure of ferrite (α) and cementite (θ) phases. Mechl et al. [1] provided a basic quantitative description by measuring the growth rates and lamellar spacing of pearlite for Fe-C binary and multi-element steels. Pearlite transformation occurs by the nucleation of alternating ferrite and cementite phases on the grain boundaries and grows with a nearly constant velocity into neighboring austenite grains (γ2), as shown in Fig. 1-1. The commonly used model for explaining the kinetics of pearlite growth, where carbon atoms must be transported from the ferrite to the neighboring cementite phase, is Zener-Hiller theory [2,3]. This model has often
2
been used to determine the rate controlling process for pearlite growth, though the rate is usually higher than expected. Subsequently, researchers have explained experimentally observed growth rates in Fe-C and other non-ferrous alloys considering grain boundary diffusion [4]. Changing the transformation temperature results in changes in the lamellar spacing due to different carbon diffusion rates. The process of heating the material in a single-phase region followed by subsequent cooling is called patenting. Therefore, the obtained lamellar structure is also called patented pearlite.
Figure 1-2 shows the unit cells of a body-centered cubic (BCC) and an orthorhombic crystal structure. Therefore, the transformation from the face-centered cubic (FCC) to BCC and orthorhombic [5] structures are accompanied by volume expansion due to the low density of pearlite (α+θ). The volume changing due to the formation of pearlite in an austenite matrix results in elastic strain. According to continuum elasticity theory [6,7], this internal stress occurs as a tensile hydrostatic stress in austenite and as a compressive stress in
Fig. 1-1 Schematic illustration of the growth of lamellar structures during pearlite transformation
3
pearlite. Transmission electron microscopy (TEM) analysis at room temperature (RT) revealed a high dislocation density in the austenite phase just ahead of the pearlite interface [8]. There is evidence that the internal stresses generated due to the 4.76% volume expansion during pearlite transformation are partially relaxed by plastic deformation in austenite [9]. Such experimental approaches are ex situ observations. In order to evaluate phase strains during ferrite transformation in Fe-Cu and Fe-Co binary alloys [10], changes in the lattice parameters of austenite and ferrite during ferrite transformation in low alloy steels [11,12] and ausforming behavior during bainite transformation [13] were measured using in situ neutron diffraction. However, few reports have investigated pearlite transformation by neutron diffraction.
Pearlite nucleates heterogeneously and forms hierarchical substructures referred to as blocks and colonies, as shown schematically in Fig. 1-3.
Cooperative growth involving the two constituent phases, ferrite and cementite, occurs and there are a variety of crystallographic relationships between these Fig. 1-2 Unit cells of (a) bcc: space group Im3m, #229 and (b) orthorhombic:
space group Pnma, #62, with lattice parameter a=5.08264(6) Å, b=6.74364(8) Å, c=4.51983(5) Å at room temperature. Fe and C atoms are
colored blue and green, respectively.
4
phases. The Kurdjumow-Sachs (KS) crystallographic orientation relationship (OR) [14] is observed between ferrite and austenite adjacent to the grain boundary. As the interface moves, pearlite is able to grow into the austenite grain and this interface is regarded as an incoherent high energy interface. These events occur at various sites along the grain boundaries. Miyamoto et al. [15]
explained the formation of GB-ferrite with KS OR and explained the morphological changes in ferrite and cementite at various transformation temperatures considering the near-KS OR and non-KS OR for eutectoid and hypereutectoid pearlite steels.
In the pearlite structure, a block is traditionally characterized as a large area which ferrite has the same crystallographic orientation [17], while recent studies using electron backscatter diffraction (EBSD) have revealed that the crystallographic orientation is slightly rotated within an individual block [18-20].
Areas where the cementite lamellae are mostly parallel are termed colonies, as shown in Fig. 1-3. It has been also confirmed that the Bagaryatski [21], Iasichev [22], and Pitsch-Petch [23,24] relationships exist between the ferrite and cementite. These ORs are expressed as follows:
Fig. 1-3 The two-level hierarchy in patented pearlite morphology [16].
5
Bagaryatsky: [100]θ//[1-10]α, [010]θ//[111]α, (001)θ//(11-2)α
Isaichev: [010]θ//[111]α, [103]θ//(01-1)α
Pitsch-Petch: [100]θ 2.6° from [-31-1]α, [010]θ 2.6° from [131]α, (001)θ//(-2-15)α. These orientations are very close to each other and the formation of such ORs suggests that ferrite and cementite have naturally occurring coherent or semi-coherent interfacial planes resulting from co-operative growth. Although the resolution of TEM is better than 0.1nm, the observation of interfacial structures in pearlite steels is limited in the literature. Zhou et al. [25,26] revealed that the ferrite/cementite interface in patented pearlite is semi-coherent with large misfit strains using large angle tilting and high resolution TEM (HRTEM).
They described misfit dislocations and ledges at the interface that occur to relax high local internal stresses. Recently, X-ray diffraction line broadening of ferrite peaks in pearlite steels was shown to be dependent on the pearlite volume fraction [27] and cementite morphology [28], thought to arise from misfit strains at the ferrite/cementite semi-coherent interface.
The volume change due to the transformation can cause internal stress.
Temperature changes also contribute to internal stress, where the thermal strain is generally expressed as:
εi=ki∆T (1)
where i=1,2,3 represent the principal axes and k is the thermal expansion coefficient. According to the previous studies [29-32], the thermal expansion coefficient (TEC) of ferrite and cementite are similar at high temperature, as shown in Fig. 1-4. However, upon cooling to around room temperature (RT), the TEC of ferrite is larger than that of cementite and continuously decreases with decreasing temperature. However, the TEC of cementite rapidly decreases around the Curie temperature, which marks the paramagnetic to ferromagnetic transition. Since cementite is an orthorhombic structure with low crystal
6
symmetry, the TECs are considerably different in all directions. Mohsenzadeh et al. [33] further demonstrated the generation of internal stress caused by the volume expansion and thermal contraction mismatch. Koga et al. [20]
investigated the contributions of the thermal misfit strains and the interface coherent misfit strains using high temperature X-ray diffraction and argued that thermal misfit strains had little effect on diffraction line broadening compared with coherent misfit strains. However, the decarburization near the surface cannot be avoided during high temperature measurement [34].
Fig. 1-4 Thermal expansions coefficients in the temperature range RT to 1023 K [32].
Considering the morphology of cementite plates, TEM or scanning electron microscopy (SEM) 2-dimensional (2D) images are generally used to analyze cementite plates that become thinner (or disappear in some cases) along the growth direction [9,25,35,36]. Three-dimensional (3D) SEM with EBSD can clearly image cementite plates with various morphologies at different depths
7
within the sample, in addition to the length and width shown by 2D images [37,38]. This suggests that long-range carbon diffusion take place in austenite during pearlite transformation.
Despite the many studies investigating austenite to ferrite and cementite transformations, the kinetics of this transformation is still unclear. In addition, the mechanism of diffraction line broadening for pearlite is not completely understood. As relatively low dislocation densities have been observed in patented pearlite using TEM [39], the diffraction line broadening is particularly intriguing. Therefore, the pearlite transformation at various temperatures, cementite spheroidization, and pearlite structure upon heating and cooling were investigated in this study using in situ neutron diffraction and will be discussed in detail in Chapter 3.
1.2 Mechanical properties
1.2.1 Yield strength
The mechanical properties of pearlite steels have been investigated for several decades considering their engineering applications. Gladman et al.
attributed the yield strength of ferrite/pearlite steels mainly to increased pearlite content [40]. Hyzak et al. further demonstrated that the lamellar spacing (λ), austenite grain size, and pearlite colony size all affect the mechanical properties [41]. Later, the pearlite lamellar spacing was confirmed to be the primary microstructural parameter controlling the yield strength of full-pearlite steels, assuming that cementite acts as a barrier to dislocation movement [42-44]. The dependence of mechanical properties on λ can be described by Hall-Petch equation [45] for boundary strengthening:
8
where σYS represents the yield strength, σ0 is the friction stress, and k is a material constant. This relationship assumes that pile-up dislocations can exist within the ferrite phase (instead of at the ferrite/cementite interface). Such pile-up dislocations were confirmed by TEM observations [46]. The yield strength (0.2% proof stress) is plotted versus λ-1/2 and λ-1 in Fig. 1-5(a) and (b), respectively. For both relationships, all experimental data lie along the model lines, indicating that the yield strength is dependent on the lamellar spacing.
However, the experimental results showed a negative intercept (σ0) by using the λ-1/2 in Hall-Petch equation, no apparent physical meaning, while the friction stress (𝜎0) was in reasonable agreement with that for pure iron [47] by using the λ-1 relationship. Thus, an expression for the strength of pearlite was identified using the λ-1 relationship. It is known that decreasing isothermal transformation temperatures or increasing cooling rates in the pearlite continuous cooling transformation range results in a reduction in the lamellar spacing between ferrite and cementite. In addition, the different alloying elements influence the lamellar spacing [48,49]. Therefore, higher yield strengths in pearlite steels can be achieved by decreasing the lamellar spacing.
σYS=σ0+kλ-1/2 (2)
9
Previous efforts to explain the yield strength behavior focused on the morphology of cementite or the lamellar spacing. For instance, the yield strength of pearlite steels decreased when the cementite morphology changed from lamellar to spherical [50,51]. The yield strength of cementite is significantly higher than that of ferrite [52], although the Young's moduli are similar [53].
Therefore, it seems that the most significant factor influencing the yield strength should be ferrite phase according to the law of mixtures,
where σP, σF and σC refer to yield stresses of each phase, and f is the volume fraction of cementite phase. This assumption was subsequently verified using in situ neutron diffraction [54] which established a linear relationship between the yield strength of pearlite and the ferrite lattice strain regardless of the lamellar spacing and cementite morphology [28].
The macroscopic deformation of pearlite represents a typical co-deformation Fig. 1-5 Effect of lamellar spacing on the yield strength (0.2% proof stress):
(a) λ-1/2 and (b) λ-1 relationships [42].
σP=σF(1-f)+σCf (3)
10
of two-phased structures and can be divided into several microscopic deformations; different deformation behavior of the different phases or along different grain orientations result in phase stress and intergranular stress, respectively. Thus, it is clear that elasto-plastic deformation is heterogeneous due to anisotropic elastic properties of the crystals and the multi-scaled heterogeneous deformation behavior based on its microstructure.
At the onset of yielding, recent findings demonstrated discontinuous yielding with clear Lüders bands appearing after ferrite recrystallization [54], as shown in Fig. 1-6. Similar behavior has also been observed in materials such as interstitial free (IF) steel [55], aluminum [55,56], cooper [57,58] and titanium alloys [59,60]
with decreased grain size. In this case, the initial dislocation density is low and dislocation sources (e.g. Frank-Reed) do not exist in significant quantities inside fine grains. Hence, the most likely dislocation nucleation sites are grain boundaries (i.e., grain-refinement strengthening).
Fig. 1-6 Stress-strain curve of pearlite steels [53].
11
The stress-strain curve for the as-patented pearlite does not exhibit Lüders deformation. A spheroidized specimen also showed continuous yielding, so the different cementite morphology cannot be the main factor leading to continuous yielding [28,61]. In this case, the grain boundary has no significant effect on the dislocation nucleation due to the large grain size (~20-30 μm). Therefore, in the absence of grown-in dislocations, dislocations can easily be generated at the ferrite/cementite interfaces due to misfit strains, i.e., the dislocation sources in the ferrite/cementite interfaces are readily activated at low applied loads for as-patented pearlite steels. The hypothesis that pearlite yielding is controlled by the onset of the ferrite matrix seems justified. To verify this, two kinds of specimens with similar spherical cementite structures were prepared and will be discussed in Chapter 4.
1.2.2 Work hardening behavior
In recent years, the work hardening capability of different alloys has been extensively investigated [35,46,62-67]. The initial tensile properties and work hardening capability of eutectoid steel are the key factors for fabricating high-strength steel. Work hardening is usually assessed by the work hardening rate obtained from true stress–strain curves. However, there is not yet agreement between researchers regarding the underlying mechanism.
Takahashi et al. [68] argued the work hardening rate of pearlite depends on the ferrite lamella thickness. Karlsson et al. [69] proposed that the rate is affected by the morphology of the cementite phase. Tanaka et al. [70] and Bae et al. [35]
suggested that the rate is influenced by both the volume fraction and morphology of cementite phase. Thus, the influence of the specific microstructures on the work hardening behavior is unclear. Previous research has focused on macroscopic flow curves; whereas recently, the focus has shifted
12
towards analysis of the evolution of lattice strain due to dissimilar phases and/or anisotropy of grain orientation.
In the case of single phase steels, grain-to-grain yielding occurs at the beginning of deformation as grains with different orientations have different yield strengths. Even in single-phase steel, regions with enhanced strength (e.g. cell walls) develop during plastic deformation and generate internal stress [74]. In multiphase structures, the internal stress/strain is generated due to the different mechanical properties of the different phases. Internal stress is generated when an external load is applied. After removing this load, residual stress/strain remains in the material due to heterogeneous deformation. During loading, both phases are elastically deformed in stage A (see Fig. 1-7, curve 1). If both phases have similar Young’s moduli, there will be no load transfer and no residual stress after unloading. In stage B, the plastic deformation occurs in the soft phase,
Fig. 1-7 Phase strains as a function of the applied load for patented [71], swaged after annealed [72], and cold-drawn [73] pearlite steels.
13
while the lattice strain in the harder one increases rapidly. Thus, the applied load is transferred from the softer phase to the harder one. After unloading, compressive residual strains remain in the soft phase and tensile strains remain in the hard one. This typical load transfer (stress partitioning) between the phases is shown in Fig. 1-7. Therefore, the high work hardening behavior of pearlite steel coincides with the rapid increase in the phase stress. It is concluded that the back stress required to impede dislocation motion is the major source of work hardening. Furthermore, cementite peaks are hardly observed in the heavily drawn specimen, as shown in Fig. 1-7, curve 3. In other words, for materials with smaller particle size or volume fractions of the precipitate, different strengthening mechanisms will be dominant.
In addition, hard and soft oriented grains will also respond differently to load due to the strong elastic anisotropy of ferrite and cementite [75,76]. Figure 1-8 illustrates the evolution of the intergranular strains of ferrite (110), (200), and (310) as well as cementite (122) and (301) in both the axial and transverse directions. Note that in the axial direction, ferrite (200) sustains a smaller load and yields later than (110) and (310) due to a lower Schmid factor. A similar tendency was observed in the cementite phase for pearlite [72,77] and bainite steel [78]. The deformation behavior can be divided into third parts in the ferrite phase occurs in three parts (elastic, elasto-plastic, and fully plastic), which are usually measured in polycrystalline single-phase materials [79,80] and binary ductile-phase steels [81-84]. Thus, elastic and plastic anisotropy both need to be considered. In addition, calculations based on the elasto-plastic self-consistent (EPSC) model and the crystal plasticity finite element method (CPFEM) were used to describe phase and intergranular strains in the transverse direction [79,85]. Hence, the intergranular family grains are superposed on constituent phase, resulting in heterogeneous deformation.
14
Surface measurements by a high-precision marker technique [86] or a digital image correlation method [87] revealed that colonies aligned at ~45° with respect to the tensile direction plastically deformed first. Meanwhile, plastic deformation introduces dislocations into deformed ferrite phases, which are stored at the ferrite/cementite interface, resulting in high local stresses as the cementite has limited slip modes [88]. It is thought that such dislocations are closely related to tensile fractures as colonies with lamellae parallel to the tensile direction fracture easily [46]. These experimental results provided a further understanding of heterogeneous deformation on the specimen scale. It is necessary to clarify whether such heterogeneous plastic deformation occurs within the sample. In Chapter 5, in situ neutron diffraction measurements during tensile deformation of patented pearlite steels were performed in order to analyze the work hardening behavior of colonies with different lamellar alignments.
1.2.3 Fracture behavior
Uniaxial loading conditions are not relevant in industrial applications where the Fig. 1-8 Applied load as a function of intergranular strains for (a) ferrite and (b)
cementite [78].
15
actual engineering materials undergo cyclic and/or multiaxial deformation. Thus, the previously described mechanisms cannot be directly applied in real cases. It is necessary to extend these research fields, and the simple attempt is cyclic uniaxial deformation.
The Bauschinger effect [89] is one of the significant features observed in metals under cyclic loading. The stress–strain curve in Fig. 1-9 shows the appearance of the Bauschinger effect. The material is first placed under tension until a certain amount of plastic deformation is observed. The yield strength is indicated by point A. Thereafter, the material is loaded in the reverse direction and unloading occurs along the elastic curve until the applied load become compressive. The material will start flowing plastically at the stress value indicated by point B, due to the Bauschinger effect. However, if the material does not exhibit a dependence on the stress direction, the compressive curve (the ideal curve is shown as a dashed line) would be symmetrically opposite to the tensile curve, and the magnitude of the stress at point C is equal to that at point A. In this case, the material softens upon load reversal. However, the cause of the Bauschinger effect has not been clarified in detail.
To date, various experimental reports concerning the Bauschinger effect in different materials including FCC and BCC structures like pure alloys [90-92], copper alloys [93,94], metal matrix composite materials [95], and hexagonal close-packed (HCP) material such as titanium alloys [96,97] were carried out.
According to previous monotonous tension–compression deformation test results, the Bauschinger effects were stronger in dual-phase alloys than in the corresponding single-phase alloys [98,99]. Earlier explanations of the Bauschinger effect considered back stress [100] and Orowan theory [101,102].
There are two predominant groups of back stresses, (1) the long range internal stress resulting from the interaction between moving dislocations (e.g. grain
16
boundary and precipitate) and obstacles during forward deformation, and (2) short range effects, such as annihilation of the dislocations during reverse deformation. In contrast, Orowan [101,102] proposed that dislocations pile up at obstacles during plastic deformation, finally forming cells. During unloading, the dislocation lines cannot move as the structure is mechanically stable. However, they can move at low shear stress during load reversal due to weaker resistance to reverse motion of the dislocations.
Diffraction techniques (especially neutron diffraction) allow direct stress measurements. In a two-phase ductile alloy, the tensile or compressive deformation is classified into three stages (similar to that discussed in Chapter 1.2.2), based on changes in the phase stresses, as shown in Fig. 1-10. It is interesting to note that the compressive strain are within soft phase (austenite) assists reverse plastic deformation and tolerates lower compressive stress than
Fig. 1-9 Schematic diagram of the Bauschinger effect.
17
the harder ferrite phase at stage Ⅲd′. Other studies of austenitic stainless steels exist [103-106], but few discussed changes in the dislocation density during load reversal. The dual phase steels like pearlite also exhibit a large Bauschinger effect. To date, it has been observed that the Bauschinger effect increases with increasing volume fraction of cementite and decreasing lamellar spacing based on experimental [107,108] and simulations [109] results. Naito et al. [110]
clarified that the phase stress was due to ferrite, cementite, and graphite in cast irons; the graphite tolerated little stress and the Bauschinger effect increased with increasing the internal stress.
Fig. 1-10 Intergranular strain versus applied stress of a ferrite-austenite alloy. The volume fraction of ferrite is 32.6 % [99].
18
Cyclic deformation of engineering materials for industrial applications is another important topic for alloy materials. Lots of studies providing a better understanding of the complex cyclic deformation behavior have been undertaken, focusing on cyclic hardening [111], ratcheting [112]. In general, the evolution of different dislocation configurations [113] and the contribution of phase stresses [114] influence these properties. It is interesting to consider multi-phase steels, as anisotropic plastic deformation occurs due to the heterogeneous microstructure. It was shown that cyclic deformation of the pearlite steel depends on the strain amplitude [97,107] and temperature [115], e.g. cyclic softening at low strain amplitudes (<0.7%) or room temperature and cyclic hardening at higher strain amplitudes or 423K. Although many research articles have been published regarding the cyclic deformation behavior of pearlite steels, few investigate the evolution of phase stress. In Chapter 6, load transfer among the phase stresses, Bauschinger effect, and cyclic deformation results from uniaxial low cycle fatigue tests at room temperature will be discussed in detail.
1.3 Research aim and outline
Although pearlite steel has already been studied for about half a century, several issues are still not completely understood or fully characterized. Based on previous literature, this study focuses on the relationship between multi-scale microstructures and the heterogeneous deformation of pearlite steel.
This thesis consists of seven chapters, including the background in Chapter 1 and experimental methods in Chapter 2. To achieve the primary objective, the aims of this work were as follows:
Chapter 3: Investigation of the origin of internal stress during transformation
19
and subsequent cooling.
Chapter 4: The influence of phase interface characteristics on the elastic-to-plastic transition during nano-scale deformation was studied to explain the macro-scale yielding behavior.
Chapter 5: The work hardening behavior in a multi-phase material was evaluated to distinguish stress partitioning arising from the lamellar structure.
Chapter 6: The evolution of phase stress and dislocation density on load reversal was studied to better understand the Bauschinger effect and cyclic softening during low cycle fatigue.
Chapter 7: A summary of the current work and a plan for future work is presented.
20
2 Experimental methods
This chapter presents background details and key experimental methods of the neutron diffraction and nanoindentation techniques used in this study.
2.1 Neutron diffraction and scattering
2.1.1 Neutrons vs. X-rays
In this section, a comparison of neutron and the conventional X-ray diffraction is undertaken. Compared to the use of X-rays, the main advantages of using neutrons are as follows:
1) Neutrons can penetrate to a depth of centimeters in most engineering materials while not destroying the samples.
2) Neutron wavelengths are comparable to atomic sizes and inter-distance spacings. Hence, neutrons are a good probe for investigating the dynamics of solid state and liquid materials.
3) Neutrons have have zero charge, are sensitive to light atoms (e.g. H and C), and can distinguish adjacent elements in the periodic table (e.g. O and N).
Hence, neutron diffraction has been used in science and engineering to explore properties such as residual stress, phase volume fraction, and texture. It is particularly useful for in situ measurement under extreme conditions.
2.1.2 Neutron diffraction
In the last thirty years, neutron diffraction has been developed as an alternative and complementary technique to conventional X-ray diffraction.
Diffraction measurements are based on Bragg’s Law [116]. Figure 2-1 shows the
21
Bragg diffraction. When parallel beams of wavelength λ with an angle of incident θ arrive hit a sample, they are reflected from the atomic lattice planes.
The difference in the distance traveled by the waves scattered from adjacent atomic lattice planes is 2d sin θ, if the extra path length is equal to 𝑛𝜆, then the scattered waves will be superimposed each other. This is described by the well-known Bragg’s Law:
where n is an integer determined by the order given. In (hkl) plane, the Miller indices hkl can include the order n into the lattice spacing [117]. Then eq. (4) can be represented:
where the crystal lattice spacing is given by, As a result,
2dhklsin𝜃hkl=λ (7)
However, when the angle of incidence does not satisfy Bragg’s Law, no diffraction pattern will be observed, as shown in Fig. 2-1.
2d sin𝜃=nλ (4)
2(dhkl/n)sin𝜃hkl=λ (5)
dhkl= d
√h2+k2+l2
(6)
Fig. 2-1 Schematic illustration describing the Bragg diffraction.
22
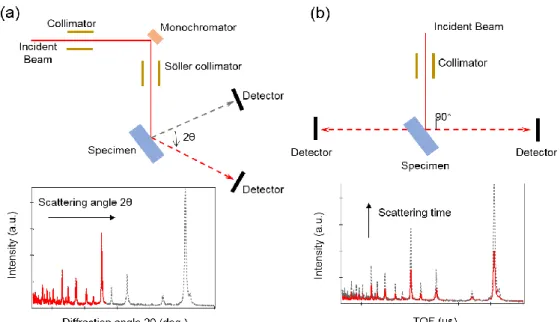
Two different methods are used to perform neutron diffraction measurements:
the (a) angular dispersive (AD) method and (b) time-of-flight (TOF) method, which are shown schematically in Fig. 2-2. In AD method, the detector collects in 2-theta-measuring intensities of single wavelength diffracted neutron as a function of angle (2-theta). The scan is undertaken by rotating the diffraction angle. The TOF method is widely be used for neutron diffraction measurement because it allowing multiple reflections to be easily and quickly measured simultaneously. In contrast to use of a single wavelength neutron in the AD method, the TOF method takes advantage of the different wavelengths present in the neutron beam, optimizing the use of the pulsed neutron beam. From the de Broglie relationship, the wavelength 𝜆 is given by,
λ=ℎ𝑝/mv (8)
where ℎ𝑝, m, and v are Planck’s constant, neutron mass and neutron velocity, respectively.
Fig. 2-2 Schematic of neutron diffraction measurement: (a) angular dispersive and (b) time-of-flight method.
23
The neutron velocity is given by,
v=L/t (9)
where L is the flight path and t is flight time. Thus, the total flight path, L=L1+L2, where 𝐿1 is source-specimen distance and 𝐿2 is specimen-detector distance.
The peak intensities increase with increasing scattering time. The lattice spacing (dhkl) as the function of flight time 𝑡ℎ𝑘𝑙 is:
dhkl= h
2sin𝜃(L1+L2)thkl. (10) 2.1.3 Data treatment
The TOF event-recording mode of the data acquisition system allows the time interval for analysis to be freely changed, even after completion of the test. The obtained neutron diffraction profiles were analyzed using Z-Rietveld software [118]. where the peak position, width, and integrated intensity were significant parameters of interest. Observed peak shifts are due to uniform strain; the phase strain was determined from changes in the lattice parameter:
εph.=(aph.−aph.0 )/aph.0 (11) where aph.0 and aph. refer to the lattice parameter of the stress-free state (before deformation) and that at a certain point during the test, respectively. The “ph.”
means constituent phase, i.e., ferrite or cementite. The strains of cementite for three crystal axes, a, b and c, i.e., εθa, εθb and εθc, are calculated by eq. (11). The mean phase strain was defined as the average of εθa, εθb and εθc. Hence, for the intergranular strain 𝜀ℎ𝑘𝑙 is calculated from the change in the interplanar lattice spacing for <hkl> oriented grain-families along the tensile direction, dhkl, using the following equation:
εhkl=(dhkl−dhkl0 )/dhkl0 (12) where the meaning of subscript “0” is commonly same with eq. (11).
24
The peak width is characterized by the full width at half maximum (FWHM) and is affected by nonuniform strain. The fitting functions of the z-code consisted of Lorentzian, Gaussian, and exponential functions, so that a Voigt-type FWHM (convolution of Gaussian and Lorentzian profiles) was computed from the fitting results.
Another significant parameter is the peak intensity, which is related to the volume fraction of the constituent phase. The volume fraction of a phase is related to the measured intensities Ihkla and Ihklb by the following equation [119]:
Va=
m1∑ Ihkla Rhkla
m
1
m∑ Ihkla Rhkla
m +1
n∑ Ihklb Rhklb
n (13)
where Rhkla and Rhklb are the calculated integrated intensity for a phase and b phase (when the volume fraction of a phase equal to that of b phase) with a random grain orientation distribution (no texture). The n and m are the number of diffraction peaks for each phase. All these parameters can be obtained by Rietveld refinement of neutron diffraction profiles.
2.1.4 Neutron diffraction application in steels
In recent decades, in situ neutron diffraction has been used to study the deformation behavior of steel [120-122], considering different phases, oriented grains, and residual stress characterization in different regions after welding, and kinetic behavior [123-125] of recovery, recrystallization, precipitation and phase transformation. Compared to conventional methods, microscopic parameters such as lattice strain/stress, density, dislocation type and arrangement, and crystallite size and texture can more accurately be obtained through the neutron diffraction profiles.
Other applications for neutrons is small-angle neutron scattering [126], which
25
enables microstructural characterization from near atomic scale to near micrometer scale, and Bragg-edge transmission imaging [127,128] used for millimeter scale imaging for macroscopic investigation of the crystallographic properties of bulk materials. In this study, the focus was on monitoring internal stress changes during heat treatment and deformation
2.2 Nanoindentation studies of bulk materials
2.2.1 Nanoindentation
Hardness measurements are commonly used to test the mechanical properties of materials as they are easy, quick, and inexpensive. Brinell [129]
introduced a test where a hard sphere is pressed into a specimen and the ratio of the applied force and surface area of contact was defined as the hardness.
This test has been modified in the popular Vickers and Knoop methods [130] but the underlying principle is the same.
The perspective of the development materials today could be described as
“smaller is stronger” [131]. Hence, we need to understand the mechanical properties at the nano-scale. Nanoindentation is increasingly used to characterize the local mechanical properties of small volumes of material. On the nano-scale, atomic-scale heterogeneities can have a significant effect on the measured hardness. The surface preparation, grain orientation, radius of the indenter, and the tip material can significantly affect the data [132,133]. The response to point contacts on the nano-scale can differ greatly from those observed on the macro-scale due to the influence of isolated defects.
Extremely low loads can be applied during testing and the small indentations cannot be analyzed using optical techniques; imaging techniques such as SEM are required, making the test unsuitable. This can easily be achieved using
26
depth-sensing indentation methods that record the applied load and corresponding displacement. This method measures nanoscale penetration depths, where the applied load is usually of the order of micro-Newtons. Unlike traditional methods, both the elastic and plastic deformation is recorded.
Figure 2-3 shows a typical loading profile and the corresponding load-displacement (P-h) curve measured during nanoindentation tests using a Hysitron TI 950 TriboIndenter. The peak load and loading rate can be set by the user. For some metals, the initial indentation behavior is completely elastic [134].
In the case of an elasto-plastic material, the data shows irreversible plastic deformation, e.g. the load-displacement curve often exhibits a sudden increase in displacement under load-control mode or decrease in load under displacement-control mode. This, so-called “pop-in” behavior, as shown in Fig.
2-3(b), will be described in next section.
2.2.2 Incipient plasticity (pop-in)
The displacement burst (abrupt jump in the data) shown in Fig. 2-3(b) has Fig. 2-3 Loading profile for typical indentation test (a). Load displacement
curve of ferritic steel (b).
27
been observed for both single crystal and polycrystalline materials [135], and explained by various mechanisms. For example, this pop-in behavior indicates dislocation emission. For examples, pop-in behavior indicates dislocation emission [136,137]; dislocation source activation [138]; surface oxide breakdown [139,140]; point defect source activation [141] and a pressure-induced phase transformation [142,143].
As shown in Fig. 2-3(b), a giant displacement burst (pop-in) is found at a load of ~200μN. The contact response before the pop-in can be found to be purely elastic following the Hertzian contact theory [144] as shown in eq. (14):
P=4
3E*R1/2h3/2 (14)
where P is the applied load, R is the indenter tip radius, and h is the displacement (or depth) 𝐸∗ is the effective modulus in the equation,
1
E*=(1-vi2)
𝐸𝑖 +(1-vs2) 𝐸𝑠
(15)
where 𝐸𝑖 and 𝑣𝑖 are the Young’s modulus and the Poisson’s ratio for the indenter, and 𝐸𝑠 and 𝑣𝑠 are the same parameters for the specimen. Previous studies calculated the maximum shear stress (τmax) at pop-in and the value agrees very well with the theoretical strength for various indenters [137,145].
Zhang and Ohmura [137] further analyzed TEM images just before and after pop-in, which illustrated that no dislocations were generated during pure elastic loading and unloading, as shown Fig. 2-4. Therefore, the deviation from the Hertzian curve marks an initiation of plasticity.
28
The maximum shear stress beneath the indenter and the shear modulus (G) are given as:
τmax=0.18(E*/R)2/3P1/3 (16)
G=E/2(1+v) (17)
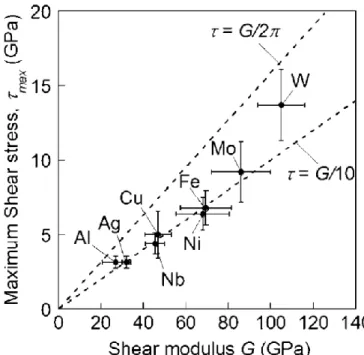
where E is Young’s modulus and v is Poisson’s ratio. The relationship between the maximum shear stress calculated from the critical load (Pc) and the shear modulus for a variety of single crystal metals is plotted in Fig. 2-5 [146]. All the data show a good linear relationship, and the coefficient of the relation is quite close to the value obtained from the classic Peierls potential model:
τ= b 𝑑’
G
2πsin2πx
b (18)
where b is the magnitude of the Burgers vector, d’ is the distance of the slip plane, and x is the displacement of an atom. By approximating b to be equal to d’, the maximum shear stress can be represented:
τmax=G/2π , (19)
which is consistence with the value in Fig. 2-5. Thus, it is expected that Fig. 2-4 (a) Scanning probe microscope (SPM) image of the indented group.
(b) Corresponding load-displacement curves. (c) The cross section of the marked area is observed by STEM [137].
29
dislocation nucleation occurs at the critical load (Pc). For more experimental measurements, Ohmura et al. compared the critical load (Pc) at “grain boundary”
and in “grain interior” for IF steel [147]. They argued that the grain boundary acts an effective dislocation source. Ahn et al. [148] showed evidence for yield behavior in mild steel, suggesting that the pop-in behavior in ferritic steel is closely related to the yield behavior. Thus, evaluation of the pop-in load (Pc) is important for understanding the macro yielding behavior.
Fig. 2-5 A linear relationship between the τmax calculated from the critical load (Pc) and the shear modulus G converted from the measured Young’s
modulus by nanoindentation for various materials [146].
The most common indenter shapes are spheres, cones, and pyramids. Each geometry has a unique pressure distribution during indentation, and hence, different load requirements for deformation. The Berkovich indenter is a commonly used one with blunt tips that elasticity plays a significant role. The larger contact area means that higher loads must be used to initiate plasticity.
However, the tip radius of the typical Berkovich indenter is too large to obtain the
30
information near the interface accurately. Therefore, the majority of present study has been done by a 60° pyramid indenter with a tip radius of 15nm.
Nagashima et al. also calculated the normalized yield stress (τmax/G) by using a sharp indenter (R = 25nm) for different specimens [149]. Their results agreed well with the results using a typical Berkovich indenter (R = 40, 100nm). Since this sharp indenter can reach critical stresses at very low loads, to obtain Pc, the specimen surface was indented with a maximum load of 20μN. The tip radius was calibrated in the penetration depth range from a few microns to hundreds of microns on fused quartz [150].
31
3 Origins of internal stress/strain of pearlite steels
3.1 Introduction
As described above, the in situ neutron diffraction has been proved as an effective method for the detection of average bulky information is steels during some extreme conditions such as transformation and deformation. Recently, the fast collection of full diffraction peaks using the TOF method allowed analysis of changes in the volume fraction, residual strain, texture, and dislocation density during dynamic processes.
Pearlite transformation in eutectoid steels is accompanied by a volume expansion of 4.76% which results in hydrostatic tensile stresses in austenite and compressive stresses in pearlite [9]. These internal stresses caused by the misfit transformation strains can be relaxed by plastic deformation near the interface.
EBSD results revealed that both the ferrite and cementite phases rotated gradually within an individual block [19]. These recent results indicate that the complex internal stresses generated during the pearlite transformation are accompanied by some stress relaxation mechanisms. The TEC mismatch between ferrite and cementite [33], also results in internal stresses being generated during cooling after transformation. However, quantitative bulk information cannot be obtained by microstructural observations. Therefore, in this chapter, the effect of pearlite transformation, cementite spheroidization annealing, and thermal misfit strain on diffraction line broadening as measured by in situ TOF neutron diffraction are discussed.
32
3.2 Experimental procedures
3.2.1 Specimen preparation
The in situ neutron diffraction experiments were carried out with TOF neutron diffractometer, ENGIN-X [151], at the Rutherford Appleton Laboratory of ISIS and TAKUMI [152], at the Materials and Life Science Research Facility of J-PARC. Cylindrical specimens were prepared for experiments using ENGIN-X and TAKUMI with dimensions of 8 mm × 12 mm length and 8 mm diameter × 30 mm length, respectively. The chemical composition of the alloy was 0.79 C, 1.98 Mn, 1.51 Si, 0.98 Cr, 0.24 Mo, 1.06 Al, 1.58 Co, and Fe balance (mass%).
3.2.2 In situ neutron diffraction at ENGIN-X
In situ neutron diffraction measurements during pearlite transformation were carried out using isothermal heating. The heat-treatment process is schematically illustrated in Fig. 3-1(a). The specimens were heated up to 1173K at a rate of 5K/s using a radiant furnace and held at that temperature for 1.8ks to obtain a single austenite microstructure. The temperature was controlled by a PID controller and measured using a thermocouple. The specimens were then cooled to 973, 923, 873, or 823 K at a rate of 1.3K/s and held at that temperature for isothermal pearlite transformation, then cooled in the furnace.
33
3.2.3 In situ neutron diffraction at TAKUMI
Two series of heat-treatment process were performed at TAKUMI. First, the specimen was heated up to 1173K using a radiant furnace and held for 1.2ks to obtain a single austenite microstructure. The sample was then cooled to 873K at a rate of 5K/s, held for 5.4ks to complete pearlite transformation, and again heated up to 973K with isothermal holding for 30.7ks to achieve cementite spheroidization (see Fig. 3-1(b)). Second, as shown in Fig. 3-1(c), the specimen was heated stepwise and held at 373, 473, 573, and 873K for 0.6ks each. After austenization at 1173K for 0.6ks, the specimen was cooled at a rate of 10K/s to 873K and held for 1.8ks for pearlite transformation. Subsequently, the specimen was cooled stepwise to ambient temperatures.
Fig. 3-1 Schematic diagrams of the heat-treatment schedules: (a) pearlite transformation experiment using ENGIN-X. (b) cementite spheroidization annealing and (c) heating and cooling process performed using TAKUMI.
34
3.3 Results and discussion
3.3.1 Transformation and coherent strains
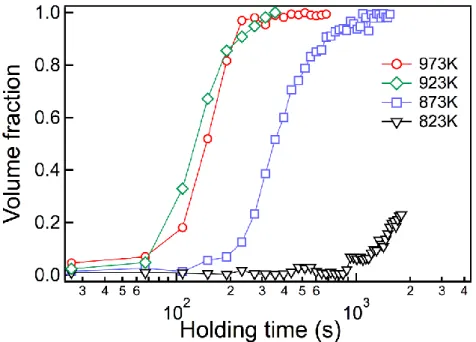
The pearlite volume fraction was determined from the obtained diffraction profiles using the GSAS Rietveld refinement software [153]. Cementite peaks were not observed due to the insufficient sliced time interval of 60s. Thus, the volume fraction of cementite was considered negligible. As shown in Fig. 3-2, the nose of the TTT curve for pearlite transformation was around 923K and the transformation was incomplete at 823K after 1.8ks. The microstructures of the pearlite isothermally transformed at different temperatures are shown in Fig. 3-3.
The ferrite/cementite lamellar spacing measured by the linear sectioning method using SEM micrographs obtained after cooling the samples to RT were 238μm for 973K, 100μm for 923K, 71μm for 873K, and 63μm for 823K.
Fig. 3-2 Volume fraction of pearlite evolution during transformation at 973, 923, 873, and 823 K.
35
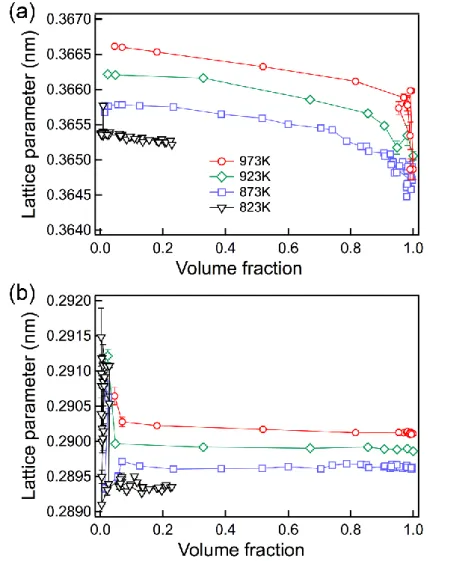
The changes in the lattice parameters of FCC austenite and BCC ferrite as a function of pearlite volume, as shown in Fig. 3-4. The austenite lattice parameter decreased with increasing pearlite volume fraction at all temperatures. Here, the large scattering in the data at the beginning of the transformation was attributed to low statistical reliability due to the small ferrite volume fraction. Similarly, data for austenite near the end of transformation also exhibited a large amount of scattering. The lattice parameter of untransformed austenite decreases with the progress of pearlite transformation at all the temperatures. On the other hand, the ferrite lattice parameter presents a slight decrease during holding. Therefore, the possible reasons for the decrease in lattice parameter of untransformed austenite can be drawn: (1) the generation of transformation strains and (2) the change in carbon concentration in untransformed austenite with the progress of
Fig. 3-3 SEM images of the microstructures isothermally transformed at (a) 973K, (b) 923K, (c) 873K and (d) 823K.
36
pearlite transformation. The details are still open for future discussion.
FWHMs of austenite (111) and ferrite (200) are plotted in in Fig. 3-5, respectively. The magnitude of the FWHM depended on the transformation temperature in both cases. The difference in FWHM between 973K and 823K was much larger for ferrite than austenite. In the case of ferrite, it is presumed that the internal stresses were generated by the pearlite transformation strain and also by coherent strains at the ferrite/cementite interface. Hence, the dependence of FWHM on the transformation temperature for ferrite is thought to
Fig. 3-4 Change in lattice parameters for austenite (a) and ferrite (b) during transformation at different temperatures.
37
be proportional to the ferrite/cementite interface area per unit volume. Generally, the internal stresses caused by either phase transformation or coherent interface strains result in shifts and line broadening of diffraction peaks of each constituent phase [125,154,155]. The averaged internal stress for each constituent phase is called phase stress and results in diffraction peak shift as shown in Fig. 3-4, while the local stress distribution makes peak broadening.
If the temperature is maintained at a high value after cementite plates form, cementite spheroidization will occur. Although the cementite spheroidization mechanism is very complicated [37], the ferrite/cementite interface area per unit
Fig. 3-5 Change in FWHM values for (a) austenite (111) and (b) ferrite (200).
38
volume is thought to decrease continuously with annealing. Consequently, a decrease in FWHM for the ferrite peaks should be observed. Cementite spheroidization annealing was performed at TAKUMI (the heating profile was shown in Fig. 3-1(b). Figure 3-6 shows a 2D color map of the changes in the diffraction profile during heat treatment, including austenization, pearlite transformation, and cementite spheroidization. The peak of austenite (111) disappeared (labeled A in Fig. 3-6(b)) during cooling to 873K, indicating complete transformation, and the intensity of ferrite (110) increased. Meanwhile, the cementite spheroidization annealing started during isothermal annealing at 873K. As shown in Fig. 3-7, the FWHM of the ferrite (200) peak decreased slightly and then decreased drastically upon re-heating to 973K.
39
Fig. 3-6 (a) 2-D profiles, where (b) shows an enlarged view of the diffraction patterns of austenite (111) and ferrite (110) indicated by the dashed box in (a). The dark purple color corresponds to the background intensity, while the
maximum intensity is shown in red. Arrow A corresponds to the end of transformation.
40
Finally, all cementite plates changed to spheroidal structures, as shown in the RT SEM image (Fig. 3-8). Therefore, it is proposed that the FWHM is dependent on the total area of the ferrite/cementite interface in the unit volume. Cementite spheroidization began during isothermal holding at 873K and the kinetic behavior was analyzed by comparing the FWHM valuess at 873K and 973K. The Arrhenius equation is a well-known relationship showing the dependence of diffusion on temperature:
k=Ae-Q/RT (20)
where k is the diffusion constant; A is a constant, same dimension as value k; Q is the activation energy, R is the universal gas constant, and T is the absolute temperature in Kelvin. Although only two data sets were available, the activation energy calculated from the Arrhenius plot shown in Fig. 3-9 for the cementite spheroidization calculated from the FWHM data was 60.9kJ/mol, This value is close to that for the bulk diffusion of carbon atoms in the ferrite phase (84.1kJ/mol) and much smaller than that of Fe (137.8kJ/mol) [156].
Fig. 3-7 Evolution of FWHM values of ferrite (200) diffraction peak during pearlite transformation followed by heating for cementite spheroidization.
41
3.3.2 Thermal strain
The internal stresses are generated after cooling due to mismatch in the thermal expansion coefficients of ferrite and cementite [33]. As shown in Fig.
3-10, FWHM values for (110) and (200) ferrite peaks measured during heating and cooling. The change in the FWHM for ferrite (200) was approximately 4μs
Fig. 3-8 SEM image of pearlite obtained by isothermal annealing after cooling to room temperature.
Fig. 3-9 Linear relationship between k and 1/T for the carbon diffusion according to the Arrhenius relationship.
42
(TOF), which was larger than that of the ferritic steel plotted for reference. The FWHMs increased again during cooling, which was not observed from XRD data [20]. The difference in the FWHM at 973 K between pearlite and the reference ferritic steel was 25μs for ferrite (200). This suggests that the contribution of the thermal misfit strain to the FWHM was approximately 16% of that of the ferrite/cementite coherent misfit strain.
Generally, the internal stress caused by thermal contraction mismatch causes peak shifts in ferrite-austenite alloys [157]. Since the lattice parameter for the stress-free condition is difficult to estimate, the diffraction peak shift cannot be obtained. In addition, considering the anisotropic thermal expansion coefficients for different cementite unit cell axes, it is considered reasonable that thermal misfit strain causes large line broadening for pearlite steels.
3.4 Conclusions
Possible origins of line broadening were investigated by in situ neutron Fig. 3-10 Change in FWHM of the (a) ferrite (110) and (b) ferrite 200 diffraction
peaks upon heating then cooling after pearlite transformation. Data for a ferritic steel is shown for a reference.
43
diffraction. The main conclusions from this chapter are summarized as follows:
1. Ferrite peak broadening due to internal stresses was caused by both coherent and thermal strain. The contribution of the thermal strains to line broadening was approximately 16% of that from coherent strains.
2. The decrease in the lattice parameter of the austenite phase may be related to the generation of transformation strains or the change in carbon concentration in untransformed austenite with the progress of pearlite transformation.
3. Neutron scattering measurements provide more useful information at elevated temperature due to the high penetration depth into a specimen.
44
4 Yielding behavior of pearlite steels
4.1 Introduction
The typical yield behavior of polycrystalline materials in tensile tests is the smooth transition from the elastic to plastic region with a gradually increase before necking occurs. However, the others displaying the yield behavior show an abrupt transition (yield drop) from the elastic to plastic region. Then plastic deformation takes place locally in deformation bands within a nearly constant stress until the whole specimen is deforming. After that, the stress-strain curve will go up as usual showing a typical strain-hardening behavior. These deformation bands are readily observed in situ by the appearance of what is called “Lüders bands”. Lots of investigations have been carried out to discuss this yield behavior in the last decades. Most efforts to explain the yield behavior is based on micromechanical approaches like the Cotrell-Bilby atmospheres [158]. Cotrell-Bilby atmospheres do not only produce Lüders bands, they are also responsible for strain aging. This means that dislocations can be locked by these atmospheres. As a result, the dislocations become immobile and prevent the specimen from homogenous deformation by dislocation motion [159]. In contrast, a continuous yielding occurs for patented pearlite [50,54] and cementite speroidized specimen [28,61], while a discontinuous yielding with clear Lüders bands appears after cold-working [54]. Therefore, a complete explanation of discontinuous or continuous yielding in eutectoid steels has not been presented yet. These yielding behaviors in many different materials are interesting and call for a common explanation.
As described in Chapter 3, high misfit strain exists near the ferrite/cementite
45
interfaces. If the plastic initiation easily occurs near these interfaces, the macro yielding will exhibit a continuous type. Therefore, the objective of this chapter is to clarify the continuous/discontinuous yielding from the viewpoint of dislocation emission sites.
4.2 Experimental procedures
The chemical composition of the steel used in this study (SK5: JIS G 4401) was 0.85 C, 0.25 Si, 0.40 Mn, 0.009 P, 0.004 S, and balance Fe (mass %). The steel ingot was austenitized at 1173K for 3.6ks, followed by hot-rolling at 1143K to reduce the thickness, and then air cooling (patenting). The patented sample with a full pearlite structure is hereafter called specimen A, where the cementite volume fraction and pearlite lamellar spacing were 14 vol.% and 205nm, respectively. Specimen B was prepared by annealing specimen A at 973K for 810ks in a vacuum furnace followed by furnace cooling (cementite spheroidization). Some specimen A pieces were cold-rolled to a reduction of 70%
and then annealed at 973K for 810ks, followed by furnace cooling to obtain the recrystallized ferrite matrix with spherical cementite particles (specimen C).
Details of the thermal processing are shown in Fig. 4-1.
Tensile tests were performed using plate specimens with the parallel gauge Fig. 4-1 Schematic diagrams of the heat treatment process: (a) lamellar pearlite obtained from the company; (b) cementite spheroidization treatment,
and (c) ferrite recrystallization process. AC: air cooling; FC: furnace cooling.
![Fig. 1-4 Thermal expansions coefficients in the temperature range RT to 1023 K [32].](https://thumb-ap.123doks.com/thumbv2/123deta/9914670.1917728/13.892.209.657.458.817/fig-thermal-expansions-coefficients-temperature-range-rt-k.webp)
![Fig. 1-6 Stress-strain curve of pearlite steels [53].](https://thumb-ap.123doks.com/thumbv2/123deta/9914670.1917728/17.892.230.636.665.1024/fig-stress-strain-curve-pearlite-steels.webp)
![Fig. 1-7 Phase strains as a function of the applied load for patented [71], swaged after annealed [72], and cold-drawn [73] pearlite steels](https://thumb-ap.123doks.com/thumbv2/123deta/9914670.1917728/19.892.221.638.246.621/phase-strains-function-applied-patented-swaged-annealed-pearlite.webp)
![Fig. 1-10 Intergranular strain versus applied stress of a ferrite-austenite alloy. The volume fraction of ferrite is 32.6 % [99].](https://thumb-ap.123doks.com/thumbv2/123deta/9914670.1917728/24.892.183.718.496.993/intergranular-strain-versus-applied-ferrite-austenite-fraction-ferrite.webp)