T itle
On the relation between the interfacial charge of a discharging
nozzle and electrification of a liquid microjet
A uthor(s )
K urahashi, Naoya; S uzuki, T oshinori
C itation
C hemistry L etters (2018), 47(1): 16-19
Is s ue D ate
2018-01
UR L
http://hdl.handle.net/2433/230211
R ig ht
©
2018 T he C hemical S ociety of J apan; T his is an open access
article.
T ype
J ournal A rticle
On the Re
l
at
i
on between the Inter
f
ac
i
a
l
Charge o
f
a D
i
scharg
i
ng Nozz
l
e
and E
l
ectr
ifi
cat
i
on o
f
a L
i
qu
i
d M
i
crojet
Naoya Kurahashiand ToshinoriSuzuki*
Department ofChemistry, Graduate SchoolofScience, Kyoto University, Kitashirakawa Oiwake-cho, Sakyo-ku, Kyoto 604-8502, Japan
E-mail: [email protected]
Aliquid microjet dischargedfrom afused silica capillaryis electrified, and the polarity ofthis electrificationis opposite to that ofthe net charge at the solidliquidinterface ofthe capillary nozzle.
Keywords: Liquid microjet | Fused silica | Capillary nozzle
Liquid microjets, cylindrical streams of liquid with a diameter oftens ofmicrometers, are now widely employedin photoelectron spectroscopy of liquids1and gas-surface scattering experiments.2The smallsurface area ofthe microjet minimizes evaporation ofsolvent molecules andfacilitatesintroduction of volatileliquidsinto high-vacuum chambers. However, a liquid microjetis electrically charged, because the liquidflow shears offan electric doublelayer at theinner wallofa capillary nozzle to create unequalnumber densities ofcations and anionsin the mobile part oftheflow (flow electrification).3,4
In a previous study,5we showed that the electric potentialof aliquid microjet ofNaX solution (X=Cl, Br, and I) varies with the electrolyte concentration. A notable commonfeature ofthe variation was that the polarity ofthe potentialreverses at around a concentration of30 mM (Figure 1), suggesting that Na+plays
a key rolein determining the polarity. In the present work, we discuss the relation between the electric charge at theinner wall ofa capillary and the microjet.
The electric potential(ºd)in the diffuse region ofan electric doublelayeris described by the PoissonBoltzmann equation as follows,
r2ºd¼ e
¾0¾r
ZþNþe
eZþºd
kBT þZ N e eZ ºd
kBT
ð1Þ
whereeis the elementary charge,¾0and¾rare respectively the permittivity of vacuum and the relative permittivity of a solution, Z« and N« are respectively the charge and number
density ofpositive/negativeions,kBis the Boltzmann constant, andTis the temperature. Equation 1 cannot be solved analyti -cally. However,ifthe electric potential is sufficiently smallsuch that thefollowing condition holds,i.e.,
eZºdðlÞ
kBT
<1 ð2Þ
an approximate solution can be expressed as
ºdðlÞ ºOHPe ¬
ðl lOHPÞ
ð3Þ
wherelis the distancefrom theinner wallofthe capillary,ºOHP is the electric potentialat the outer Helmholtz plane (OHP), and
lOHPis the position ofthe OHP.¬is the inverse ofthe Debye length, defined as
¬¼
ffiffiffiffiffiffiffiffiffiffiffiffiffiffiffiffiffiffiffiffiffiffiffiffiffi X
i
2Z2
ie
2c
¾0¾rkBT s
ð4Þ
wherecis the concentration ofthe solution.ºOHP is related to theinterfacialchargeº0by
ºOHP¼º0þ ·ad ¾0¾r
lIHP
·surfþ·ad 2¾0¾r
lOHP ð5Þ
where·surf is the originalcharge density ofthe solid surface, ·ad is the charge density of the adsorbedions, andlIHP is the position of the inner Helmholtz plane (IHP). The relative permittivity is assumed to be the same in all regions of the solution. Then, the continuity conditionsfor the electricfield and the potentialat the OHP yield
ºOHP¼ 1
¬
·surfþ·ad 2¾0¾r
ð6Þ
Ifeq 2 holds, the charge densityin the diffuselayeris given by
μe ZþjZ jce
eZþºdðlÞ
kBT þZ jZ
þjce
eZ ºdðlÞ
kBT
ð7Þ
SinceZþ¼1andZ ¼ 1for NaX, eq 7 simplifies to
μðlÞ 2ceºOHPe ¬ðl lOHPÞ
ð8Þ
This equation shows that the excess chargein a diffuselayeris oppositein sign to bothºOHPand·surfþ·ad. Although eq 3is valid onlyfor smallºd, the opposite signs ofμand·surfþ·ad are expected to be general.
In this study, we examine the relation between the signs ofμ
and·surfþ·adby measuring the streaming currents and surface Figure 1. Surface potentials of liquid microjets of aqueous
NaX solutions measured by photoelectron spectroscopy.5
potentials of liquid microjets ofaqueous NaI solutions using a chemically-modifiedfused silica capillary (GL Science FunCap-CE/Type A).6,7This capillary has an amino group chemically bonded to a silanol(SiOH) group on afused silica surface, so that ·surfþ·ad is always positive at pH¼7 regardless ofthe concentration ofNaI. After confirmation ofthe relation between
μand·surfþ·ad, we present a modelthat explains the reversal ofa surface potentialofaliquid microjet with the concentration ofNa+.
A gradient-flow HPLC pump (JASCO PU-2089) was used to flow an aqueous NaI solution to a capillary nozzle. The capillary wasinsertedinto a short section ofPEEK tubing (inner diameter: 0.38 mm, outer diameter: 1/16inch,length: 8.0 mm), leaving a 1.0-mm length of the capillary protruding from the tube, and wasfixed using a 1/16inch stainless-steelSwagelok fitting. This was then connected to the HPLC pump through a longer length of PEEK tubing (inner diameter: 0.130.25 mm, length: 1.5 m). After emerging from the capillary, the liquid microjet remained continuousfor alength ofabout 3 mm, after which the jet disintegrated into droplets. The capillaries were passivated prior to experiments by flowing pure water (or aqueous NaI solution) for more than 2 hours. The sample solutions were prepared using ultrapure water (LC/MS grade, resistivity: 2 M³cm, Wako) and sodiumiodide (99.5%, Wako). To measure the streaming current in air, a copper electrode was placed 5 mm or farther from the nozzle and the current flowing throughit was monitored using a picoammeter (Keithley 6485/J). The actual electric potential of the microjet was measured in vacuum by He(I) photoelectron spectroscopy (PES) using a hemispherical electron energy analyzer (Scienta SES100). The design ofour photoelectron spectrometer has been describedin detailelsewhere,8although the apparatus has been slightly modified such that the liquid microjet axis is vertical and the electron detection axis is horizontal. This modification hasimproved the vacuum conditions and enabled us to downsize the vacuum pump of the main chamber from a cryopump (20000 L s¹1) to a turbomolecular pump (2000 L s¹1). Theliquid surface potential, surf, is calculatedfrom the observed photo-electron kinetic energy (PKE) ofwater asfollows,
PKE¼h¯ IE surf ð9Þ whereIEis theionization energy.
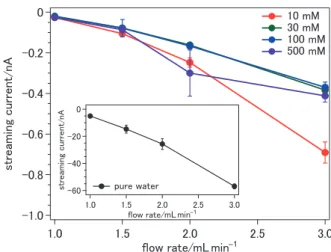
Figure 2 shows streaming currents measured asfunctions of flow rate and NaI concentrationfor a capillary with a positive surface charge. As seen in the inset, pure water provides a negative streaming current (the microjet was negatively charged). Aqueous NaI solutions exhibit considerably smaller streaming currents, because of enhanced electroconductivity; however, the polarity oftheir current is always negative. We have also measured the liquid surface potential from the photoelectron energy shift ofthe 1b1band ofgaseous water evaporatedfrom the microjet ofaqueous NaI solutions; the potentials of liquid microjets at concentrations of 15 and 100 mM were negative (¹0.11 V). These results support the relation between μ and
·surfþ·addescribed by eq 8.
As seenin Figure 1, the surface potentialofaliquid microjet discharged from an unmodified fused silica capillary changes polarity at a concentration ofabout 30 mM NaX (X=Cl, Br, and I). Similar behavior has been reported by Lübcke and colleagues for a streaming current of NaX solutions.9 These
results are well explained, if we assume that the interfacial charge of fused silica changes polarity depending on the electrolyte concentration. The interface between fused silica and an aqueous solution is usually negatively charged. The mostlikely value ofpKa2ofsilicais 4.5,10and pKa1has been calculated as¹0.25from theisoelectric point (pI=2)11andKa2. Thus,in NaI 10 mM solution, the SiOH groups are expected to existin the SiO¹, SiOH and SiOH2+forms with a distribution of74%, 26%, and 0%, respectively. Since SiOH2+is not present at the silica surface in the neutral aqueous solution, it is considered that charge reversal is caused by sodiumions.
Itis noted thatfused silicais regarded as hi gh-temperature-treated silica (HTT-silica), and that high temperature induces intermolecular dehydration ofSiOH groups to generate siloxane (SiOSi) bonds.12The surface density ofSiOH groups of HTT-silica has been estimated to be 0.7 nm¹2, while that ofsiloxane bondsis estimated to be aslarge as 12 nm¹2. Since the activation energy for hydrolysis of a siloxane bond is greater than 70 kJ mol¹1,13 its dissociation is negligible under our exper-imental conditions. Therefore, it is expected that the cations were preferentially adsorbed on SiO¹ groups, while additional adsorption to siloxane bonds may have also been possible.
The adsorption equilibrium constant K can be predicted from thefree energy change upon adsorption¦Gasfollows,
G¼ RT lnK ð10Þ
In terms ofthe centercenter distance between an adsorption site and an adsorbed cationrad, the changein the Coulomb potential energy upon adsorption onto this siteis given by (Figure 3)
U¼ e
2
4³¾0¾rrad
ð11Þ
Several experimental and theoretical studies suggest that both a silicasolution interface and an adsorbed ion hold hydration shells.14,15 Thus, the distance between a SiOH site and an adsorbed cation is estimated to be 660 pm. The effective dielectric constant for water varies with electric field strength,
−1 −1
and the effective relative dielectric constant at the radius ofthe hydration shell is estimated to be 12«3.16The changein the Coulomb potential energy is then calculated to be ¹17«3 kJ mol¹1,infair agreement with
¦G=¹8.0 kJ mol¹1for sodium halide aqueous solutions and negatively charged SiOH groups.17 We consider the siloxane bond sitesin a similar way. The properties of the surface siloxane bonds are expected to be similar to those ofthe disiloxane (SiH3OSiH3) molecule. The bondlengthfor SiOis 163.4 pm and the bond anglefor SiO Si is 144.1°.18From the dipole moment (0.24 D), the effective charge ofsilylgroups in disiloxane molecules is calculated to be+0.050 e, with the oxygen atom having a charge of¹0.10 e. When the siloxane site and adsorbed ion are both hydrated, the effective relative permittivities are calculated to be approx-imately 75 around a siloxane bond and 4045 around a cation.16 Using these values, the changein Coulomb potentialenergy was calculated to be¹0.36 kJ mol¹1.
The chemical equilibria at the surface of HTT-silica are expressed asfollows,
SiO þHþ
SiOH Ka2
SiO ½Hþsurf
SiOH
ð12Þ
SiOHþHþ
SiOHþ
2 Ka1
SiOH½Hþsurf
SiOHþ
2
ð13Þ
SiO þNaþ
SiONa K1
SiONa
SiO ½Naþsurf
ð14Þ
Si2OþNaþSi2ONaþ K2
Si 2ONaþ Si2O½Na
þ
surf ð15Þ
whereΓXis the surface density ofgroup X. From the¦Gvalues estimated earlier, we obtained K1 and K2 as 950 and 1.2, respectively. The totalsurface densities ofsilanoland siloxane are
SiOt¼SiO þSiOHþSiOHþ2 þSiONa ð
16Þ
Si2Ot¼Si2OþSi2ONaþ ð17Þ
The surface ion densities [X]surf are determined from the
Boltzmann equation usingºOHPand the partitionfunctionNX:
½Hþ
surf¼NHþe
eºOHP
kBT ð18Þ
½Naþ
surf¼NNaþe
eºOHP
kBT ð19Þ
NX is approximated as the bulk concentration cX. Under the condition
eºOHP
kBT
>1 ð20Þ
ºOHP
·surfþ·ad 2¾0¾r
ln 2eW2ð2Þ 1
¬ ð21Þ
whereW(n)is the Lambert Wfunction. Theinterfacialcharge densityis expressed as:
·surfþ·ad¼eð SiO þSi2ONaþÞ ð22Þ
The coupled eqs 1222 can be solved numerically to find
ºOHP, from which the surface density of each group and interfacial charge density can be calculated, as shown in Figures 4 and 5, respectively. The calculations reveal that the interfacialchargeis zero at a concentration of6.0 mM, negative at lower concentrations and positive at higher concentrations (Figures 4 and 5). Charge reversal has been observed due to the interaction of multivalent cations on a silica surface.19,20 However, sodiumions have not been considered to contribute to chargeinversion.19Itis noted that previous experimentsformed theflow path by chemicaletching19and acid washing,20which possibly resultedin a siloxane-free surface.
Our simulation shown in Figure 5 indicates that the interfacial charge density increases monotonically at concen-tration greater than 6 mM, while the liquid surface potential (Figure 1)is saturated at high concentration. This discrepancy may suggest that mutual interactions between the adsorbed Na+
ions, which we neglected in our model, hinder adsorption of Na+at high concentrations.
Figure 3. Schematic view of a sodium ion adsorbed on a negatively charged SiOH group. Blue ellipses show the hydration water molecules and red arrows show the direction of the permanent dipole moment ofwater. Black dashedlinesindicate the radiiofthe hydration shells.
Figure 4. Calculated number density of surface groups of HTT-silica as a function of Na+ concentration. The apparent
charge densityis shown by the red and blue solid curves. The point at which the number density ofred and blue are equal is the point ofzero charge. The surface density ofthe positively charged silanol groups ðSiOHþ
We have attempted to determine adsorption equilibrium constants from the temporal change in the potential when changing the salt concentration. However, wefound that thefirst stepis asfast orfaster than theinstrument’s time resolution. In the nearfuture,it willbe necessary to measure the adsorption equilibrium constant byimproving measurement time resolution. Since the electric potential of a microjet varies with the flow rate, and possibly with the actualdimensions ofa capillary, we therefore demonstrate here only qualitative behavior for the charge reversal phenomenon based on the hypothesis of two adsorption sites on thefused silica surface. Further confirmation of this phenomenon requires determination of the equilibrium constants and spectroscopic detection of ion adsorption at the fused silica surface.
The authors thank Morihiko Onose, Junichi Nishitani, Christopher W. West, Shotaro Kudo, Ayano Hara, Ryuta Uenishi, and Stephan Thürmerfor their experimentalassistance.
Supporting Information is available on http://dx.doi.org/ 10.1246/cl.170892.
References
1 B. Winter, M. Faubel,Chem. Rev.2006,106, 1176. 2 D. K. Lancaster, A. M. Johnson, D. K. Burden, J. P. Wiens,
G. M. Nathanson,J. Phys. Chem. Lett.2013,4, 3045. 3 S. Levine, J. R. Marriott, G. Neale, N. Epstein, J. Colloid
Interface Sci.1975,52, 136.
4 W. L. Holstein, L. J. Hayes, E. M. C. Robinson, G. S. Laurence, M. A. Buntine, J. Phys. Chem. B 1999, 103, 3035.
5 N. Kurahashi, S. Karashima, Y. Tang, T. Horio, B. Abulimiti, Y. Suzuki, Y. Ogi, M. Oura, T. Suzuki,J. Chem. Phys.2014, 140, 174506.
6 S. Kodama, A. Morikawa, K. Nakagomi, A. Yamamoto, A. Sato, K. Suzuki, T. Yamashita, T. Kemmei, A. Taga,
Electrophoresis2009,30, 349.
7 Y. Iwamuro, R. Iio-Ishimaru, S. Chinaka, N. Takayama, S. Kodama, K. Hayakawa,J. Health Sci.2010,56, 606. 8 K. Nishizawa, K. Ohshimo, T. Suzuki,J. Chin. Chem. Soc.
2013, 60, 1403.
9 N. Preissler, F. Buchner, T. Schultz, A. Lübcke, J. Phys. Chem. B2013,117, 2422.
10 K. Leung, I. M. B. Nielsen, L. J. Criscenti, J. Am. Chem. Soc.2009,131, 18358.
11 Y. Duval, J. A. Mielczarski, O. S. Pokrovsky, E. Mielczarski, J. J. Ehrhardt,J. Phys. Chem. B2002,106, 2937.
12 L. T. Zhuravlev,Colloids Surf., A2000,173, 1.
13 J. P. Icenhower, P. M. Dove, Geochim. Cosmochim. Acta 2000, 64, 4193.
14 C. Park, P. A. Fenter, K. L. Nagy, N. C. Sturchio,Phys. Rev. Lett.2006,97, 016101.
15 A. M. Tikhonov,J. Chem. Phys.2006,124, 164704. 16 I. Danielewicz-Ferchmin, A. R. Ferchmin, Phys. Chem.
Chem. Phys.2004,6, 1332.
17 D. A. Sverjensky, Geochim. Cosmochim. Acta 2005, 69, 225.
18 R. Varma, A. G. MacDiarmid, J. G. Miller, Inorg. Chem. 1964, 3, 1754.
19 F. H. J. van der Heyden, D. Stein, K. Besteman, S. G. Lemay, C. Dekker,Phys. Rev. Lett.2006, 96, 224502. 20 G. R. Wiese, R. O. James, T. W. Healy,Discuss. Faraday
Soc.1971,52, 302.
Figure 5. Calculatedinterfacial charge density ofHTT-silica as a function of Na+ concentration. The point of charge