学位論文
Experimental Study of a Si/CdTe Semiconductor
Compton Camera
for the Next Generation of Gamma-ray Astronomy
次世代ガンマ線天文学のための
Si/CdTe
半導体コンプトンカメラの実証的研究
平成
20
年
12
月博士
(
理学
)
申請
東京大学大学院理学系研究科
物理学専攻
Abstract
A Compton camera is the most promising detector for gamma-ray astronomy in the energy band from a few tens of keV to MeV. Its detection method, based on Compton scattering kinematics, allows us to determine the direction of incident gamma-rays and significantly reduce background events caused by cosmic charged particle or detector ac-tivation in orbit. In this thesis, we describe a new Compton camera, named the Si/CdTe semiconductor Compton camera, which consists of many layers of position-sensitive Sil-icon and CdTe detectors. In order to verify the performance and to understand the detector response, we construct prototype Si/CdTe Compton cameras. The spectral
response is studied by taking charge sharing, charge collection efficiency and thermal
diffusion inside the Si and CdTe semiconductor devices used in the detectors. The
imag-ing capability with various kinds of gamma-ray targets, such as a point source, arranged point sources and extended sources, is examined. Utilizing the maximum-likelihood iter-ation algorithm, the extended source and adjacent sources were successfully deconvolved with its internal structure. The ability of polarization measurements, which is one of key features of the Compton camera, are demonstrated through the experiment at syn-chrotron beam facility. The direction of the polarization vector is determined to within
an accuracy of 1◦
Contents
1 Introduction 1
2 Sub-MeV/MeV Gamma-ray Astronomy 3
2.1 Study of the non-thermal universe . . . 3
2.2 Nucleosynthesis . . . 4
2.3 Positron astrophysics . . . 7
2.4 Polarization . . . 8
3 Principle of Compton Camera 11 3.1 The interaction of photons . . . 11
3.2 Compton Scattering . . . 12
3.3 The Compton Camera . . . 13
3.4 Uncertainties in angular determination . . . 14
3.4.1 Angular Resolution Measure (ARM) . . . 14
3.4.2 Effects of Incomplete measurements . . . 15
3.4.3 Doppler broadening effect . . . 18
3.5 Polarization measurement . . . 23
3.6 History of Compton camera . . . 25
4 Si/CdTe Semiconductor Compton Camera 31 4.1 Introduction . . . 31
4.2 Configuration of the Si/CdTe Compton Camera . . . 31
4.3 Development of Key Technologies . . . 36
4.4 Application of Si/CdTe Compton Camera to Future Missions . . . 37
4.4.1 Soft Gamma-ray Detector (SGD) . . . 37
4.4.2 DUAL Mission . . . 38
5 Development of Si/CdTe Compton camera 41 5.1 Required technologies . . . 41
5.2 Double-sided silicon strip detector (DSSD) . . . 42
5.2.1 Design . . . 42
5.2.2 Imaging and Spectroscopy . . . 43
5.2.3 High density stacked DSSD module . . . 47
5.3 In/CdTe/Pt CdTe pixel detector . . . 50
5.3.1 Multi layer stacked CdTe module . . . 52
5.4 Prototype of Si/CdTe Compton camera . . . 53
5.4.1 Objective . . . 53
5.4.2 Detector configuration . . . 53
5.4.3 Read-out System . . . 55
5.4.4 Analysis . . . 57
5.4.5 Image Reconstruction . . . 59
5.4.6 Spectral Performance . . . 59
6 Response of the Compton camera 63 6.1 Experimental Setup . . . 63
6.2 Compton camera simulator . . . 65
6.2.1 Hit generator . . . 66
6.2.2 Event generator . . . 67
6.2.3 High level analysis . . . 67
6.3 Two hit sequence Reconstruction . . . 68
6.3.1 Simple selection method . . . 68
6.3.2 Si/CdTe sequence reconstruction . . . 69
6.3.3 CdTe/CdTe sequence reconstruction . . . 71
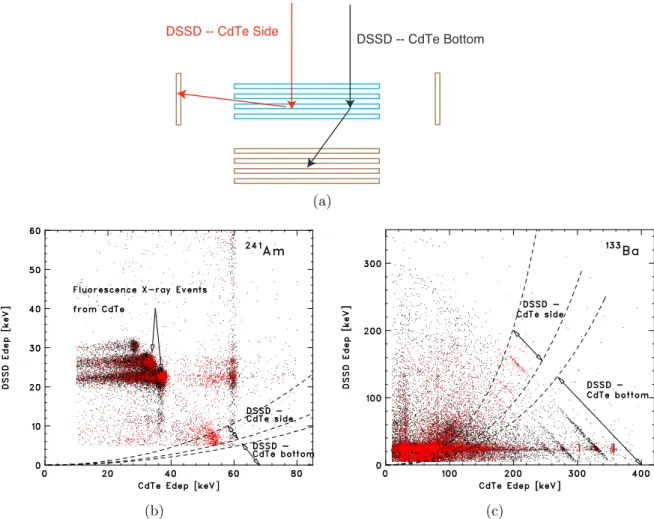
6.4 DSSD response . . . 73
6.4.1 Charge sharing in DSSD . . . 73
6.4.2 Implementation of the DSSD response into the Simulator . . . 76
6.5 In/CdTe/Pt pixel detector response . . . 79
6.5.1 The Shockley-Ramo theorem . . . 79
6.5.2 Extraction of µτ product . . . 79
6.5.3 Charge collection efficiency . . . 81
6.5.4 Charge sharing . . . 82
6.5.5 Reproduced spectrum . . . 84
6.6 Absolute detection efficiency . . . 86
6.6.1 Photo absorption mode . . . 86
6.6.2 Compton mode . . . 88
6.6.3 Field of view . . . 90
6.6.4 Effect of a clustering . . . 91
6.7 Angular resolution . . . 92
6.8 Summary . . . 93
7 Compton imaging capability by Si/CdTe Compton camera 95 7.1 The simple back projection algorithm . . . 96
7.2 The result of List-Mode Maximum Likelihood Expectation Maximization algorithm . . . 98
7.2.1 The point sources . . . 99
7.2.2 The extended sources . . . 101
7.2.3 The grid sources . . . 103
8 Polarization measurement 105 8.1 Measurement of the degree of polarization and its direction . . . 105
8.2 Experimental setup . . . 106
8.2.1 Si/CdTe Compton camera configuration . . . 106
8.2.2 Beam line setup . . . 108
8.3 Measurement of experimental azimuthal angular distribution . . . 110
8.4 Results . . . 111
CONTENTS iii
9 Performance study for a satellite mission 117
9.1 Soft Gamma-ray Detector onboard ASTRO-H . . . 117
9.2 Study for future all-sky survey mission . . . 119
9.3 Optimization of Si/CdTe Combination . . . 120
9.4 Detection efficiency . . . 123
9.5 Background Estimation and sensitivity . . . 129
10 Conclusion 135 A VATA analog ASIC 137 B Basic parameter of DSSD 139 C In/CdTe/Pt diode detector 143 C.1 Schottky CdTe diode . . . 143
C.2 Stability . . . 146
Chapter 1
Introduction
The hard X-ray and gamma-ray bands have long been recognized as important windows for exploring the energetic universe. It is in these energy bands that non-thermal emission, primarily due to accelerated high-energy particles, becomes dominant. The Compton Gamma-ray Observatory (CGRO) satellite, which operated from 1991 to 2000, revealed
that there are a variety of γ-ray sources. With its four onboard instruments, CGRO
covered a wide energy range, from 20 keV to 30 GeV. This wide energy coverage, six decades in photon energy, played an important role in studying the realm of non-thermal astrophysics.
We can expect a further revolution brought by the INTEGRAL[1], Suzaku[2],
Fermi[3]and other near-future missions. However, when compared with X-ray
astron-omy, hard X-ray and γ-ray astronomy are still immature. As clearly shown in Fig. 1.1,
the sensitivity of instruments is far from the level achieved by the current X-ray missions employing focusing telescopes in the energy band below 10 keV. The situation is
partic-ularly unsatisfactory in the region between ∼10 keV and∼100 MeV. In this “sensitivity
gap”, the jump at the low energy end comes from the fact that current X-ray mirrors
can-not focus hard X-rays. At energies above ∼100 MeV, sensitivity is recovered by utilizing
pair-production telescopes.
The universe in the sub-MeV to MeV energy band, from several hundred keV to a few MeV, is characterized by violent high energy phenomenon from most powerful and dynamic sources and also by nuclear transitions. The scientific objectives are spanning from compact objects as broad class annihilators, over long lived galactic radioisotopes. The non-thermal emission from these objects are the clue to study how the energy is concentrated to particle acceleration or extremely high temperature plasma. In order to study the non-thermal emission at these energy regions and to draw a more com-plete picture of the non-thermal universe, highly sensitive observations are important. In
particular, sub-MeV and MeV γ-ray observations to match observations at other
wave-lengths are indispensable, because the wide band emission is what we could expect from non-thermal emission . To this end, future high-energy instruments should provide much
improved angular and spectral resolutions over the instruments in use today. A γ-ray
telescope with one to two orders of magnitude better sensitivity than the current instru-ments, once realized, the observation will open up a new window of astrophysics with the application of elementary particle physics, general relativity, relativistic plasma-physics and electrodynamics, quantum theory and even cosmology.
While the total cross section has its minimum at a few MeV, the energy range between
several hundred keV and about 30 MeV is dominated by the Compton effect. At these
energies, the detection method based on Compton effect is the most promising technique
to achieve high sensitivity by suppressing background as demonstrated by COMPTEL
[4,5,6,7,8]on board CGRO (Compton Gamma-Ray Observatory) satellite.
In this thesis, the development, building, and various experimental studies of the Si/CdTe Compton camera are presented together with the results of simulation as the
new instrument for the next generation of γ-ray astronomy. Chapter 2 reviews the
im-portance of sub-MeV/MeV gamma-ray astronomy. In Chapter 3, interaction of γ-ray
and principles of a Compton Camera are summarized with some histories of application of Compton camera to astrophysics. In Chapter 4, we introduce our Si/CdTe
semicon-ductor Compton camera as a promising candidate for future γ-ray detector featuring
both high imaging quality and good spectroscopic capability, and thus high sensitivities. Chapter 5 describes the developments of the Si/CdTe Compton camera. In Chapter 6, we investigated the response of the Compton camera. New simulation code which includes
the effects of charge sharing and diffusion in the device has been developed. Chapter 7
describes the imaging capability of the Compton camera based on experiments with both
point and diffuese sources. Polarization measurements are expected to provide a
power-ful prove into high-energy emission mechanisms as well as the distribution of magnetic fields, radiation fields and interstellar matter. Chapter 8 demonstrated the ability as a polarimeter through the tests at accelerators of SPring-8. Finally, in Chapter 9, we study the optimum design of Si/CdTe Compton Camera for the use in the next generation of
γ-ray astronomy.
Chapter 2
Sub-MeV/MeV Gamma-ray
Astronomy
2.1
Study of the non-thermal universe
The sub-MeV/MeV gamma-ray sky is mainly characterized by non-thermal emission from “cosmic accelerators”, where a part of thermally distributed particles is picked up to rel-ativistic energies by some acceleration mechanisms. Such cosmic particle accelerators are believed to be common in the universe. These particles are observed nearby solar flares, pulsars, X-ray binaries (XRBs), super nova remnants (SNR), and at cosmological distances, active galactic nuclei (AGN) or gamma-ray bursts (GRB). Even clusters of galaxies give some hints of such particle acceleration. The main energy source powering these particle accelerators varies among source classes, that is, release of gravitational energy, magnetic rotational energy, electromagnetism energy and nuclear energy. How-ever, more detailed emission scenarios are still unknown: how the particle energy is converted to radiation, what are the emitting geometries and the spatial distribution of matter/plasma, and what are the relevant physical parameters and their values.
Super Nova Remnants
Shocks in Super Nova Remnants (SNR) were long thought to be the major sites of particle accelerations in our Galaxy. Several hard X-ray observations of young SNRs, such as
SN1006[9]and RXJ 1713.7–3946[10], reveal that the non-thermal X-ray emission is
produced via the synchrotron mechanism from the non-thermally distributed electrons reaching tens of TeV. On the other hand, GeV and TeV emission is produced by either inverse Compton from the same electron population or by secondary photons decayed
fromπ0 produced by photon interactions. Therefore, observing the sub-MeV/MeV range
will distinguish these scenarios and shed new light on whole-picture SNRs.
Active Galactic Nuclei
The Compton Gamma-Ray Observatory (CGRO) showed that nuclear activity in galaxies produces extraordinarily powerful and rapidly variable fluxes of gamma rays. The only compelling explanation is that a supermassive black-hole engine at the center of a galaxy
generates this emission. The active galactic nuclei (AGN) that have been detected at gamma-ray energies fall into two distinct classes. The first class includes radio galaxies
and Seyfert AGNs with redshifts z < 0.1 and > 50 keV luminosities between 1040–
1045 ergs/s. The OSSE[11]and COMPTEL[4,5,6,7,8]onboard CGRO provides
strong evidence for spectral softening or cutoffs above 100 keV for these AGNs. Blazars
comprise the second class of gamma-ray emitting AGNs. These include BL Lac objects, core-dominated flat spectrum radio quasars, and highly polarized and optically violently variable quasars. Blazars emit strong fluxes at 0.1–10 MeV, and the bulk of their power output is often concentrated on these energies or higher.
Galactic Black Hole
Results from CGRO show that galactic black hole candidate sources are bright at MeV gamma-ray energies, and display a wide range of spectral states both individually and among classes. Black hole X-ray binaries such as GX 339–4 and Cygnus X–1 undergo a series of transitions from the bright, soft X-ray state to the dimmer, hard gamma-ray state where the photon energy of peak power output is at hundreds of keV.
Neutron Stars
&
Pulsars
Neutron stars, both accreting neutron stars and radio pulsars, are known to be strong continuum sources above 100 keV. However, the phase resolved continuum spectra from radio pulsars are indicators of the emission mechanism, as most of the emitted power is in gamma-ray photons. Particle acceleration and photon production mechanisms in pulsar magnetospheres are still mysterious. The information about the polarization gives a clue to the problem, since such spectral features can be strongly dependent on the photon polarization; observation of polarized signals in the 100 keV–10 MeV band may discern whether or not the exotic QED process of photon splitting occurs.
2.2
Nucleosynthesis
At the endpoint of stellar evolution, gravity ultimately dominates over energy releases through nuclear fusion, in the case of a massive star leading to a violent explosion. Observing gamma-ray line signatures from radioactive isotopes synthesized during such explosions is a powerful means to prove the physical conditions and mechanisms that drive these events.
2.2. NUCLEOSYNTHESIS 5
Table 2.1: Radioactivities in Nova Ejecta
Isotope Life time Decay chain line energy (keV) 7Be 77 days 7Be
→7Li∗ 478
56Ni 111 days 56Ni
→56Co
→56Fe+e+ 158, 812; 847, 1238 57Ni 390 days 57Ni
→57Fe∗ 122
22Na 3.8 years 22Na
→22Ne∗+e+ 1275 44Ti 89 years 44Ti
→44Sc
→44Ca∗+e+ 78, 68; 1157 26Al 1.04
×106years 26Al
→26Mg∗+e+ 1809 60Fe 2.0
×106years 60Fe
→60Co∗
→60Ni∗ 59, 1173, 1332
of Universe. Radioactive nuclei and the decay products during this event are the most direct tracers of the physical condition of the explosion.
The main radioactive nuclei synthesized in novae, that are relevant for the gamma-ray emission, are presented in Table 2.1. Note that these are the sources whose existence has already recognized. The sub-MeV/MeV energy band is very attractive to study the nu-cleosynthesis in the universe. But, the line flux from celestial objects is usually very weak
compared to the dominant non-thermal emissions, as low as 10−6
–10−5
photons cm−2
s−1
level, and only a handful of objects have been observed at present. In order to overcome this situation and open new doors in gamma-ray line astronomy, a new instrument should
achieve an order of 10−7
photons cm−2
s−1
for line sensitivity. Both the high energy
res-olution (∆E/E ∼ 1%) of the instrument and high background rejection capability are
essential.
26
Al Decay
The proton rich isotope 26Al decays to the first excited state of 26Mg at 1.809 MeV
with a mean lifetime of 1.04×10⁶ yr. This is the most apparent radioactivity in the sky.
Radioactive 26Al is presumably produced by explosive nucleosynthesis in core collapse
Type II supernovae, in novae or by hydrostatic nuclear burning in the interior of massive
stars (Wolf-Rayet stars etc). Due to its long decay time, 26Al decay traces galactic
nucleosynthesis processes over the past million years.
The HEAO–C discovered the 1.809 MeV gamma-ray line from radioactive26Al in the
Galaxy[12]. The COMPTEL has achieved a major breakthrough by generating the first
all-sky map[13,14]of the 1.8 MeV (Fig. 2.1). We see a line flux of ∼3×10⁻⁴
pho-tons cm−2
s−1
from the central Galaxy. The flux distribution along the Galactic plane is
not smooth, but clumpy with hot spots. The observed flux of 2×10⁻⁵
photons cm−2
s−1
from the Vela SNR is within the range of predicted 15 to 20 M!core collapse supernovae
yields, if the Vela distance is less than 400 pc[15]. Other localized source regions are
the Carina and the Cygnus region, and spiral arm regions.
60
Fe Decay
The neutron rich isotope,60Fe (1.5×10⁶ yr ), whose decay results in 1.173 and 1.333 MeV,
Figure 2.1: COMPTEL 1.8 MeV all-sky image[13]
source. RHESSI[16]and INTEGRAL may have detected line emission from 60Co, the
short-lived daughter of60Fe. The total flux is an order of magnitude smaller than 26Al.
The total galactic production as well as individual source yields of60Fe and26Al will
pro-vide unprecedented constraints on core collapse supernova nucleosynthesis calculations. If the nuclear flame proceeds slowly in the initial burning in thermonuclear supernovae,
a significant older stellar population could also be represented in the60Fe emission. The
spatial differences between these two million year radionuclides will teach us about the
nucleosynthesis of both within several classes of sources.
56
Ni Decay
Lines at 0.847 MeV and 1.238 MeV from the decay chain 56Ni→56Co→56Fe with their
characteristic 111-day decay time were first detected from the core-collapse supernova
SN1987A[17]in the nearby Large Magellanic Cloud, and measurements of a
thermonu-clear supernova SN1991T[18]in the far more distant Virgo cluster showed suggestive
line features from this even more significant source type (0.5 M! of 56Ni are expected
from typical thermonuclear SNe, while only 0.075 M! were ejected in SN1987A).
Sur-prisingly only upper limits were obtained from the thermonuclear supernova SN1998bu at a distance of 9 Mpc. The predicted 0.847 MeV line flux from thermonuclear supernovae,
which is expected to peak at 70 days after the explosion, is (6±3)×d (Mpc)−2
pho-tons cm−2
s−1
. Note that large expansion velocities of the ejected material broaden these
lines significantly (>5–50 keV line widths are expected for supernovae).
44
Ti Decay
The 1.157 MeV line from the decay-chain of 44Ti→44Sc→44Ca with its characteristic
2.3. POSITRON ASTROPHYSICS 7
tracer for young SNRs. The pioneering detection with COMPTEL of 44Ti decay in
Cas A[19]at (4.8±0.9)×10−5
photons cm−2
s−1
, the youngest Galactic SNR, confirms
44Ti production in core-collapse SNe. In these events, 44Ti is produced very close to
the separation line between ejected supernova material and the compact remnant star.
Therefore,44Ti gamma-ray line measurements uniquely prove this otherwise inaccessible
region of core collapse.
2.3
Positron astrophysics
511 keV line from electron/positron annihilation has been one of the important features of high energy astrophysics. For the past 30 years more than a dozen balloon and satel-lite observations have been reporting 511 keV annihilation line radiation from the general
direction of our Galactic Center (GC)[20,21,22]. Recent observation with the SPI
onboard INTEGRAL[23]have revealed that a significant amount of the positron
anni-hilation radiation comes from the galactic bulge region (Fig. 2.2). They have determined
a 511 keV flux of (8.7 ± 0.6)×10−4
photons cm−2
s−1
and a positronium fraction f =
0.98 ± 0.05. The spatial distribution of the 511 keV line emission is essentially
concen-trated within the central region of the Galaxy. However, the origin of the positrons is still unknown. The Compact objects, – Type Ia supernovae, novae, or low mass X-ray bina-ries (LMXB) – are believed to be the sites of positron production leading to the 511 keV emission in the inevitable process of annihilation. The observation of the characteristic 511 keV annihilation line signature and the accompanying three-photon continuum pro-vides a powerful tool to prove plasma composition, temperature, density and ionization degree.
Figure 2.2: (Left) INTEGRAL mapped the glow of 511 keV gamma rays from electron-positron annihilation. The map shows the whole sky, with the galactic center in the middle. The emission extends to the right.[23](Right) Spectrum of the Galactic Center region. The 511 keV annihilation lines are clearly observed.
[24]
Pulsars are potentially regarded as an important contributor[25]to the galactic
positron budget because they require the formation of electron-positron plasma in their pulsar magnetospheres. The nova and supernova are also believed to be important
con-tributors[26]. An escape fraction of ∼1% for the 56Co positrons produced in galactic
The detection of 511 keV annihilation line radiation from AGNs would markedly change our understanding of the condition in the innermost region near a black hole. The
most likely origin of the electron-positron pair in AGNs is through pair production fromγ–
γ attenuation, which requires energetic electrons and photons in a compact environment.
Although the detection of a broad pair annihilation line from Seyfert galaxies is the
most feasible if a non-thermal electron spectrum is present, OSSE[11]and INTEGRAL
[1]observations indicate that the Seyfert X-ray and γ-ray emission is mainly due to
thermal electrons scattering soft photons. Accordingly, a broadened annihilation line is not expected, though a narrow annihilation line from Seyfert galaxies could be formed if pairs escape from the center nucleus. For blazers, the composition of the jet plasma is not known, and the detection of transient pair annihilation lines would conclusively measure the amount of antimatter present in the jet.
The deep observation of the annihilation line with excellent angular resolution could reveal the numerous problems surrounding the nature of positron. The discovery of the annihilation line from any one of the point sources would shed light on the mystery because it provides the evidence of the positron production site. The DUAL mission (see Section 4.4.2) which features focusing of a gamma-ray will enable a point source search
with∼ 1 arcmin angular resolution. The high energy resolution of the Compton camera
(∆E/E ∼ 1%) placed on a focal plane allows the detailed line-shape analysis probing of
the production sites and their physical condition. In addition, the Compton camera also
works an all-sky monitor with an angular resolution of∼1◦
. Its line sensitivity of several
10−7
photons cm−2
s−1
would address the variability of the diffuse 511 keV emission from
GC.
2.4
Polarization
For the most part, the analysis of celestial X-ray and gamma-ray sources has been confined to spectral characteristics and time variability. However, this analysis often allows two
or more different models to successfully explain the observation. For example, there are
two general categories of theoretical models to explain the production of gamma-rays
by isolated pulsars, polar cap models[27]and outer gap models[28]. Polarization
measurement has the diagnostic potential to discriminate between the different compact
source models and can provide a unique insight into the geometrical nature of the emission zone. However, polarization measurement has never been performed at photon energy
greater than∼10 keV, due to the difficulties in making polarimetric instruments for such
high-energy regions.
Any observation of polarized soft gamma-rays from X-ray binaries can prove the
orientation of the accretion disk; since Compton scattering models[29]predict that the
achromatic polarization is a function of observer orientation to the direction normal to the disk. This can be a particularly potent geometrical diagnostic if transient annihilation reflection features are also present, for which the kinematic coupling between energy and direction in Compton scattering can be used to distinct advantage.
Polarimetric information will probe the GRB geometry and emission mechanism.
De-tections of highly polarized gamma-rays (>40%) would strongly argue for the synchrotron
mechanism[30], and suggest that field tangling can only arise on scales larger than the
2.4. POLARIZATION 9
thermal and non-thermal content, and also weigh in on whether or not self-absorption is present.
Recently, the SPI onboard INTEGRAL reported the gamma-ray polarization from
the Crab pulsar for the first time[31]. The degree of polarization is 46 ± 10 % and
the direction of the polarization vector shows a remarkable alignment with the inner jet structure. The alignment of the polarization vector along the jet axis implies an orthogonal magnetic field configuration if the synchrotron process operates. They state
that there is high-energy acceleration of electrons up to at least 1014to 1015eV, which are
then capable of producing TeV emission via inverse Compton scattering on the cosmic microwave background or some other locally produced photons.
The Compton polarimeter[32]based on the detection method utilizing the
direc-tional information of scattered gamma-ray in the detector is the most promising approach in the sub-MeV/MeV energy band, where the physical process is dominated by the Comp-ton scattering. In recent years, several kinds of newly designed CompComp-ton polarimeters
have been proposed[33,34,35]. Their basic configurations surrounding the scattering
detector by the absorption detectors would provide high detection efficiency and high
an-alyzing power. But, the instruments possessing gamma-ray imaging capability are very rare. As demonstrated by COMPTEL onboard CGRO, the capacity allows a significantly reduction in background events induced by cosmic particles such as protons, neutrons and gamma-ray in orbit.
Chapter 3
Principle of Compton Camera
3.1
The interaction of photons
In sub-MeV to MeV energy region, the interaction of a material and a gamma-ray is described by three type of mechanism: photoelectric absorption, Compton scattering, and pair production. The photoelectric absorption involves the absorption of a photon by an atomic electron with the subsequent ejection of the electron from the atom. The Compton scattering plays dominant role typically in the energy band from a few hundred to 10 MeV (Fig. 3.1). It is an elastic scattering between the incident photons and electrons in the scatter medium. In matter, the electrons are bound; however, if the photon energy is high with respect to the binding energy, this latter energy can be ignored and the electrons can
be considered as essentially free1 Above 10 MeV, the pair production becomes dominant
process, involving the transformation of a photon into an electron-positron pair.
Figure 3.1: The significant interaction of gamma-rays and matter[36]
1At low energies, the momentum of bound electrons can not be neglected and a
ffect the performance of Compton Camera. We will discuss this effect in 3.4.3
3.2
Compton Scattering
As illustrated in Fig.3.2, the incident gamma-ray transfers part of its energy to an electron
and is scattered at an angleθ with respect to its initial direction. All the energy lost in
scattering will be given up to secondary electrons as kinetic energy.
Assuming the initial electron is free and at rest, according to the conservation laws of energy and momentum, the energy of the incident gamma-ray is
E0 =E
#
e+E
#
γ (3.1)
and the relationship between the scattering angleθand the energy of the scattered photon
is described as
cosθ = 1−mec2
" 1 E# γ − 1 E0 # (3.2)
where E0 is the energy of the incident gamma-ray, Eγ# is the energy of the scattered
photon,E#
e is the energy of the recoil electron, and mec2 is the rest mass of an electron.
Therefore, if the system detects the energy of the recoil electron and the scattered photon, the scattering angle of the incident gamma-ray is determined by Eq. 3.2.
The energy of scatteredγ-ray is calculated to be
E#
γ =
E0
1 + E0(1−cosθ)
mc2
(3.3)
The kinetic energy of electron,K =E#
e−mec2 becomes,
K =E0(1−
mc2
mc2+E
0(1−cosθ)
) (3.4)
The cross section for Compton scattering is know as ”Klien-Nishina” formula:
dσKN
dΩ =
r2 e 2 "E # γ E0 #2"E
#
γ
E0
+ E0
E#
γ
−sin2θ# (3.5)
wherer0 is the classical electron radius. Integration of this formula overdΩ, then, given
the total probability per electron for a Compton scattering to occur
σKN =σT
3 4
$1 +u
u3
%2u(1 +u)
1 + 2u −ln(1 + 2u)
&
+ 1
2uln(1 + 2u)−
1 + 3u
(1 + 2u)2
'
(3.6)
whereu=E0/mec2.Ifγ-ray energy is much smaller than electron mass, the total cross
3.3. THE COMPTON CAMERA 13
θ
φ
Recoil electron Scattered photon
Incident gamma-ray energy E0
energy E’γ
energy E’e
Figure 3.2: A gamma-ray Compton scattered by an electron
3.3
The Compton Camera
The Compton camera reconstructs the information of the incident gamma-ray with in-formation of Compton scattering recorded in the detector.
Figure 3.3 shows the schematic of the gamma-ray measurement by Compton scatter-ing. In conventional Compton Cameras, the incident gamma-ray is identified by
succes-sive interactions in the two detector layers D1 and D2. Once the locations and energies
of the two interactions are measured, the Compton kinematics allows us to calculate the
energy and direction (as a cone in the sky) of the incident γ-ray following the
Comp-ton equation. We assume that the incident gamma-ray deposits energy E1 in Compton
scattering, and deposits its full energy E2 in the second detector. Equation 3.1 and 3.2
become;
Ein =E1+E2 (3.7)
cosθ = 1−mec2(
1
E2 −
1
E1+E2
) (3.8)
where θ is the scattering angle. As shown in the equations, The incident direction of
a γ-ray is calculated from the position and the energy information of the interactions.
Therefore, fine position and energy resolution is the key requirement for the semiconduc-tor Compton telescope to retain a low background level with Compton kinematics.
It should be noted that, a γ-ray telescope based on a Compton Camera has an
ex-tremely low background, because the coincidence condition between D1 and D2
E2
cos θ = 1 - me c2(1 / E2 - 1 / (E1+E2)) D1
D2
E1
E0 =E1 +E2
Figure 3.3: Gamma-ray measurement by Compton scattering
3.4
Uncertainties in angular determination
The angular resolution is one of the most important parameter to evaluate the Compton camera performance. There are several factors that cause uncertainty in angular deter-mination. These include the imperfection of the detection system and the natures of Compton scattering. The former corresponds the position and energy resolution of
de-tector, and the later corresponds to the Doppler broadening effect. This section discusses
about those factors in detail.
3.4.1
Angular Resolution Measure (ARM)
The angular resolution of a Compton camera is usually described in terms of Angular Resolution Measure (ARM). ARM is defined as the angle between the reconstructed Compton cone and the actual source direction. As shown in Fig.3.4, the incident
gamma-ray deposits its energy E1 at r1, and deposits rest of the energy E2 at r2. Because of
the finite resolution of the energy and the position, measurement gives E1m at r1m and
E2m atr2m, respectively. ARM is defined as the difference betweenθg and θe. Here,θg is
calculated from measured interaction positions and the real direction of the source and
θe is calculated from the measured energy deposits;
cosθg =
(r1m−r0)·(r2m−r1m)
|r1m−r0| · |r2m−r1m|
(3.9)
cosθe= 1−mec2
" 1
E2m −
1
E1m+E2m #
(3.10)
ARM =θe−θg (3.11)
The position uncertainty brings about the error of θg and the energy uncertainty
brings about the error of θe. The angular resolution of a Compton camera is estimated
3.4. UNCERTAINTIES IN ANGULAR DETERMINATION 15
θe θg source
θg θe
source ARM = θg - θe
(E0,r0)
(E1,r1)
(E2,r2)
(E1m,r1m)
(E2m,r2m)
Figure 3.4: Angular Resoution Measure
3.4.2
E
ff
ects of Incomplete measurements
Contribution due to Finite Position Resolution
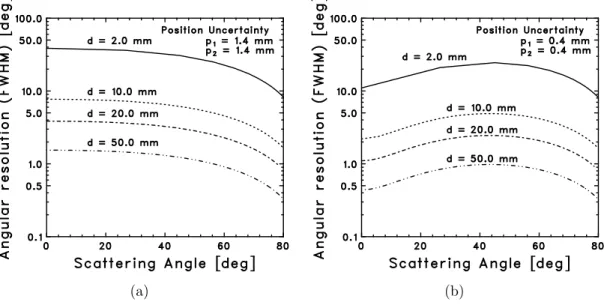
Because the gamma-ray interaction position determines the axis of the Compton cone, the position uncertainty introduces an uncertainty in the cone axis direction. The con-tribution from the position uncertainty is strongly due to the detector’s geometry, for example, the position resolution of detectors and the arrangement of them. It is very
important to estimate the effect of the detector’s geometry to the angular resolution in
order to design the Compton camera.
For simplicity, we introduce the condition as shown in Fig.3.5. The gamma-ray comes
from the z-direction, and is scattered in (x1, y1, z1) then absorbed in (x2, y2, z2). The
angle θ is the scattering angle and the value σθ gives the contribution of the position
uncertainty to the angular resolution. The angle θ is
θ= arctan( z2−z1
(x2−x1)2+ (y2−y1)2
(3.12)
By means of error propagation, the uncertainty of angle θ can be calculated as
σθ2 = 2{(x2−x1)
2+ (y
2−y1)2}(∆Z)2
d4 +
(z2−z1)2(p21+p22)
12d4 (3.13)
where, d is the distance between interaction position,d2 = (x
2−x1)2+(y2−y1)2+(z2−z1)2,
∆Z is the detector thickness,p1 and p2 are the pixel size of the each detector.
z
Δz
p1 : pixel size
(x2, y2, z2) θ
p2 : pixel size gamma-ray
σ
θ(x1, y1, z1)
: thickness
Δz : thickness
d
Figure 3.5: Simplified condition to estimate the angular uncertainty from detector’s position resolution
0.5 mm in both detector. The pixel sizep1 andp2 are 1.4 mm and 1.4 mm in Fig. 3.6(a),
and 0.4 mm and 0.4 mm in Fig. 3.6(b), respectively. As the distance between each detector become larger or the pixel size become smaller, the higher angular resolution can be achieved. The contribution of the position uncertainty can be reduced to less than 1 deg with the 0.4 mm pixel size detectors apart from 50 mm. However, the
detection efficiency decreases as the distance become larger, because the number of the
scattered photon which escape from the detector increase. There is a trade-off between
the detection efficiency and the angular resolution.
(a) (b)
Figure 3.6: The contribution of position resolution of the detector to angular res-olution. (a) pixel size p1 and p2 are 1.4 mm and 1.4 mm, (b) pixel size p1 and p2
3.4. UNCERTAINTIES IN ANGULAR DETERMINATION 17
Contribution due to Finite Energy Resolution
Another factor from the incomplete measurements is the energy uncertainty. Applying error propagation to Eq.3.8, the energy uncertainty contribution to the angular resolution is given by
(∆θenegy)2 = )
mec2
sinθ
1
(E1+E2)2
*2
(∆E1)2+
)
mec2
sinθ
" 1
(E1+E2)2 −
1
E2 2 #
*2
(∆E2)2 (3.14)
The energy resolution∆ E can be normally modeled by the quadrature sum of the
electronics noise and the statistical fluctuation. The statistical noise is usually modeled
as[37]
∆Estatic = 2.35 √
F ·E·W (3.15)
in which, F is the Fano factor, E is the gamma-ray energy, and W is the average ionization energy. In semiconductor materials, the Fano factor is usually less than one, and the measured value is around 0.1. The average ionization energy is typically 3.6 eV in Si and
4.5 eV in CdTe. Here, we use the average value of 4.0 eV for the estimation as∆E1,2 =
(
∆E2
electronics+ 2.352·0.1·4.0×10
−3
·E(keV) [ keV ]. The estimation is performed in
two cases of the electronics noise,∆Eelectronics = 0.5 keV (FWHM) and 2.0 keV (FWHM).
Figure 3.7 shows the result of the estimation for the various incident gamma-ray energy with respect to the scattering angle. As the incident energy becomes larger, the contribution of the energy uncertainty become smaller. This is because, from Eq. 3.14, the angular uncertainty from the energy uncertainty roughly inversely proportional to the incident gamma-ray energy. The contribution can be reduced to less than 1 degree
for the gamma-ray above ∼300 keV. The deterioration due to increase of the electronics
noise is severe as the gamma-ray energy becomes lower. The value for a 80 keV photon
becomes greater than 10◦
in the case of∆ Eelectronics = 2.0 keV. In order to obtain good
angular resolution for such low energy photon, special care must be required for read-out electronics to reduce noise level.
3.4.3
Doppler broadening e
ff
ect
The Compton equation 3.2 is based on the assumption that the electron is free and at rest before the scattering interaction. But in reality, the electron is bound to a nucleus,
and has finite momentum. Although this effect is negligible as the gamma-ray energy
becomes higher, it gives a considerable deterioration to the angular resolution in sub-MeV
band. To describe this effect which commonly called Doppler broadening, a more precise
Compton cross section than Klein-Nishina equation is required.
The Compton differential cross section is represented by a double differential diff
eren-tial cross section (DDCS) obtained from the relativistic impulse approximation (IA) by
Ribberfors[38]. Brusa simplified the equation by some first order approximation[39]
and proposed a simple parameterization of the Compton profile from which the sampling algorithm can be formulated in a closed analytical form. Here, we use this method to estimate the contribution of the Doppler broadening.
The simplified Compton atomic DDCS obtained from the IA is given by[39],
d2σ
dE#
dΩ =
"dσKN
dΩ
#
F(pz)J(pz)
dpz
dE# (3.16)
here,
dσKN
dΩ =
r2 e
2
"Ec
E
#2"Ec
E +
E Ec −
sin2θ# (3.17)
is the Klein-Nishina (KN) formula, where re is the classical electron radius, Ec is the
scattered photon energy at scattering angleθif the initial electron is at rest. The quantity
F(pz) is defined as
F(pz) = 1 +
cqc
E
"
1 + Ec(Ec−Ecosθ)
(cqc)2
#pz
mc (3.18)
wherem is the electron mass,cis the velocity of light, andqc is the momentum transfer,
qc =
1
c
(
E2+E2
c −2EEccosθ (3.19)
The pz is the projection of the initial momentum p of the electron on the direction of
the scattering vector q ≡ k−k#
, where k and k#
are the momenta of the incident and scatted photon; it is given by
pz ≡ − p·q
q =
EE#
(1−cosθ)−mc2(E−E#
)
c2q (3.20)
with
q= 1
c
√
E2+E#2
−2EE#cosθ (3.21)
ifpz = 0, Eq. 3.20 reduces to the Compton scattering formula of Eq. 3.2. In a real atom,
pz has a distribution defined by
Ji(pz)≡
+ +
3.4. UNCERTAINTIES IN ANGULAR DETERMINATION 19
in which Ji(pz) is the one-electron Compton profile in atomic shell i. Therefore, the
atomic Compton profile is given by the sum of all electrons,
J(pz) = ,
ZiJi(pz) (3.23)
where Zi is the number of electron in atomic shell i.
The Compton profile can be obtained by numerical Hartree-Fock profiles tabulated by
Biggs[40]. But, the details of the Compton profile are not very important. Ribberfors
and Berggren[41]have shown that quite accurate incoherent scattering functions can be
obtained by replacing the integrated Compton profile by a simple linear approximation. In order to minimize the required numerical information and to simplify the random
sampling, Brusa[39]proposed analytical one-electron profile of the form
JiA(pz) = √
2Ji,0
-1
√
2 +
√
2Ji,0|pz|
. exp ) 1 2− -1 √ 2+ √
2Ji,0|pz|
.2*
(3.24)
The quantity Ji,0 is the value of the profile at pz = 0 obtained from the Hartree-Fock
orbital[40].
We calculated the Compton DDCS as a function of the scattering angle θ and the
scattered photon energy E#
. Figure 3.8 shows the result of the calculation of a Silicon atom in case of the 80 keV and 511 keV incident gamma-ray energy. The result shows the
Compton DDCS for the particular scattering angle from 20◦
to 160◦
. Figure 3.9 and Fig. 3.10 are that of a Germanium and a CdTe. In the case of CdTe, we average a Tellurium and a Cadmium DDCS. The center energy for each scattering angle corresponds with the scattered photon energy derived from Klein-Nishina formula, but, the distribution
is broaden due to the bound electron to a nucleus. This effect is emphasized for the
large scattering angle and lower incident gamma-ray energy. Comparing a Silicon, a
Germanium and a CdTe material, the effect is minimized in the case of a Silicon.
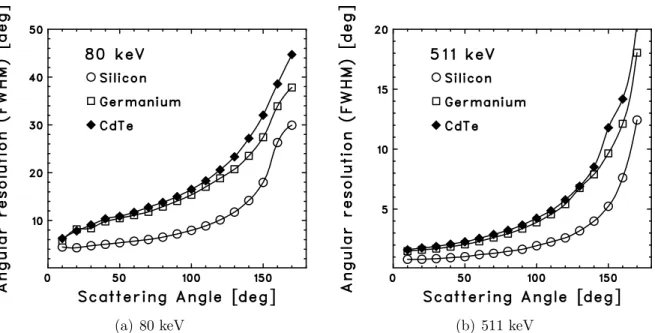
Finally, we summarized the angular uncertainty resulting from Doppler broadening
effect in Fig. 3.11 , for three semiconductor materials, Silicon, Germanium, and CdTe.
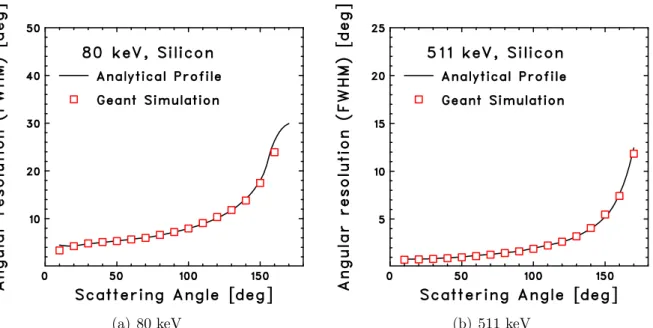
Silicon provides the best angular resolution, roughly 2-3 times better than other materials.
Assuming the ideal detector properties, Si can realize ∼5◦
(FWHM) resolution for a
80 keV incident gamma-ray and less than 1◦
(FWHM) resolution for a 511 keV incident gamma-ray. Actually, the angular resolution is deteriorated by the finite energy resolution
of the detector and this effect is emphasized for low energy photon. For a 80 keV incident
gamma-ray, as shown in Fig. 3.7, the angular resolution by energy uncertainty is roughly
5 ◦
(FWHM) even if 0.5 keV (FWHM) electronics noise is achieved. Special care to reduce noise level is required to obtain the angular resolution closing to Doppler limit
for a low energy gamma-ray. While, for higher energy than∼ 300 keV, the contribution
from the energy uncertainty becomes smaller, therefore, 1◦
angular resolution is feasible
(a)
(b)
3.4. UNCERTAINTIES IN ANGULAR DETERMINATION 21
(a)
(b)
(a)
(b)
3.5. POLARIZATION MEASUREMENT 23
(a) 80 keV (b) 511 keV
Figure 3.11: The contribution of Doppler broadening effect to the angular resolution.
3.5
Polarization measurement
The radiation processes in high energy astrophysics, such as synchrotron radiation, bremsstrahlung or Compton scattering, generate polarized gamma-rays. However, all past and present gamma-ray detectors was not optimized to detect this polarization. The Compton camera suites to detect the polarized gamma-rays and will provide novel information for constraining emission geometries and magnetic field configuration.
For a linearly polarized gamma-ray, Klein-Nishina formula (Eq. 3.2)becomes;
dσKN
dΩ =
r2 e 2 "E # γ E0 #2"E
#
γ
E0
+ E0
E#
γ
−2 sin2θcos2η# (3.25)
where, η is the angle between the electric vector of the incident gamma-ray and the
azimuthal scatter angle. It can be seen that for any specific scattering angle θ, the
scattering provability is maximized whenη=π/2, which means that the scattered photon
prefers to be ejected at directions perpendicular to the polarization plane of the incident
photon. To quantify the polarization information, the Q factor for an arbitrary angle φ
and a given polarization vector angleφ0 is defined as
Q(φ,φ0) =
dσ(φ−φ0)−dσ(φ+π/2−φ0)
dσ(φ−φ0) +dσ(φ+π/2−φ0)
(3.26)
= −sin
2θ E0 E! γ + E! γ E0 −sin
2θcos(2(φ−φ0)) (3.27)
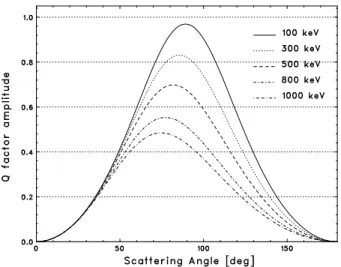
The amplitude of the Q factor versus the scattering angle at different the incident
gamma-ray energies is shown in Fig. 3.12. For a fixed incident gamma-gamma-ray energy, the amplitude
of the Q factor is maximized when the scattering angle is slightly less than 90 ◦
the Q factor is maximized when φ is perpendicular to the polarization plane of the
incident photon, and is minimized when φ is along the polarization plane. Therefore,
the polarization direction and degree can be deduced from the measured phases and amplitude of the modulation ratio, respectively.
The larger amplitude of the Q factor has an advantage of polarization measurements because the polarization information can be derived even from low statistics data. But, in practice, the amplitude of the Q factor determined by a detector will be dependent upon several factors which will generally decrease its value from that calculated in the idealized case. These factor are, for example; (i) the physical configuration of the detectors; (ii)the presence of passive material; (iii)the energy thresholds of the detectors; (iv)background levels. Therefore, it is important to extract the proper events from data recorded in the detectors and to distinguish them with the background events. The Compton camera will suit with polarization measurements thanks to the significant background reduction with the Compton kinematics.
3.6. HISTORY OF COMPTON CAMERA 25
3.6
History of Compton camera
After the first concept for the Compton Camera proposed by Sch¨onfelder et al (1975), A
number of Compton telescope designs have been proposed, tested, and flown[42,43,7].
The success of these mission and the improvement in the technology over following twenty
years lead to the launch of COMPTEL[4,5,6,7,8]onboard NASA’s Compton Gamma
Ray Observatory (CGRO) in 1991.
COMPTEL
Figure 3.13: COMPTEL onboard CGRO
A most successful application of utilizing Compton Scattering was the imaging Comp-ton Telescope (COMPTEL). COMPTEL detects gamma rays by the occurence of two successive interactions in the telescope: first a Compton scattering collision occurs in a detector of low-Z material ( liquid scintillator NE213A) in the upper planar modules, then a second interaction takes place in a lower plane of detector module. High Z material, NaI(Tl), was used to absorb the scattered gamma-ray.
Figure 3.14: All-sky map from COMPTEL in the 1–30 MeV range[13]
Time-of-flight methods are used to reduce the background events from high-energy neu-trons. It covers the energy range from 0.7 to 30 MeV and has yielded significant break-throughs in the field of the high energy astrophysics. With its large field-of-view of about
1 steradian different sources within this field can be resolved if they are separated by more
than about 3 to 5 degrees. Its energy resolution of 5 % to 10 % FWHM is an important feature for gamma-ray line investigations. Within a 2-week observation period, it can detect sources that are about ten times weaker than the Crab.
Figure 3.14 shows All-sky map from COMPTEL in the 1–30 MeV range[13]. The
concentration of the emission along the Galactic Plane was clearly resolved for the first
time. It also generated the first all-sky map of the 1.8 MeV line from radioactive 26Al.
In addition, COMPTEL succeeded in the first detection of the 1.156 MeV line from
radioactive44Ti from a supernova remnant Cas A.
3.6. HISTORY OF COMPTON CAMERA 27
Compton Cameras after COMPTEL
The Compton camera has been also developed in the field of medical imaging. Soon after the proposal by Schonfelder, Todd proposed that the Compton imaging device for medical application be used as an alternative to the mechanically collimated imaging
system like an Anger camera[44,45]. The first working prototype for medical imaging
developed by Singh and Doria[46,47]in early 1980s. The prototype replaced the
conventional collimator with a High Purity Germanium (HPGe) detector in front of an Anger camera. With the development of semiconductor radiation detectors during 1980s and 1990, many Compton camera system followed the scheme proposed by Singh, which used semiconductor detector as the front-plane detector and scintillator detector as the
back-plane detector. In 1993, Martin[48]proposed a ring Compton scatter camera which
consists of a 4×4 array of HPGe detectors and a ring array of cylindrical NaI scintillators
(Fig.3.15(a)). In 1998, LeBlanc et al. built a prototype Compton camera, C-SPRINT
(Fig.3.15(b)), for nuclear medicine[49,50,51]. Instead of Germanium detector,
C-SPRINT consists of 3×3×0.1 cm size Si pad detector that pixellated into 22×22 array.
The performance study has been compared with mechanically collimated SPECT system. Although the noise equivalent sensitivity was limited at the low energy end such as the
140 keV gamma-rays from 99mTc, it excels at higher energy band such as the 392 keV
gamma-ray from 113mIn.
The concept of multiple scattering Compton camera was proposed by Kamae[52]
in 1988. It consists of many layer of thin Si strip detectors surrounded by a cylindrical CsI scintillator (Fig.3.15(c)). Two years later, Dogan et al. proposed to reconstruct
the image using multiple scattering gamma-ray based on the Kamae’s design[53]. In
2004, Wulf et al. developed a Compton camera using three layer s of double-sided silicon
strip detectors[54]. Reconstructed images and spectra from137Cs and 57Co gamma-ray
sources was obtained using multiple Compton technique proposed by Kroeger[55]. The
energy spectrum for 662 keV gamma-rays that did not deposit their full energy in the instruments shows a peak at 662 keV with a FWHM of 27.6 keV. The reconstructed
image of the source shows an angular resolution of 3.3◦
FWHM.
A Compton camera with a HPGe detector which features excellent energy resolution
has been developed energetically. In 1994, McKisson et al[56]reported the result of
a Compton camera that consists of eight HPGe coaxial detectors. It obtained 137Cs
image at 1 meter from front plane and achieved fine energy resolution of 0.27 % at
662 keV and 0.30 % at 1333 keV. Tow years later, Phlips et al[57]built a Compton
camera by using position sensitive HPGe double-sided strip detectors. By combining a
25×25 strip (2mm pitch) detector with a 5×5 strip detector (9mm pitch), they created
a imaging system with 625×25 pixel combination. In 2001, Schmid et al[58]proposed
original concept to develop a Compton camera with a single coaxial HPGe detector. The position information is obtained by way of a segmented outer contact and digital
pulse-shape analysis. A significant improvement of detection efficiency can be achieved by
employing a single large volume crystal (5×5 cm) and by detecting all full energy events
that Compton scatter within detector. They demonstrated the ability to image the
662 keV gamma-ray from a 137Cs source with an angular resolution of 5 ◦
and a relative
efficiency of 0.3 %[59](Fig.3.15(d)). In 2007, Mihailescu et al[60]developed the
developed[61]. It achieved good angular resolution that are dominated by the intrinsic
Doppler broadening, typically, less than 2◦
above 300 keV incident gamma-rays.
There are the Compton cameras which characterized by the capability of tracking recoil electrons in the field of MeV gamma-ray astronomy. Measuring the direction of the electron recoil in the first scatter can further restrict the initial photon direction to an arc segment on the Compton cone.The Advanced Compton Telescope (ACT) mission has been identified in the NASA roadmap as the next major step in gamma-ray astronomy
[62,63]. The baseline of the detectors was chosen as a hybrid Si-Ge array, consisting
of a 27 layer of 2 mm thick silicon detectors, situated immediately above a 4 layer array of 16 mm thick germanium detectors (Fig.3.15(e)). The ACT will probe the fires where chemical elements are formed by enabling high resolution spectroscopy and imaging of nuclear emission form supernova explosions.
Future missions
In recent year, the next mission with newly designed Compton Camera is planed in sev-eral groups beyond the COMPTEL. However, the only a handful missions are realizable
within the next decade because of the difficulty of the developments of the new detector
technologies for tracking the Compton scattering photon with high accuracy. One of the
candidates is the Advanced Compton Telescope (ACT) mission[62,63], also known as
NACT[64], the Nuclear Astrophysics Compton Telescope, which investigates the
nu-cleon synthesis with nuclear lines from a supernovae, as well. The other is the series of mission by our group, based on a Si/CdTe semiconductor Compton Camera which originally proposed and described in this thesis. The Si/CdTe semiconductor Compton camera adopted as the SGD (Soft Gamma-ray Detector) onboard ASTRO-H mission
[65,66], planed Japanese sixth x-ray astronomy satellite as a successor to the current
Suzaku X-ray mission[2]. In addition, the DUAL mission[67], combining the Compton
camera with a Laue Lenses[68]which is newly developed gamma-ray focussing lenses
3.6. HISTORY OF COMPTON CAMERA 29
(a) Martin[48] (b) C-SPRINT[49,50,51] (c) Multiple scattering Compton camera[52]
(d) Compton camera with a single coax-ial HPGe detector[59]
(e) The Advanced Compton Telescope consept
[63]
Chapter 4
Si/CdTe Semiconductor Compton
Camera
4.1
Introduction
The energy band between 0.1 MeV and 10 MeV is poorly explored due to difficulties
associated with the detection of such photons. Compton telescopes have the advantage of a large signal-to-noise ratio in an energy range where the backgrounds are intense on
a space platform. The Compton telescope COMPTEL[4,5,6,7,8]on board CGRO
demonstrated that a gamma-ray instrument based on the Compton scattering is useful for the detection of the gamma-rays in this energy band. In fact, the achieved sensitivity of COMPTEL above MeV is superior than that obtained by OSSE, a collimated phoswich detector, also onboard CGRO. Although COMPTEL performed very well as the first
orbit-based Compton telescope for MeV gamma-ray astrophysics, it suffered from large
background, poor angular resolution, and complicated image decoding. Also, the lower
detection threshold is limited to ∼750 keV due to the relatively high threshold of the
scattering detectors (∼50 keV). In order to fill the sensitivity gap (see Fig. 1.1) beyond
COMPTEL, the innovative detector technology is definitely required.
In order to overcome this situation, our group proposed a new Compton telescope, in
2001[69]. The telescope was based on an idea of Si/CdTe Compton Camera which uses
our advanced technology of CdTe and Si imaging sensors, accumulated for last 10 years. In addition to the low background capability by utilizing the Compton kinematics, it features high spectral resolution (2 keV (FHWM) at 100 keV) and high angular resolution close to the theoretical limit defined by the Doppler broadening. Capability to measure gamma-ray polarization from the directional information of scattered gamma-rays is also attractive feature of a Compton camera.
Since then we have been working on the development of the Si/CdTe Compton Cam-era. Several key technologies had to be established before making the prototype.
4.2
Configuration of the Si/CdTe Compton Camera
The conceptual design of the Si/CdTe semiconductor Compton camera is shown in Fig. 4.1. The telescope is based on a hybrid semiconductor gamma-ray detector consisting of layers of thin Si and CdTe layers to detect photons in a wide energy band (0.05 - 1 MeV);
the Si layers are required to improve the performance at a lower energy band (< 0.3 MeV). In the stack of Si and CdTe layers, we require each event to interact twice, once by Compton scattering and then by photo-absorption. Once the locations and energies of the two interactions are measured, the Compton kinematics allows us to calculate the
energy and direction (as a cone in the sky) of the incidentγ-ray following the Compton
equation.
The scattering part is very important in the Compton telescope. In order to cover a wide energy band and also to cover the wide scattering angle of the Compton interaction in the detector, the energy threshold of the detector must be low. Furthermore high
Compton scattering probability is desirable to obtain a high efficiency as a Compton
telescope. The properties of the semiconductors are summarized in Table. 4.1. The combination of a low-Z material (Si) and a high-Z material (CdTe) is suitable to obtain
the high detection efficiency. Since the cross section of Compton scattering of a Si becomes
dominant above a 60 keV gamma-ray as shown in Fig. 4.2, the Compton camera works
effectively even from the energy band below 100 keV. While, CdTe works very nicely as
a absorption part thanks to the high photo-absorption cross section and high density. In order to surpass the performance of COMPTEL, we need to improve angular resolution As described in section 3.4.3, Si provides roughly 2–3 times higher angular resolution than Germanium or CdTe. The choice of Si would be best and required to obtain ultimate
angular resolution closing to 1 ◦
above 500 keV gamma-ray.
Advantage of our Si/CdTe Compton Camera over other Compton Camera is that all components are made by semiconductor devices. For imaging devices, their good energy resolution and the ability to fablicate comapct arrays or strips are very attractive features in comparison with inorganic scintillator couple to either photodiodes or photomultiplier tubes. In particular, the adoption of CdTe as absorbers is essential for the improvement
of angular resolution by keeping detection efficiancy.
The incident direction of a γ-ray is calculated from the position and the energy
4.2. CONFIGURATION OF THE SI/CDTE COMPTON CAMERA 33
Silicon
CdTe
Figure 4.1: The conceptual design of the Si/CdTe semiconductor Compton camera
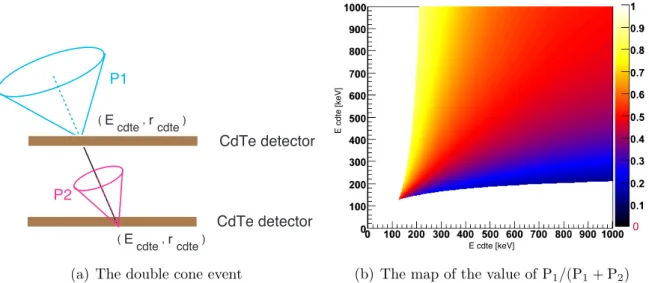
The schematic view of the Compton events which detected in the Compton camera are illustrated in Fig. 4.3. Type A is a basic event. The incident gamma-ray is scattered in Si scatterer, then, absorbed its full energy in CdTe absorber. The direction of incident photon is reconstructed as a Compton cone. In the energy region above 1 MeV, the scattered electron tends to penetrate the thin Si detectors (Type B). In this case, Si works as a electron tracker. The direction of scattered electron can be measured and thus the direction of incident gamma-ray is restricted to an arc not to a cone. The more parameters of the incident gamma-ray can be obtained, the better the chances to reject background. In the case of Type C, the gamma-ray escapes from the detector after the second interaction. The measured energy of the scattered photon is always less than the correct energy, therefore, the Compton cone spreads than the correct one. Although this type of events can be eliminated if the energy of incident gamma-ray is known, it becomes a back-ground event (see below for another technique to handle these events) One idea to overcome this problem is to use the anti-coincidence measurements for the escape photon. If the incident photon is scattered at least three times in the detector (Type D), the Compton reconstruction is performed successfully regardless of whether the photon escapes or not, as
E0 =E1+
E2+ (
E2
2 + 4E2mcc2/(1−cosθ2)
2 (4.1)
where, E0 is the energy of incident gamma-ray, E1 is energy deposit in first scattering,
E2 is energy deposit in second scattering and θ2 is the scattering angle determined from
the interaction positions. This concept called the Multiple Compton Method, which
was originally proposed by Kamae et al. (1987)[52], is very attractive. The idea of
using silicon strip detectors stimulated new proposals for the next generation Compton
telescope[62,63,70]. In this technique, a stack of many thin scatterers is used to record
energy-Table 4.1: Properties of the semiconductors
semi- density Z Egap * X0
conductor [g/cm3] [eV] [eV] [cm]
Si 2.33 14 1.12 3.6 9.37
Ge 5.33 32 0.67 2.9 2.30
CdTe 5.85 48,52 1.44 4.43 1.52
CdZnTe 5.81 1.6 4.6
HgI2 6.40 80,53 2.13 4.2 1.16
GaAs 5.32 31, 33 1.42 4.3 2.29
Egap : band gap energy
* : an ionization potential
X0 : radiation length
momentum conservation for all possible sequences. This technique is very powerful to suppress background.
In the energy region above 10 MeV, pair production becomes the dominant process (see Fig.4.2). A stack of thin CdTe detectors has the potential to realize a new detector
concept, an “active pair-production telescope”[71]. CdTe has a radiation length of
1.52 cm. A thickness of 0.5 mm of CdTe layer correspond to 0.03 r.l, which is almost same as the thickness of Tantal of Tungusten sheet used in the EGRET or LAT detectors. If we prepare 80 layers of CdTe with a thickness of 0.5 mm, we will have 2.6 r.l in total. Since
each layer acts both as a converter and a tracker, the detector is very efficient at detecting
4.2. CONFIGURATION OF THE SI/CDTE COMPTON CAMERA 35
Figure 4.2: The Attenuation Coefficient for Si and CdTe
e
escape
A B C D
θ
1
θ
2
E1
E2
4.3
Development of Key Technologies
The high energy resolution of the detectors is required in order to establish a Compton camera which works in sub-MeV energy band, from several tens keV to MeV. As shown
in Fig. 3.7, at least 2 keV (FWHM) noise level is required to obtain ∼ 1 ◦
angular resolution for the incident gamma-ray above 500 keV. We have originally developed both Si and CdTe detectors in order to derive ultimate performance from a Compton camera. The leading-edge technologies such as low noise Analog ASICs and high package density technique were applied.
As a scattering part, we have developed the double-sided silicon strip detector (DSSD) in collaboration with Hamamatsu Photonics, Japan. This device was historically created to track charged particles in particle physics. The basic geometry of the strip, which includes orthogonally implanted n and p strips on both sides of the detector, provides two-dimensional coordinate measurements of the position of the Compton scattering. An issue for applying to the sub-MeV Compton camera is noise performance. The signal generated by a recoil electron is much smaller than that made by a charged particle. For this reason, we wished to minimize electrical noise in the DSSD and read-out electronics. The geometry of the detector including a strip pitch, gap and detector thickness was carefully optimized because the input capacitance is the greatest contributor to this
problem[72,73]. Moreover, to realize low noise read-out from both P and N side, we
utilized a the DC coupling read-out for both side. To apply a reverse bias voltage, the N-side circuit as a whole is biased. We achieved 1.2 keV FWHM energy resolution of
P-side and 2.8 keV of N-side with a 2.56 cm wide detector of 300µm thickness[74].
CdTe has been regarded as a promising semiconductor material for hard X-ray and gamma-ray detection since the early 1970’s. The high atomic number and density of the materials gives a high stopping power suitable for a detector operation typically in the 10-500 keV. However, a considerable amount of charge loss in these detectors produces a reduced energy resolution. This problem arises due to the low mobility and short
lifetime of holes, typically µhτh ' 1×10⁻⁴ cm2/V. We have succeeded to achieve high
energy resolution CdTe diode detector. A high Schottky barrier formed on the In/p-CdTe interface lead us to the operation of the detector as a diode. As a result, the leakage current is suppressed under a bias of as high as 1 kV. The leakage current of
the 2 mm×2 mm detector of thickness 0.5 mm was as low as 10 pA at 20◦
C with a bias voltage of 500 V. We demonstrated good FWHM energy resolution of 1.1 % and 0.8 %
at energies 122 and 511 keV, respectively[75].
Another key technology achieving the required energy resolution is low noise front-end electronics. In addition, the semiconductor Compton camera requires many channels
read-out to obtain sufficient position resolution for precise tracking the scattered photon.
We have developed the ASIC (application specific integrated circuit) VATA series in collaboration with Gamma Medica-Ideas, Norway. Firstly, we developed the VA32TA
[76]based on the design of the VA32C amplifier VLSI and TA32C trigger VLSI that are
originally developed by Ideas. It consists of 32 channel of signal read-out. Each channel includes a charge sensitive preamplifier, slow CR-RC shaper, sample/hold and analog multiplexer chain (VA section), and fast shaper and discriminator chain (TA section).
The typical noise performance is 50e−
at 0 pF load and 170e−
at 10 pF load with 2 µs
shaping time. With a 4 cm wide and 300 µm thick DSSD, the energy resolution of
![Figure 3.14: All-sky map from COMPTEL in the 1–30 MeV range [ 13 ]](https://thumb-ap.123doks.com/thumbv2/123deta/6859920.243749/34.892.182.671.134.396/figure-sky-map-comptel-mev-range.webp)