Studies on N1-Methyladenosine Modification of
rRNA in Multicellular Organisms
著者
YOKOYAMA Wataru
内容記述
この博士論文は内容の要約のみの公開(または一部
非公開)になっています
year
2018
その他のタイトル
多細胞生物におけるrRNAのm1A修飾に関する研究
学位授与大学
筑波大学 (University of Tsukuba)
学位授与年度
2017
報告番号
12102甲第8607号
URL
http://hdl.handle.net/2241/00152304
Studies on N
1
-Methyladenosine Modification
of rRNA in Multicellular Organisms
January 2018
Studies on N
1
-Methyladenosine Modification
of rRNA in Multicellular Organisms
A Dissertation Submitted to
the Graduate School of Life and Environmental Sciences,
the University of Tsukuba
in Partial Fulfillment of the Requirements
for the Degree of Doctor of Philosophy in Biotechnology
(Doctoral Program in Life Sciences and Bioengineering)
Contents
Chapter I. Preface 1 Chapter II. Mammalian NML-mediated m1A modification of rRNA links
ribosomal subunit formation to cell proliferation in a p53-dependent manner
Abstract 3
Introduction 4
Materials and Methods 7 Results 23
Discussion 34
Figures and Tables
Chapter III. Identification of rRNA adenine methyltransferase-1 (RRAM-1) as m1A modification factor in Caenorhabditis elegans
Abstract 37
Introduction 39
Materials and Methods 42
Results 50
Discussion 56
Chapter IV. Concluding Remarks 60
Acknowledgments 63
1
Chapter I.
Preface
Genetic information is transferred from DNA into proteins. This biological phenomenon is termed ‘Central Dogma’. Its flow can be divided into DNA replication, transcription, and translation. RNAs play pivotal roles in the transcription and translation steps. For example, DNA is transcribed into messenger RNA (mRNA) and this mRNA is
translated by ribosomes, which are composed of ribosomal RNAs (rRNAs) and ribosomal proteins. During translation, transfer RNAs (tRNAs) bring specific amino acids to the ribosomes. The functions of these RNAs can be regulated
post-transcriptionally (referred to as RNA modifications). RNA modifications are present in all kingdoms of life. Further, over 100 different types of modifications have been identified (1).
Among the known RNA modifications, the N1-methyladenosine (m1A)
modification, which is an N1 atom methylated ribonucleotide, is well-studied. Over 50 years ago, m1A was first documented using yeast and mammalian RNAs (2). Until now, m1A modifications in tRNAs have been shown to increase its structural stability and induce correct folding (3). Additionally, enzymes catalyzing the m1A modification of tRNA have been identified not only in yeast but also in mammals (4, 5). On the other
2
hand, the methyltransferase(s) and physiological functions of the rRNA m1A modification, especially in multicellular organisms, are poorly understood.
Recently, Peifer et al. have reported that yeast rRNA processing protein 8 (Rrp8) is responsible for the m1A modification of yeast 25S rRNA (6). Therefore, in chapter II, I focused on the mammalian homolog of yeast Rrp8, nucleomethylin (NML), and investigated its involvement in the rRNA m1A modification using mammalian cells. I showed that NML is required for the m1A modification in human and mouse 28S rRNA, and contributes to formation of the 60S ribosomal subunit. Furthermore, I demonstrated that NML regulates the cell growth via a p53-dependent mechanism.
Caenorhabditis elegans (C. elegans) is a frequently used model organism for
various biological studies, such as development, behavior, and aging (7, 8). Hence, in chapter III, to reveal the physiological significance of the rRNA m1A modification in
vivo, I investigated the function of T07A9.8, a C. elegans homolog of human NML. The
results demonstrated that T07A9.8 is involved in the regulation of autophagy and lifespan. Notably, it has been considered that autophagy plays a key role in longevity (9-12). Collectively, these novel discoveries suggest the proposition that the rRNA m1A modification links autophagy to the regulation of lifespan in multicellular organisms.
3
Chapter II.
Mammalian NML-mediated m
1A modification of rRNA links
ribosomal subunit formation to cell proliferation
in a p53-dependent manner
Abstract
Ribosomal RNAs (rRNAs) act as scaffolds and ribozymes in ribosomes, and these functions are modulated by various post-transcriptional modifications. However, the biological roles of base methylation, a well-conserved modification of rRNAs, are largely unknown.
In this study, using human and mouse cells, I demonstrated that a nucleolar protein, nucleomethylin (NML; also known as RRP8), is required for the N1-methyladenosine (m1A) modification of 28S rRNA. Furthermore, NML contributes to the 60S ribosomal subunit formation. Intriguingly, NML depletion increases ribosomal protein L11
(RPL11) levels in the ribosome-free fraction. This increment upregulates the p53 protein levels through an RPL11-MDM2 complex, and thereby activates the p53 pathway. In consequence, the growth of NML-depleted cells is suppressed in a p53-dependent manner.
These findings reveal a novel biological function of the rRNA m1A modification, which links ribosomal subunit formation to p53-mediated inhibition of cell proliferation in mammalian cells.
4
Introduction
Ribosomal RNAs (rRNAs) function as scaffolds for ribosomal proteins and ribozymes for peptide bond formation (13, 14). Biosynthesis of rRNA comprises transcriptional and post-transcriptional modification of precursor (pre)-rRNAs as well as the
processing of pre-rRNAs into mature 28S, 18S and 5.8S rRNAs (15). Nucleotide modifications of rRNA regulate the function and stability of ribosomes (16). There are three main types of chemical modifications of rRNA – conversion of uridine to
pseudouridine (pseudouridylation); methylation of 2′-hydroxyls (2′-O-ribose
methylation); and alteration of bases, most of which undergo methylation at its different positions (base methylation) (16). Of these modifications, base methylations are the most conserved in terms of their total number and position among living organisms, and are commonly found at approximately ten positions in eukaryotic rRNAs (17, 18). Base methylation is considered to expand the structural repertoire of RNA through facilitating base stacking by increasing hydrophobicity and adjusting steric hindrance (19). To date, base methylation of rRNA and the genes responsible for it (Bud23, Rrp8, Nop2, Rcm1,
Bmt2, Bmt5 and Bmt6) have been identified in budding yeast (6, 20-22). The recent
report has shown that yeast and worm homologs of human NSUN5 methylate C2278 of
5
In addition, the reduction in the levels of NSUN5 homologs decreases translational fidelity in yeast and increases the lifespan of S. cerevisiae, C. elegans and Drosophila
melanogaster (23). Until now, the human homolog of yeast Bud23, WBSCR22
(Merm1), has been shown to mediate N7-methylation of G1639 of 18S rRNA and contribute to its maturation in cells (24). However, little is known about the base methyltransferase of 28S rRNA in mammals.
In all organisms, ribosomes serve as the sole site of protein synthesis, and their biogenesis is strictly regulated. The mammalian ribosomes comprise two subunits composed of rRNAs and ribosomal proteins (25, 26). The small subunit (40S) is formed from a single molecule of rRNA (18S rRNA) and 33 ribosomal proteins (ribosomal proteins of the small ribosomal subunit; RPSs). Conversely, the large subunit (60S) contains three rRNA molecules (28S, 5.8S, and 5S rRNA) and 47 ribosomal proteins (ribosomal proteins of the large subunit; RPLs). Interestingly, the defects of ribosome biogenesis are coupled to inhibition of cell proliferation that is mediated by p53 (27-29). p53 functions as a tumor suppressor, and its activation induces cell cycle arrest and apoptosis, resulting in the suppression of cell growth (30-32). In addition to these reports, recent studies have been suggested that quantitative and qualitative changes in ribosomes are associated with numerous physiologic and pathologic events (33-37).
6
However, it remains unclear whether and how the base methylations of rRNAs regulate ribosomal functions and related biological events in mammals.
Nucleomethylin (NML; also known as RRP8) is a nucleolar protein that binds to dimethyl lysine at position 9 of histone H3 (H3K9me2) in cells and suppresses rRNA transcription in response to glucose deprivation (38, 39). NML contains the Rossmann-fold methyltransferase-like domain in its C-terminal half, and binds to S-adenosyl-L-methionine (SAM), while NML does not exhibit methyltransferase activity toward histones (39). Recently, the yeast NML homolog Rrp8 has been identified as a gene responsible for the SAM-dependent N1-methyladenosine (m1A) modification in the 25S rRNA (6). However, the contribution of NML to m1A modification has yet to be
elucidated.
In this study, using mammalian cells, I revealed that NML is responsible for m1A modification of 28S rRNA and contributes to the formation of 60S ribosomal subunit, and that NML deficiency inhibits cell proliferation in a p53-dependent manner.
7
Materials and Methods
Cell culture
Human epithelial adenocarcinoma HeLa cells were provided by the RIKEN Catalysis Research Center through the National Bio-Resource Project of the Ministry of
Education, Culture, Sports, Science and Technology, Japan. SV40 large T-antigen transformed NML WT and KO mouse embryonic fibroblasts (MEFs) were generated from C57BL/6J background wildtype and NML-KO mice, respectively (40). Human colon carcinoma HCT116 p53+/+ and p53−/− cells were kindly provided by Dr. Bert Vogelstein (John Hopkins University, USA) (41). All animal experiments were approved and performed in accordance with the guidelines for the care and use of laboratory animals at University of Tsukuba. For MEF isolation, embryos at 13.5 days post-coitum from C57BL/6J mice (CLEA Japan, Japan) were used. After the removal of the head and visceral tissues, the remaining bodies were washed and dissociated. Cells were plated on dishes and incubated 37 °C with 5% CO2. The next day, floating cells were removed by washing in phosphate-buffered saline (PBS). MEFs were used within three passages. All cells were maintained in Dulbecco’s modified Eagle’s medium (DMEM; Gibco, Thermo Fisher Scientific, USA) supplemented with 10% fetal bovine serum (FBS; Gibco, Thermo Fisher Scientific) and penicillin-streptomycin
(Sigma-8
Aldrich, USA).
Antibodies
Antibodies against the following proteins and epitopes were used in my study: anti -actin (A5316; Sigma-Aldrich); anti- -tubulin (T5168; Sigma-Aldrich); anti-Histone H3 (9715; Cell Signaling Technology, USA); anti-1-methyladenosine (D345-3; MBL, Japan); anti-RPL11 (14382; Cell Signaling Technology); anti-MDM2 (sc-96; Santa Cruz Biotechnology, USA); p53 (DO-1; sc-126; Santa Cruz Biotechnology); anti-p21 (F-5; sc-6246; Santa Cruz Biotechnology); anti-Bax (ab7977; Abcam) and an unconjugated affinity purified isotype control immunoglobulin (IgG) from mouse (sc-2025; Santa Cruz Biotechnology). Previously reported anti-human and mouse NML antibodies were used (39, 40).
RNA interference experiment
To generate stable knockdown cell lines, cells were transfected with the piGENE™ hU6 plasmid (iGENE Therapeutics, Japan) containing sequences targeting NML, green fluorescent protein (GFP) or luciferase (Luc). The transfected cells were selected with puromycin. The target sequences were:
9
5’-GCCGCTTTGAGGATGTTCGAA-3’ for shNML#1 5’-GGGTAGTACTACAAATGATCC-3’ for shNML#2 5’-GGCTACGTCCAGGAGCGCACC-3’ for shGFP 5’-GTGCGCTGCTGGTGCCAACCC-3’ for shLuc.
For transient knockdown, cells were transfected with 20 nM of Stealth RNAi™ short interfering RNA (siRNA) (Invitrogen, USA) using Lipofectamine® RNAiMAX (Invitrogen) according to the manufacturer’s protocol. The target sequences were as follows:
5’-CCGCUUUGAGGAUGUUCGAACCUUU-3’ for siNML#1 (human) 5’-CCUCAUACAUUAAGCCGCAAGCAGU-3’ for siNML#2 (human) 5’-CCAAACUCGGCUUUAAGAUUAUCUA-3’ for siNML (mouse) 5’-ACACAUCGAUCUGGGUAUCAAAUAU-3’ for siRPL11.
Stealth RNAi™ Luciferase Reporter control (siLuc) was used as a negative control.
Plasmid construction and mutagenesis
A plasmid containing mouse wild-type NML was constructed by inserting the Hind III-Not I (blunt ended with Klenow)-digested fragment from FLAG- and HA-tagged mouse NML in pcDNA3 into the Xho I (filled with Klenow) site of the plasmid pPB-CAG.
10
EBNXN (kindly provided by Dr. Allan Bradley, Wellcome Trust Sanger Institute, UK). Mutations were introduced by performing site-directed mutagenesis and PCR. The primer sequences were as follows (induced mutations are underlined):
mouse NML mt1 (G317D, G319R), 5’-GCTGACTTTGACTGTAGAGATTGCCGC-3’ mouse NML mt2 (G317Q), 5’-GCTGACTTTGGCTGTGAAGATTGCCGC-3’.
RNA immunoprecipitation (RIP)
RIP was performed as previously described (42) with minor modifications. For RIP against NML using nuclear lysates, cells were harvested and resuspended in 450 l buffer A [10 mM HEPES (pH 7.5), 10 mM KCl, 0.1 mM EDTA] (43) and kept on ice for 15 min. Fifty microliters of buffer A including 5% Nonidet P-40 (NP-40) were added. Nuclei were pelleted by centrifugation at 800 g for 5 min at 4 °C. Then, whole cells or nuclei were suspended in 200 l cold lysis buffer [10 mM 4-(2-hydroxyethyl)-1-piperazineethanesulfonic acid (pH 7.5), 300 mM KCl, 5 mM MgCl2, 0.5% NP-40, 1 mM dithiothreitol, EDTA-free protease inhibitor cocktail (Nacalai Tesque, Japan) and 100 U/ml RNase Inhibitor (Toyobo, Japan)]. The whole-cell or nuclear extracts were centrifuged at 15,000 g for 15 min at 4 °C, and the supernatant was pre-cleared using protein G Sepharose® beads (GE Healthcare, UK) and treated with DNase I (Wako Pure
11
Chemical Industries, Japan) (60 U/100 l lysate) for 30 min on ice. The samples (2-10 g) were incubated with pre-binding antibodies (5 g) and protein G Sepharose® beads in 1000 l NT2 buffer [50 mM Tris-HCl (pH 7.5), 150 mM NaCl, 1 mM MgCl2 and 0.05% NP-40] including 100 U of RNase inhibitor, 10 mM dithiothreitol and 20 mM EDTA overnight at 4 °C. The beads were washed twice with NT2 buffer and
resuspended in 100 l of NT2 buffer. The suspension was mixed with 100 l of
proteinase K buffer [30 g proteinase K, 20 mM Tris-HCl (pH 7.8), 10 mM EDTA and 1% sodium dodecyl sulfate (SDS)] and incubated for 30 min at 55 °C. After
centrifugation, RNAs were purified from the supernatant using phenol-chloroform-isoamyl alcohol and analyzed by performing qRT-PCR. The whole-cell or nuclear extracts were used as input samples for normalization of qRT-PCR data.
Western blotting
For Western blotting, cells were lysed with RIPA buffer [20 mM Tris-HCl (pH7.5), 150 mM NaCl, 2 mM EDTA, 0.8% NP-40, 0.1% SDS and 0.5% sodium deoxycholate]. Cell extracts were separated by performing SDS-PAGE and transferred to a polyvinylidene difluoride membrane using transfer apparatus according to the manufacturer’s protocol (Bio-Rad Laboratories, USA). The antibodies used are described in the Antibodies
12
section. For quantitative analyses of Western blotting data, band intensities were measured by using Multi Gauge version 3.0 software (Fujifilm, Japan). Each protein level was normalized to the protein levels of -actin.
qRT-PCR
To quantify rRNA or mRNA levels, aliquots of total RNA (500 ng) were reverse transcribed with a pd (N)6 random primer and 250 μM of deoxy nucleoside
triphosphates (dNTPs). Quantitative reverse-transcription (qRT)-PCR was performed with primers for the indicated rRNAs or genes (Table 1). The expression level of each gene in human and mouse cells was normalized to the mRNA levels of genes encoding human -actin (ACTB) and mouse cyclophilin (Ppia), respectively.
Detection of rRNA methylation with site-specific semi-quantitative
RT-PCR
To quantify rRNA methylation levels, I performed a site-specific rRNA methylation assay based on qRT-PCR (35, 37). Total RNA was extracted and purified using Sepasol-RNA I Super G (Nacalai Tesque) according to the manufacturer’s instructions. Total RNA (500 ng) were reverse transcribed using ReverTra Ace® (Toyobo) and 1 μM of
13
each reverse primer targeting a sequence downstream to a specific methylation site, with either a low (2.5 μM) or high (250 μM) dNTP concentration. qRT-PCR was performed with SYBR® Premix Ex Taq™ II (Takara, Japan) using a Thermal Cycler Dice™ Real-Time System (Takara). The methylation level was calculated following the function 2(CTlow - CThigh), where the CT (threshold cycle) value obtained with the qRT-PCR reaction at the low dNTP concentration was normalized to that obtained at the high dNTP concentration. The primer sequences used in this assay are listed on Table 2.
Primer extension
Primer extension was performed as per described protocols (21, 44) with minor modifications. One micromole of DNA primer was 32P-5’-terminally labeled by
incubation in a final volume of 25 l with 15 Ci -[32P]ATP and 9 U of polynucleotide kinase in protruding kinase buffer (Toyobo). The mixture was incubated at 37 °C for 1 h. The reaction mixture was then purified using Illustra™ MicroSpin™ G-25 columns (GE Healthcare). For the extension reaction, 0.5 l of the 32P-5’-phosphorylated primer was annealed by heating for 3 min at 95 °C, followed by cooling on ice using 0.2 g total RNA in 4.75 l RT buffer (Toyobo) containing 2.5 M dNTPs. Annealed primers were extended using 0.25 l ReverTra Ace® (25 U) for 1 h at 42 °C, stopped by the
14
addition of 5 l formamide loading dye and frozen at −80 °C. Primer extension products were resolved by performing electrophoresis on 8% polyacrylamide gels containing 4 M urea. Gels were dried and exposed to Amersham Hyperfilm™ ECL (GE Healthcare). The primer sequences for primer extension are listed on Table 2.
Quantification of methylated ribonucleosides with LC-MS/MS
28S rRNA was isolated from total RNA by performing agarose gel electrophoresis and gel extraction with the NucleoSpin® Gel and PCR Clean-up system (MACHEREY-NAGEL, Germany) according to the instruction manual. After denaturation by heating at 100 °C for 3 min, 1-2 g of 28S rRNA was chilled on ice immediately. Denatured RNA was hydrolyzed by nuclease P1 (1 U, Wako Pure Chemical Industries) in 10 mM ammonium acetate buffer (pH 5.3) at 45 °C for 2 h, subsequently dephosphorylated by incubating with phosphodiesterase I (0.0002 U, Sigma-Aldrich), alkaline phosphatase (0.3 U, Toyobo) and 0.1 volume of 1 M ammonium bicarbonate buffer (pH 7.9) at 37 °C for 2 h, as described previously (45). Ten pmol of br5U (Tokyo Chemical Industry, Japan) were added into the mixture as an internal standard. The enzymes were
subsequently removed by acetone precipitation. The supernatant was evaporated, and the ribonucleoside pellet was dissolved with 15 l of HPLC-grade water (Wako Pure
15
Chemical Industries).
Individual ribonucleosides were quantified using a Shimadzu Nexera™ UHPLC system coupled to LCMS-8050™ triple quadrupole mass spectrometer (Shimadzu, Japan). Reverse-phase HPLC separation was carried out using a Kinetex™ 2.6 m C18 column (2.1×150 mm, Phenomenex, USA) with a VANGUARD™ Pre-Column (2.1×5 mm, Waters, USA) at 30 °C with 0.1% formic acid in 80% acetonitrile (solvent B) gradient in 0.1% formic acid (solvent A) at a flow rate of 0.2 ml/min. The water-dissolved sample (5 l) was injected and eluted with the following gradient elution: initial isocratic elution with 0% solvent B for 3 min, followed by linear gradient elution from 0 to 8% B until 19 min, jumping to 100% B within 2 min and holding the status until 25.5 min. The column was then subsequently returned to the start conditions within 1 min and equilibrated for 4.5 min before the next sample injection. For determining elution positions of ribonucleosides on the chromatogram, standard
chemicals of m1A (Santa Cruz Biotechnology), N6-methyladenosine (m6A) (Carbosynth, UK), and br5U were used, and their retention times were revealed as 2.23 min, 15.1 min and 11.58 min, respectively.
The mass spectrometer was operated with an ion-spray source at 300 °C in positive ion mode, with unit resolution for Q1 and Q3, and other optimized parameters: interface
16
voltage, 4.0 kV; interface current, 0.1 A; flow rate of nebulizer gas, 3 l/min; flow rate of heating gas, 10 l/min; flow rate of drying gas, 10 l/min; collision gas (Ar), 270 kPa; desolvation line temperature, 250 °C; heat block temperature, 400 °C; conversion dynode potential, 10 kV; detector potential, 2.44 kV. Multiple reaction monitoring was used for detection of nucleosides with a dwell time of up to 100 ms. Q1 was set to transmit the parental ions MH+ at m/z 282.1, 282.1 and 324.6 for m1A, m6A, and br5U, respectively. The daughter ions were monitored in Q3 at m/z 150.1, 150.1, and 193.05 for m1A, m6A, and br5U, respectively. Linear calibration curves were obtained daily. All of the solvents and reagents used in this analysis were HPLC grade. The control of instrument and data analyses were performed using the LabSolutions LCMS (Ver.5.60) software (Shimadzu).
m
1A-RIP
For RIP against m1A containing RNA, total RNAs were extracted using Sepasol-RNA I Super G and treated with DNase I. Purified RNAs were fragmented using an NEBNext® Magnesium RNA Fragmentation Module (New England Biolabs, USA). After adding 20 g of glycogen, fragmented RNAs were precipitated with ethanol and resuspended in 100 l of IPP buffer [10 mM Tris-HCl (pH 7.5), 150 mM NaCl and 0.1% NP-40]. RNA
17
samples were added to 100 l of an antibody mixture that included IPP buffer and 50 l of Protein G Sepharose® beads (50% slurry). The mixture was rotated overnight at 4 °C. The beads were washed twice with IPP buffer. Immunoprecipitated RNAs were purified by phenol–chloroform-isoamyl alcohol extraction, and analyzed by qRT-PCR. Total RNAs were used as input samples for normalization of qRT-PCR data.
rRNA processing
Cells were cultured with free medium for 1 h, and then with methionine-free medium containing 20 Ci/ml 32P-labeled inorganic phosphate for 1 h (28). The metabolic labeling media were removed, and the cells were cultured with normal medium for 3 h. After cell harvesting, RNA was extracted using a FastPure™ RNA Kit (Takara) and analyzed by glyoxal agarose gel electrophoresis. Total RNA was visualized by ethidium bromide staining.
Bimolecular fluorescence complementation
The BiFC assay was performed as described previously (46). To generate plasmids expressing BiFC-tagged ribosomal proteins, the sequences of RPS18 and RPL11 were PCR-amplified from the cDNA of HeLa cells using primers tagged with SacI and XbaI
18
or ApaI and KpnI, respectively. The RPS18 and RPL11 segments were cloned into pBiFC-VN173 (22010, Addgene, USA) and pBiFC-VC155 (22011, Addgene),
respectively (47). Using Lipofectamine® LTX (Invitrogen), these BiFC plasmids were co-transfected with a pmCherry-N1 plasmid (Clontech Laboratories, USA), which was used as an internal control. Twenty-four hours after transfection, cells were further cultured with or without 100 g/ml puromycin for 24 h. The cells were washed twice with STM buffer [PBS with 2% FBS] and resuspended in 500 l of STM buffer. The fluorescence intensities of Venus and mCherry were measured by a BD FACSAria™ II (BD Biosciences, USA). The BiFC signal emitted by a cell was calculated using the following function: (fluorescent intensity of Venus)/(fluorescent intensity of mCherry), following the previous method (48).
Sucrose density gradient centrifugation
Sucrose density gradient centrifugation was performed as previous described manner (6, 49). Briefly, to investigate ribosomal subunit formation, cells were treated with 100
g/ml cycloheximide (CHX) for 5 min at 37 °C. The cells were washed twice with PBS containing CHX (100 g/ml) and lysed with lysis buffer [15 mM Tris-HCl (pH 7.5), 300 mM NaCl, 25 mM EDTA, 1% Triton X-100, 0.5 mg/ml heparin, 100 g/ml CHX,
19
1× EDTA-free protease inhibitor cocktail (Nacalai Tesque) and 100 U/ml RNase
inhibitor (Toyobo)]. The lysate was centrifuged at 9300 g for 10 min at 4 °C and loaded onto a linear 20-50% sucrose gradient buffer in 15 mM Tris-HCl (pH 8.0), 25 mM EDTA, and 300 mM NaCl. Centrifugation was conducted at 40,000 rpm for 2 h at 4 °C with a SW-41 Ti rotor (Beckman Coulter, USA), and fractions were collected from the top of the gradient (#1 to #18). The 18S and 28S rRNA levels in the fractions #1 to #18 were quantified by conducting qRT-PCR and normalized against those rRNA levels in an input RNA extracted from cells. The ratio of 18S rRNA : 28S rRNA (18S rRNA divided by 28S rRNA) was calculated as the small : large ribosomal subunit ratio.
To obtain the ribosomal or ribosome-free fractions, I performed sucrose density gradient centrifugation using lysis and gradient buffers containing 15 mM MgCl2 instead of 25 mM EDTA. 18S and 28S rRNAs, and -actin proteins were used as indicators for the ribosomal and ribosome-free fractions, respectively (50, 51).
Analysis of protein synthesis with
35S-methionine
The quantification of protein synthesis rate was performed as previously described (52, 53). Cells were plated onto 12-well plates in complete medium, and in the case of HCT116 cells, siRNAs were transfected. One day after cell seeding or 3 days after
20
transfection, the culture medium was switched to methionine-free DMEM with or without 50 g/ml CHX for 30 min at 37 °C, and cells were incubated with the same medium containing 20 Ci/ml 35S-methionine (PerkinElmer, USA) for 2 h at 37 °C. Cells were then washed twice with ice-cold PBS and solubilized in 50 l of RIPA buffer containing protease inhibitors. The supernatant was analyzed using a liquid scintillation counter (Beckman Coulter) and obtained values were normalized against the total protein content.
Co-immunoprecipitation
Cells were lysed in RIPA buffer supplemented with EDTA-free protease inhibitor cocktail. The same amounts of protein lysates were resuspended in TNE buffer [10 mM Tris-HCl (pH7.5), 150 mM NaCl, 1 mM EDTA, 1% NP-40] supplemented with EDTA-free protease inhibitor cocktail, and were immunoprecipitated with the indicated antibodies (1.8 g/ml) and Dynabeads® Protein G (Invitrogen). Bound proteins were then analyzed by Western blotting.
Cell cycle analysis by 5-ethynyl-2’-deoxturidibe staining
21
6-well plate) and cultured for 3 days after siRNA transfection. Then, cell cycle
evaluation was conducted using a Click-iT® EdU Imaging Kit (Invitrogen), according to the manufacturer’s protocol. First, cells were labeled with 10 M EdU (Invitrogen) in culture medium for 1 h at 37 °C. For subsequent DNA staining, EdU-stained cells were incubated with 2 g/ml Hoechst 33342 (Sigma-Aldrich) for 10 min. After the staining, cells were washed with PBS and subjected to FACS by using a BD FACSAria™ II instrument.
Terminal deoxynucleotidyl transferase dUTP-biotin nick labelling
assay
Cells were plated onto poly-D-lysine coated 8-well chamber slides (BD Biosciences) (1.6×10⁴-2.4×10⁴ cells/well) and cultured for 3 days after siRNA transfection. Then, the cells were fixed with 4% paraformaldehyde in PBS for 25 min at 4 °C, and in situ detection of apoptotic cells was performed using DeadEnd™ Fluorometric TUNEL System (Promega, USA), according to the manufacturer’s instructions. The nuclei were then counterstained using 2 g/ml Hoechst 33342. The cells were observed using the fluorescent microscope imaging system BIOREVO BZ-9000 (Keyence, Japan), and TUNEL-positive cells were measured in three fields per sample. The percentage of
22
TUNEL-positive cells was calculated as follows: (TUNEL-positive/total cells) × 100.
Cell proliferation assay
To analyze the cell proliferation rate, cells were seeded (1×10⁵ cells/well) in 6-well plates and transfected them with the indicated siRNA. The cells were then trypsinized into single-cell suspensions and automatically counted using a TC10™ Automated Cell Counter (Bio-Rad Laboratories) on days 1, 2, 3, and 4, where the first day after seeding was day 0.
Statistical analysis
The unpaired Student’s t-test was used to compare two groups, and one-way ANOVA followed by Tukey’s post-hoc test was used to compare multiple groups. The statistical analysis of fold-change data was performed by bootstrap and permutation tests using the web application BootstRatio (54).
23
Results
NML binds to 28S rRNA
A large number of RNA methyltransferases interact with the specific target RNA
through their substrate-binding site (55). To date, Yang et al. have shown the interaction of NML with rRNAs using human non-small lung carcinoma H1299 cells (56). To confirm the interaction between NML and 28S rRNA in human epithelial
adenocarcinoma HeLa cells, I performed RNA immunoprecipitation (RIP) experiments using an antibody against NML. In this assay, endogenous NML proteins were
precipitated using an antibody against NML. After immunoprecipitation, RNAs were then purified from the precipitates, and 28S rRNA levels were quantified by performing quantitative reverse-transcriptase (qRT)-PCR using a specific primer set (Table 1). 28S rRNA was co-immunoprecipitated with NML from the whole cell (Fig. II-1A).
Furthermore, I isolated the nuclear extracts from the cells, and detected the interaction between 28S rRNA and NML (Fig. II-1B). On the other hand, 5S rRNA was not significantly co-immunoprecipitated with NML (Fig. II-1A, B). From these results, I confirmed that NML has the potential to associate with 28S rRNA.
24
NML is required for methylation of 28S rRNA
In yeast 25S rRNA, two sites with the m1A modification have been identified (6, 21), and these adenosine molecules and also the neighboring sequences are well conserved among eukaryotes, including humans and mice (Fig. II-2A; A645 and A2142 of 25S rRNA in Saccharomyces cerevisiae correspond to A1309 and A3625 of 28S rRNA in
Homo sapiens, and A1136 and A3301 of 28S rRNA in Mus musculus, respectively).
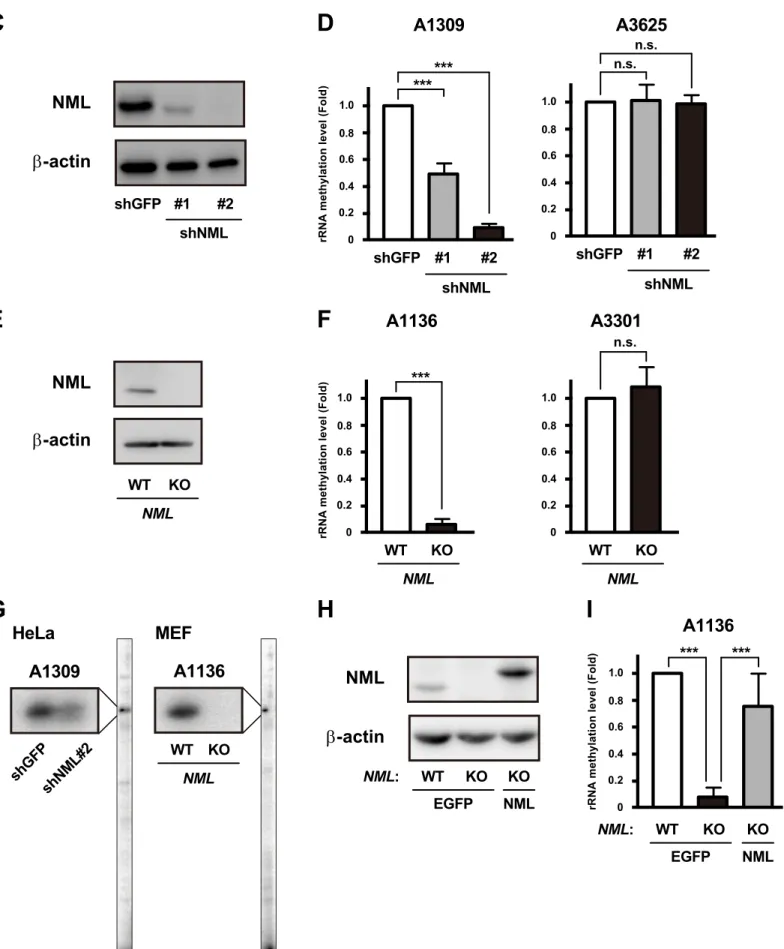
Therefore, to investigate the effect of NML on rRNA methylation, I performed site-specific semi-quantitative RT-PCR analysis (Fig. II-2B). I used HeLa cells stably expressing NML-knockdown (KD) constructs (shNML#1 and #2) (Fig. II-2C). Methylation levels around A1309, which is methylated by Rrp8 in yeast (6), were significantly lower in shNML-transfected cells than in control cells expressing shRNAs against green fluorescent protein (shGFP) (Fig. II-2D; left). In contrast, methylation levels around A3625, which is methylated by Bmt2 in yeast (21), were very low in control cells [rRNA methylation levels around A1309 and A3625 (mean ± S.D.) were 19.05 ± 0.47 and 1.32 ± 0.21, respectively.]. In addition, the methylation levels were not markedly changed by knockdown of NML (Fig. II-2D; right). Consistently, methylation levels around A1136, which corresponds to A1309 of 28S rRNA in humans, were reduced in NML-knockout (NML KO) immortalized mouse embryonic fibroblasts
25
(MEFs) compared with in NML wild-type (NML WT) MEFs (Fig. II-2E, F; left).
Furthermore, methylation levels around A3301 were quite low and were not affected by NML depletion (Fig. II-2F; right).
Next, to determine the precise methylation site, I performed primer extension analysis. Strong stop signals at positions A1309 and A1136 were observed in 28S rRNAs of shGFP and NML WT cells (Fig. II-2G). By contrast, these stop signals were reduced in 28S rRNAs of NML KD and KO cells. Moreover, the reduction of
methylation levels around A1136 was attenuated by the expression of FLAG- and hemagglutinin (HA) (FLAG-HA)-tagged NML, but not by the expression of control EGFP (Fig. II-2H, I). These results indicate that NML is responsible for the methylation at A1309 and A1136 in 28S rRNA of human and mouse cells.
Rossmann-fold methyltransferase-like domain of NML is essential for
28S rRNA methylation
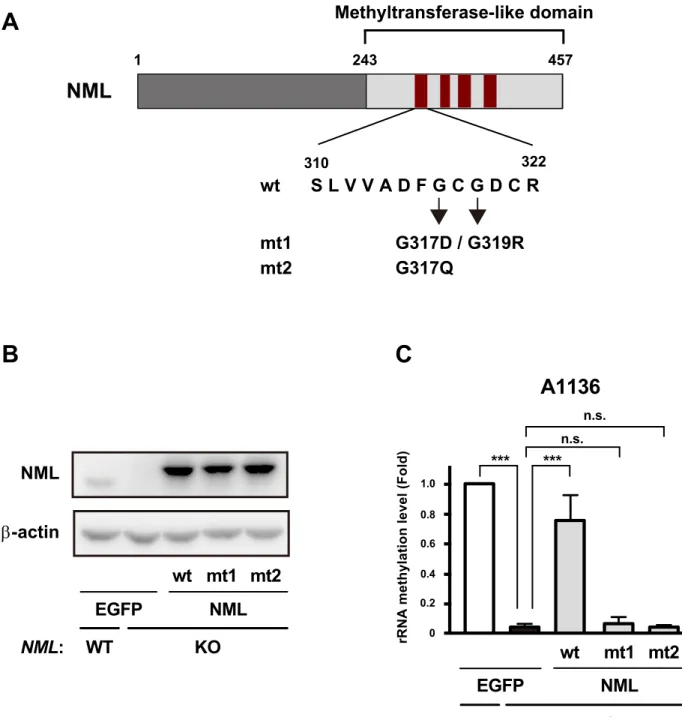
A previous study has revealed that the C-terminal region of NML contains a Rossmann-fold methyltransferase-like domain, which interacts with the methyl donor SAM (39) (Fig. II-3A). To investigate whether this domain is indispensable for 28S rRNA methylation induced by NML, I performed site-specific semi-quantitative RT-PCR
26
analysis using the immortalized MEFs, which were stably expressed FLAG-HA-tagged wild-type NML (NML-wt) or mutated NML constructs (NML-mt1 or NML-mt2). These mutated NML proteins lack the SAM-binding ability (39) (Fig. II-3A, B). Expression of NML-wt increased rRNA methylation levels around A1136 in NML KO MEFs (Fig. II-3C). Conversely, no significant enhancement of rRNA methylation was induced by expression of control EGFP, NML-mt1 or NML-mt2 in NML KO MEFs. These results suggest that NML regulates the methylation of 28S rRNA through its methyltransferase-like domain-dependent mechanism.
NML is responsible for m
1A modification of 28S rRNA
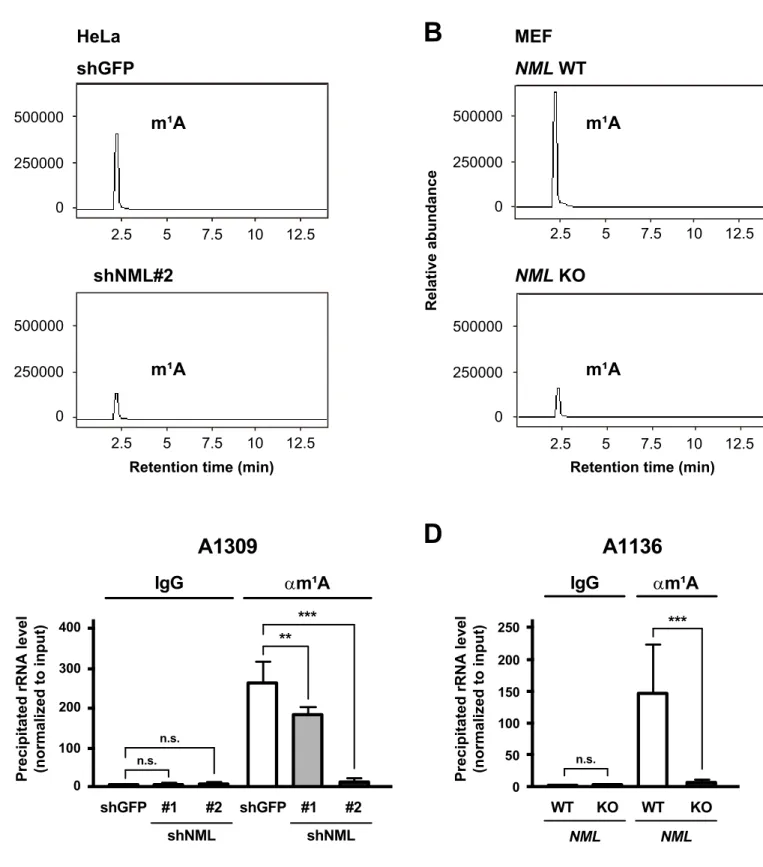
To investigate whether the NML-mediated 28S rRNA methylation is m1A modification or not, I quantified the base modifications, included in a 28S rRNA fragment by liquid chromatography/tandem mass spectrometry (LC-MS/MS). In NML KD and KO cells, the peaks corresponding to m1A were reduced compared with those in control KD and
NML WT cells (Fig. II-4A, B). Moreover, RIP experiments using an antibody against
m1A revealed that m1A modifications around A1309 and A1136 were significantly reduced by NML depletion (Fig. II-4C, D). From these results, I revealed that NML is a responsible factor for m1A modifications at positions 1309 and 1136 in human and
27
mouse 28S rRNA.
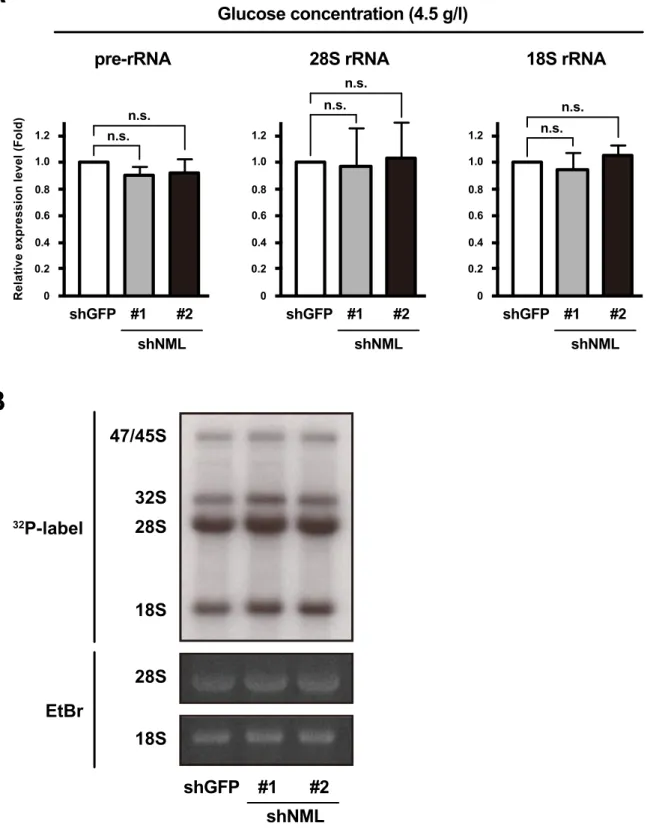
NML hardly alters rRNA transcription and processing under high
glucose environments
Previous reports have shown that NML inhibits rRNA transcription in human cells under glucose deprivation (39). Moreover, it has been reported that the depletion of certain factors involved in ribosome biogenesis inhibits rRNA transcription and/or processing (57). To evaluate the effect of NML KD on rRNA transcription and
processing under conditions with 4.5 g/l glucose used in this study, I checked pre- and mature rRNA levels. In shNML-expressing HeLa cells, pre- and mature rRNA levels were unchanged in comparison with those in control cells (Fig. II-5A). Furthermore, the analysis of pre-rRNA processing using metabolic labeling with 32P-orthophosphate showed that there was not substantial change in the distribution patterns on gels of pre-rRNAs (47S and 45S, and 32S) and mature pre-rRNAs (28S and 18S) between shGFP- and shNML-expressing HeLa cells (Fig. II-5B). These results indicate that NML modulates rRNA base methylation without altering rRNA transcription and processing under high glucose conditions.
28
NML participates in the ribosomal subunit association
Modifications of rRNA contribute to the ribosomal subunit formation and association (16, 58-60). To investigate the effect of NML reduction on the interaction between ribosomal subunits, I conducted bimolecular fluorescence complementation (BiFC) to visualize ribosomal subunit joining (46). The 40S ribosomal protein S18 (RPS18) and 60S ribosomal protein L11 (RPL11), which are positionally adjacent to each other on the surface of each subunit, were tagged with the N- or C-terminal halves of the yellow fluorescent protein Venus, respectively (yielding S18-VN and L11-VC; Fig. II-6A). Subunit interaction was detected as Venus signal (hereafter referred to as BiFC signal). I quantified the BiFC signal using fluorescence activated cell sorting (FACS) and
confirmed that the signal was only detected from the S18-VN and L11-VC co-transfected cells (Fig. II-6B; S18-VN/L11-VC). Moreover, the BiFC signal was
dramatically reduced when cells were treated with puromycin, an aminoacyl-tRNA-like molecule which induces 80S ribosome dissociation (46, 61) (Fig. II-6B-D). These results support that the BiFC signal derived from S18-VN and L11-VC expression is a consequence of subunit interaction. Knockdown of NML increased the population of cells, emitted a low BiFC signal, and decreased the proportion of cells that emitted a high BiFC signal (Fig. II-6C). Consistently, the median of BiFC signals was also
29
decreased by NML KD (Fig. II-6D).
NML contributes to the 60S ribosomal subunit formation without
changing the protein production rate
To evaluate the ribosomal subunit formation, I performed sucrose density gradient centrifugation under the EDTA existent conditions, which induce the dissociation of the 80S ribosome complexes into the 40S and 60S subunits (6). In this experiment, the cell lysates were centrifuged and fractionated, and the ribosomal subunit ratio was
quantified by measuring the 18S and 28S rRNA levels in each fraction (Fig. II-7A). The ratio of 18S rRNA : 28S rRNA (amount of 18S rRNA was divided by that of 28S rRNA) in shNML cells was significantly higher than that of shGFP cells (Fig. II-7B). Notably, in these cell lines, 18S and 28S rRNAs were distributed to similar extents in fractions 4-8 and 9-15, respectively (Fig. II-7A). Considering that this assay separates cellular organelles including ribosomal subunits, depending on their individual densities
(mass/volume), these results indicate that NML reduction results in fewer 60S subunits, rather than the formation of abnormal subunits.
The primary function of ribosome is protein synthesis. Hence, to investigate whether NML depletion alters bulk protein translation, I measured the incorporation of
30
35S-labeled methionine (35S-Met) into polypeptide chains. Pretreatment with protein
synthesis inhibitor cycloheximide (CHX) substantially blocked amino acid
incorporation (Fig. II-7C). In NML KD cells, the rates of 35S-Met incorporation were not markedly different from those in control cells. Overall, these results suggest that NML is involved in the formation of 60S ribosomal subunits without affecting bulk protein synthesis.
NML depletion induces the p53 protein accumulation through RPL11
Abundance of ribosomal proteins outside of the ribosome increases when ribosomal biogenesis is perturbed by nucleolar stress (62-64). Several ribosomal proteins,
including RPL11, bind to MDM2 and inhibit the E3 ubiquitin ligase function of MDM2 toward p53, leading to p53 accumulation and activation (65-67). To investigate whether NML is involved in the regulation of p53 activity through ribosomal proteins, I
analyzed the levels of RPL11 protein in the ribosome-free fraction by performing sucrose density gradient centrifugation under the EDTA absent conditions followed by Western blotting. The amount of ribosome-free RPL11 was increased in shNML cells (Fig. II-8A), indicating the enhanced RPL11 accumulation outside of the ribosome. Furthermore, co-immunoprecipitation experiments showed that the interaction between
31
RPL11 and MDM2 was increased in shNML cells (Fig. II-8B). Considering that p53 activity in the HeLa cells and immortalized MEFs is inhibited by E6 protein from oncogenic HPV type 16 and by SV40 large T-antigen, respectively (68, 69), these cells are not suitable for the analysis of p53 functions. Thus, I used human colon carcinoma HCT116 p53 wild-type (p53+/+) and null (p53−/−) cells, and investigated the possibility that NML depletion induces p53 activation through RPL11. In p53+/+ cells, NML KD increased p53 protein levels, and this p53 accumulation was abrogated by the
concomitant reduction of RPL11 (Fig. II-8C).
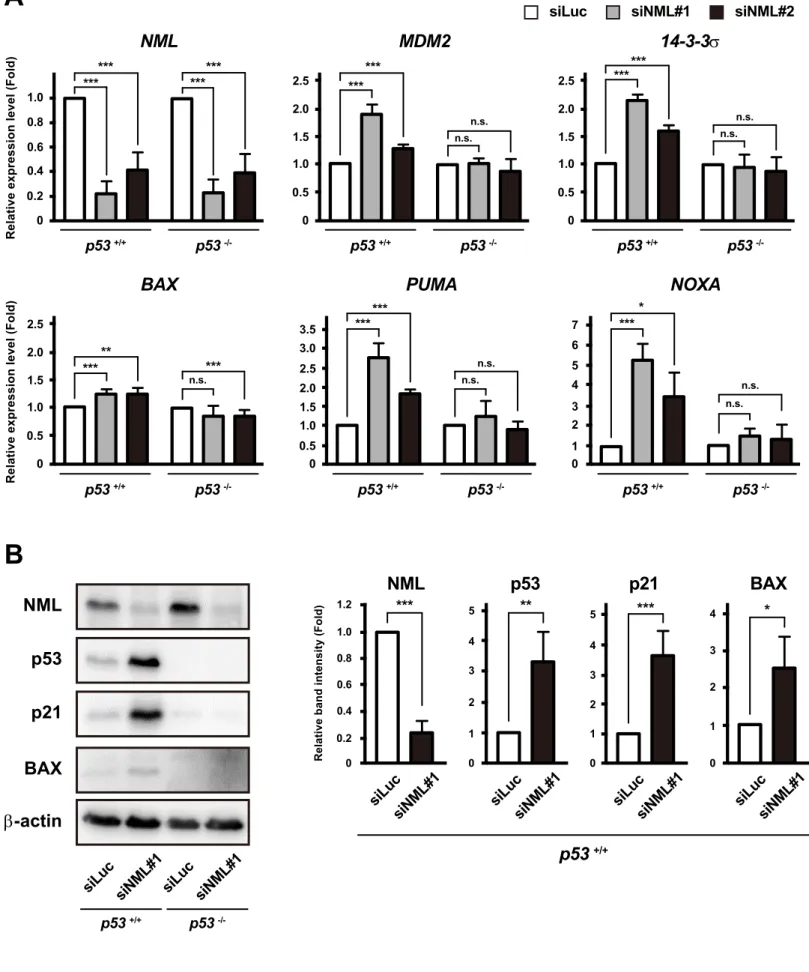
NML depletion activates the p53 pathway
Next, I evaluated the expression of p53 target genes. NML KD upregulated the p53 target gene expression at both the mRNA and protein levels in p53+/+ cells, but not in
p53−/− cells (Fig. II-9A, B). Additionally, the increment in the p53 target genes induced by NML depletion was also observed in normal MEFs, but not in the immortalized MEFs (Fig. II-9C). Taken together, these results indicate that NML deficiency increases the RPL11-MDM2 interaction and induces the activation of p53 pathway.
32
NML reduction induces cell cycle arrest and apoptosis, and inhibits
translation through the p53 pathway.
p53 contributes to the regulation of cell proliferation by inducing cell cycle arrest and apoptosis, or by inhibiting protein synthesis (30-32, 70). Therefore, I investigated the effect of NML on these p53-dependent cellular events. Firstly, I performed cell cycle analysis, and observed that NML KD decreased the proportion of S-phase cells and increased the ratio of G2- and M- (G2/M) phase cells in a p53-dependent manner (Fig. II-10A). Moreover, a terminal deoxynucleotidyl transferase-mediated dUTP-biotin nick end labeling (TUNEL) assay showed that the percentage of TUNEL-positive cells was significantly increased by NML KD in p53+/+ cells, while this was not the case in p53−/− cells (Fig. II-10B). Further, the rates of 35S-Met incorporation into synthesized proteins were reduced by NML KD in p53+/+ cells (Fig. II-10C). On the other hand, in p53−/− cells, the rates of the labeled amino acid incorporation were not significantly changed by NML reduction.
NML regulates cell proliferation in a p53-dependent manner
Finally, I assessed the influence of NML depletion on cell proliferation, and revealed that NML KD suppressed cell growth in a p53-dependent manner (Fig. II-11A).
33
Additionally, in both HCT116 p53+/+ and p53−/− cells, NML KD also significantly reduced methylation levels around A1309, as well as interactions between ribosomal subunits (Fig. II-11B, C). Altogether, these findings suggest that NML modulates the large ribosomal subunit formation through m1A modification of 28S rRNA, thereby regulating cell proliferation via the p53-dependent mechanisms.
34
Discussion
In this chapter, I showed that the nucleolar protein NML regulates m1A modification of 28S rRNA through a SAM-binding domain-dependent mechanism (Fig. II-1-4).
Additionally, NML depletion decreases 60S ribosomal subunit formation (Fig. II-7). Intriguingly, I observed that NML depletion induces RPL11-MDM2 interactions and increases the levels of p53 protein, thereby activating the p53 pathway (Fig. II-8, 9). Consequently, the proliferation of NML-depleted cells is suppressed via p53-dependent cell cycle arrest, apoptosis, and protein synthesis inhibition (Fig. II-10, 11). Therefore, these results suggest that NML is required for the m1A modification of 28S rRNA, and that NML deficiency inhibits cell proliferation in a p53-dependent manner.
NML was originally identified as an H3K9me2-binding protein that forms a complex with SIRT1 and SUV39H1 to suppress rRNA transcription under glucose starvation (39). My data raise the question of how the molecular function of NML switches from an epigenetic suppressor for rRNA transcription to a base
methyltransferase of rRNA. Interestingly, some recent reports have shown that NML binds to rRNA and also several ribosomal proteins under normal glucose conditions (56, 71). Conversely, the interaction between NML and rRNA is disturbed after glucose deprivation, thereby the recruitment of SIRT1 to NML is enhanced. Indeed, I confirmed
35
that NML interacts with 28S rRNA in HeLa cells (Fig. II-1) and that NML depletion does not change the levels of rRNA transcription at a 4.5 g/l glucose concentration (Fig. II-5). These results raise the possibility that NML bifunctionally regulates the distinct steps of ribosome biogenesis, involving rRNA transcription and methylation, in response to environmental changes.
Of the rRNA modifications, 2’-O-ribose methylation, which affects not only ribosome biogenesis but also ribosomal functions, including translational efficiency and fidelity (16), is one of the best characterized modifications. Furthermore, Fibrillarin (FBL) has been identified as a 2’-O-ribose methyltransferase (42, 72). Recently, it has been reported that p53 directly represses FBL gene transcription and decreases the 2’-O-ribose methylation of rRNAs, and these changes induce the impairment of translational function of ribosomes, such as the stop-codon readthrough and amino acid
misincorporation (37). Furthermore, FBL overexpression facilitates tumorigenesis and is correlated to poor survival of cancer-affected individuals (73-75). These observations imply that rRNA modification plays a crucial role in cancer development. Intriguingly, the levels of m1A-modified nucleosides are elevated in the urine of individuals with cancer (76, 77). Hence, my results suggest that the NML-dependent m1A modification of rRNA could influence cancer development through the p53 pathway. As a further
36
study, the potential roles of NML-mediated rRNA modifications in cancer development should be explored.
Fig. II-1
***
28S rRNA
Relative rRNA level (Fold)
0 1 2 3
IgG
αNML
A
n.s.
5S rRNA
0 0.5 1.0 1.5IgG
αNML
Cytoplasm
Nucleus
NML
α-tubulin
Histone H3
**
28S rRNA
Relative rRNA level (Fold)
0 4 6 8
IgG
αNML
10 2n.s.
5S rRNA
0 1.0 2.5IgG
αNML
2.0 0.5 1.5B
Fig. II-1 NML binds to 28S rRNA.
(A, B) Interaction between rRNA and NML in whole-cell extracts (A) and nuclear extracts (B) of HeLa cells.
The binding of NML to 28S or 5S rRNAs was examined with RIP assay using an anti-NML antibody (αNML). An conjugated affinity purified immunoglobulin (IgG) from mouse was used as a control. In the left panel in B, protein levels of NML in the cytoplasmic or nuclear fractions were determined by Western blotting. α-tubulin and histone H3 were used as each fraction marker. Mean values ± S.D. are shown (n = 3). **P < 0.01; ***P < 0.005; n.s., not significant (bootstrap and permutation tests).
A
*
Fig. II-2
M. musculus S. cerevisiae H. sapiens 1122 1295 633 663 1154 1327 A645 A1309 A1136 M. musculus S. cerevisiae H. sapiens 3287 3611 2128 2160 3319 3643 A2142 A3625 A3301*
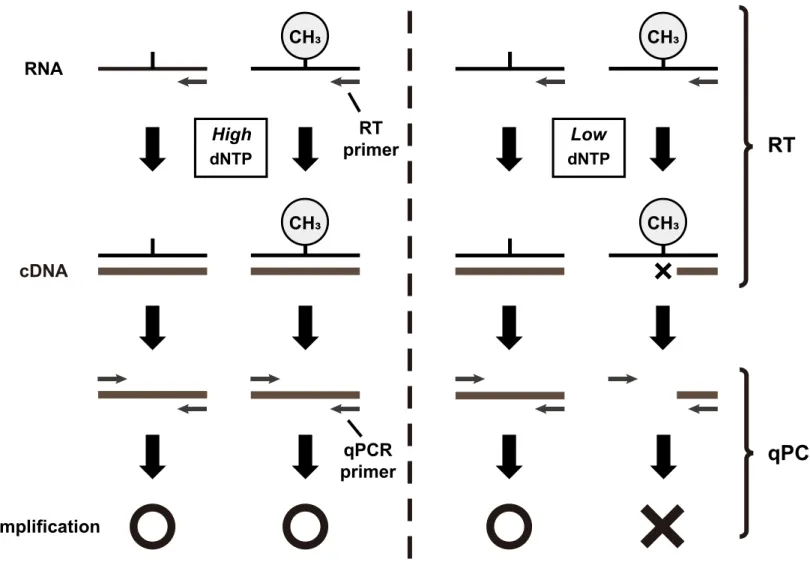
Principal for Site-specific semi-quantitative RT-PCR analysis
Methylation level = 2
(CT low - CT high)RNA CH3 High dNTP RT primer cDNA qPCR primer Amplification CH3
RT
qPCR
Low dNTP CH3 CH3B
(Figures and Figure legends continued on next page)
Fig. II-2 NML is need for methylation of 28S rRNA.
(A) Multiple sequence alignment of the regions neighboring two sites of m¹A (A645 and A2142 in squares) of 25S
rRNA (633-663 and 2128-2160) in S. cereviaiae, of 28S rRNA (1295-1327 and 3611-3643) in H. sapiens and of 28S rRNA (1122-1154 and 3287-3319) in M. musculus are shown. Conserved adenosine ribonucleotides focused in this study are marked with asterisks (*).
(B) Schematic representation of the site-specific semi-quantiitative RT-PCR analysis for RNA methylation detection.
A1309
rRNA methylation level (Fold) 0 0.2 0.6 0.8 1.0 0.4 shGFP #1 ****** #2 shNML 0 0.2 0.6 0.8 1.0 0.4 A3625 shGFP #1 n.s. n.s. #2 shNML
rRNA methylation level (Fold)
A1136 WT KO 0 0.2 0.6 0.8 1.0 0.4 *** NML NML β-actin shGFP #1 #2 shNML
C
D
A3301 WT KO 0 0.2 0.6 0.8 1.0 0.4 n.s. NML NML β-actin WT KO NMLE
F
shGFP shNML#2 A1309 HeLa MEF A1136 WT KO NMLG
A1136rRNA methylation level (Fold) 0 0.2 0.6 0.8 1.0 0.4 *** *** WT KO KO EGFP NML: NML NML β-actin WT KO KO EGFP NML: NML
H
I
Fig. II-2 (continued)
(C, D) Methylation levels around a region of 28S rRNA, including A1309 or A3625, in HeLa cells expressing shRNAs
targeting GFP (shGFP) or NML (shNML#1 or #2) were analyzed by qRT-PCR analysis (D). shGFP was used as a control shRNA. Protein levels of NML in the indicated cells were determined by Western blotting (C). Mean values ± S.D. are shown (n = 3). ***P < 0.005; n.s., not significant (bootstrap and permutation tests).
(E, F) Methylation levels were measured by qRT-PCR analysis around a region of 28S rRNA, including A1136 or
A3301, in NML WT or KO immortalized MEFs (F). NML protein levels were determined by Western blotting (E). Mean values ± S.D. are shown (n = 3). ***P < 0.005; n.s., not significant (bootstrap and permutation tests).
(G) Modification states at A1309 of human 28S rRNA in shGFP- or shNML#2-expressing HeLa cells and at A1136 of
mouse 28S rRNA in NML WT or KO immortalized MEFs, were analyzed by primer extension method.
(H, I) Expression of FLAG-HA-tagged NML recoverd the methylation levels around A1136 of 28S rRNA in NML KO
immortalized MEFs, were demonstrated by Western blotting (H) and qRT-PCR analysis (I). Mean values ± S.D. are shown (n = 3). ***P < 0.005 (bootstrap and permutation tests).
Fig. II-3
243 457 Methyltransferase-like domainNML
1 S L V V A D F G C G D C R 310 322 G317D / G319R G317Q wt mt1 mt2A
B
C
A1136
rRNA methylation level (Fold) 0
0.2 0.6 0.8 1.0 0.4 n.s. *** *** n.s. WT wt mt1 NML: mt2 EGFP NML KO NML β-actin WT wt mt1 NML: mt2 EGFP NML KO
Fig. II-3 NML regulates rRNA methylation through its Rossmann-fold methyltransferase-like domain.
(A) Schematic representation of wild-type (wt) and point mutant NML are indicated. The mutations were induced in
the Rossmann-fold methyltransferase-like domain (mt1 and mt2). Conserved motifs in the SAM methyltransferase are shown as the red bars.
(B) Protein levels of NML in NML WT or KO immortalized MEFs expressing EGFP or FLAG-HA-tagged NML were
analyzed by Western blotting.
(C) Methylation levels around A1136 of 28S rRNA in the indicated cells were measured by qRT-PCR analysis. Mean
Fig. II-4
Retention time (min)
Relative abundance 500000 250000 0 2.5 5 7.5 10 12.5 500000 250000 0 2.5 5 7.5 10 12.5 HeLa shGFP m¹A m¹A shNML#2
A
C
A1309
0 100 300 400 200 n.s. n.s. ** ***Precipitated rRNA level (normalized to input)
shGFP #1 #2 shNML shGFP #1 #2 shNML IgG αm¹A
A1136
0 50 150 200 100 n.s. ***Precipitated rRNA level (normalized to input)
IgG αm¹A 250 WT KO NML WT KO NML
B
D
m¹A m¹ARetention time (min) 500000 250000 0 2.5 5 7.5 10 12.5 500000 250000 0 2.5 5 7.5 10 12.5 MEF NML WT NML KO Relative abundance m¹A m¹A
Fig. II-4 NML is related to m¹A modification in 28S rRNA.
(A, B) The amount of m¹A modified ribonucleosides in 28S rRNA of shGFP or shNML#2 transfected HeLa cells (A)
and of NML WT or KO immortalized MEFs (B) was analyzed by LC-MS/MS.
(C, D) The m¹A levels around A1309 in 28S rRNA of shGFP-or shNML#2-expressing HeLa cells (C) and around
A1136 in 28S rRNA of NML WT or KO immortalized MEFs were investigated by RIP using an anti-m¹A
antibody (αm¹A). An unconjugated affinity purified IgG from mouse was used as a control. Mean values ± S.D. are shown (n = 3). **P < 0.01; ***P < 0.005; n.s., not significant (one-way ANOVA followed by Tukey’s test) in C. ***P < 0.005; n.s., not significant (Student’s t-test) in D.
Fig. II-5
A
Relative expression level (Fold) 0 0.2 0.6 0.8 1.0 0.4 shGFP #1 n.s. n.s. #2 shNML 1.2 pre-rRNA 0 0.2 0.6 0.8 1.0 0.4 shGFP #1 n.s. n.s. #2 shNML 1.2 28S rRNA 0 0.2 0.6 0.8 1.0 0.4 shGFP #1 n.s. n.s. #2 shNML 1.2 18S rRNA Glucose concentration (4.5 g/l) 32P-label shGFP #1 #2 shNML 47/45S 32S 28S 18S 28S 18S EtBr
B
Fig. II-5 NML does not affect the state of rRNA trascription and processing under glucose-rich conditions.
(A) The levels of pre (45S)-, 28S and 18S rRNA of HeLa cells transfected shGFP, shNML#1 or #2 were analyzed
by qRT-PCR. Mean values ± S.D. are shown (n = 3). n.s., not significant (bootstrap and permutation tests).
(B) The states of RNA processing in the indicated cells were investigated by labeling nascent RNA with 32P
orthophosphate. The representative images of 28S and 18S rRNA analyzed by agarose gel electrophoresis are also shown.
Fig. II-6
RPS18 A1309 (28S rRNA) RPL11 RPL11 -VC (L11-VC) RPL18 -VN (L18-VN)Small subunit Large subunit
Cherry Venus Cherry + No transfection Cherry S18-VN S18-VN / L11-VC L11-VC S18-VN / L11-VC + Puro 0 5 15 20 25 10 30 0 0.4 0.8 1.2 1.6 2 shLuc shLuc + Puromycin shNML#1 shNML#2
BiFC signals [Venus/Cherry]
Cell count (×10
² cells)
shLuc
#1 #2
Median of BiFC signals
[Venus/Cherry ] 0 0.1 0.3 0.4 0.5 0.2 *** *** 0.6 *** +Puro -shNML
A
B
C
D
Fig. II-6 NML reduction suppresses the interaction between ribosomal subunits.
(A) Crystal structure of the human ribosome (Protein Databank ID; 4V6X) are shown. RPS18, RPL11 and A1309 of
28S rRNA are highlighted in different colors. The BiFC model used in this study are also schematically
represented. In this model, RPS18 and RPL11 are tagged with the N- or C-terminal parts of Venus, respectively (S18-VN and L11-VC).
(B-D) The interaction between ribosomal subunits in HeLa cells transfected shRNA targeting Luciferase (shLuc) or
NML (shNML#1 or #2) was analyzed by BiFC following FACS analysis. The shLuc was used as a control shRNA. S18-VN and/or L11-VC were co-transfected into cells with mCherry as a transfection control marker, and treated with or without puromycin (Puro). Venus and mCherry emissions (BiFC signals) from transfected HeLa cells in the indicated conditions detected are indicated in B. The distribution and median of the BiFC signals are shown in C and D, respectively. Mean values ± S.D. are shown (n = 3). ***P < 0.005 (one-way ANOVA followed by Tukey’s test).
Fig. II-7
A
shGFP shNML#1 shNML#2 shGFP shNML#1 shNML#2 28S rRNA 18S rRNA sucrose 20% 50% 0 1 2 3 4Relative expression level (Fold)
1 2 3 4 5 6 7 8 9 10 11 12 13 14 15 16 17 18 Fraction number 0 0.2 0.6 0.8 1.0 0.4 shGFP #1 #2 shNML * *** 1.2 1.4 Subunit ratio [18S rRNA/28S rRNA ] shGFP #1 #2 35S-Methionine incorporation (% of shGFP) 0 20 60 80 100 40 *** n.s. 120 n.s. +CHX -shNML 140
B
C
Fig. II-7 NML participates in the 60S ribosomal subunit formation without affecting the protein synthesis rate.
(A, B) Ribosomal subunit formation in shGFP-, shNML#1- or shNML#2-transfected HeLa cells were analyzed by
sucrose density gradient centrifugation following qRT-PCR. 28S and 18S rRNA levels in each fraction were normalized against those obtained with non-centrifugated RNA samples (A). The ratios between the total amounts of 18S and 28S rRNAs are shown as subunit ratios for the indicated cells (B). Mean values ± S.D. are shown (n = 3). *P < 0.05; ***P < 0.005; n.s., not significant (one-way ANOVA followed by Tukey’s test).
(C) The total protein synthesis rates in the indicated cells were measured based on 35S-Methionine incorporation
into newly synthesized polypeptides. Cycloheximide (CHX) was used as a positive control.
Fig. II-8
NML β-actin shGFP shNML#2 RPL11 28S rRNA 18S rRNAFree Ribosome Free Ribosome
Total lysates shGFP shNML#2
A
NML MDM2 RPL11 shGFP shNML#2 shGFP shNML#2 shGFPshNML#2 Total lysates IgG αMDM2 IP p53 RPL11 NML β-actin siLuc siNML #1 #2 siLuc siNML #1 #2 siLuc siRPL11 0 0.5 1.5 2.0 2.5 1.0 p53 ****** siLuc 3.0 3.5 n.s. n.s. siLuc siNML#1 siNML#2Relative band intensity (Fold)
siRPL11
B
C
Fig. II-8 NML depletion increases p53 protein levels through RPL11-mediated mechanism.
(A) Protein levels of RPL11 in the ribosome-free (Free) and ribosomal (Ribosome) fraction of shGFP- or
transfected HeLa cells were analyzed by sucrose gradient density centrifugation followed by Western blotting (top three rows). 28S and 18S rRNAs are detected as references for ribosome sedimentation by agarose gel electrophoresis (bottom row).
(B) Interaction between RPL11 and MDM2 in shGFP- or shNML#2-transfected HeLa cells was investigated by
immunoprecipitation (IP) with an anti-MDM2 antibody (αMDM2) followed by Western blotting. An unconjugated affinity purified IgG from mouse was used as a control for IP.
(C) Protein levels of p53 in HCT116 p53+/+ cells, which were treated with siRNA targeting Luciferase (siLuc) or NML
(siNML#1 or #2) and/or RPL11 (siRPL11) for two days, were analyzed by Western blotting. Representative Western blotting data are shown. The lower graph indicates the band intensity of p53 normalized that of β-actin. Mean values ± S.D. are shown (n = 3). ***P < 0.005; n.s., not significant (bootstrap and permutation tests).
Fig. II-9
siLuc siNML#1 siNML#2
0 0.2 0.4 0.6 NML 0.8 1.0
Relative expression level (Fold)
*** *** *** *** p53 +/+ p53 -/-0 0.5 1.0 1.5 MDM2 2.0 2.5 ****** n.s. n.s. p53 +/+ p53 -/-0 0.5 1.0 1.5 14-3-3σ 2.0 2.5 *** *** n.s. n.s. p53 +/+ p53 -/-*** 0 0.5 1.0 1.5 BAX 2.0 2.5 *** ** n.s.
Relative expression level (Fold)
p53 +/+ p53 -/-0 0.5 1.0 1.5 PUMA 2.0 2.5 ****** n.s. n.s. 3.0 3.5 p53 +/+ p53 -/-0 1 2 3 NOXA 4 5 *** * n.s. n.s. 6 7 p53 +/+ p53 -/-p53 p21 NML β-actin BAX siLuc siNML#1 p53 +/+ p53 -/-siLuc siNML#1
A
B
NMLRelative band intensity (Fold) 0
0.2 0.6 0.8 1.0 0.4 *** 1.2 siLuc siNML#1 p53 0 1 3 4 2 ** 5 siLuc siNML#1 p21 0 1 3 4 5 2 *** siLuc siNML#1 BAX 0 1 2 3 * 4 siLuc siNML#1 p53 +/+
Fig. II-9 (continued)
Fig. II-9 NML depletion induces the activation of p53 pathway.
(A) The mRNA levels of p53 target genes in HCT116 p53+/+ or p53-/- cells, which were treated with siLuc, siNML#1
or siNML#2 for three days, were measured by qRT-PCR. Graphs are indicated as the fold change relative to corresponding mRNA levels in siLuc-transfected HCT116 p53+/+ or p53-/- cells. Mean values ± S.D. are shown
(n = 3). *P < 0.05; **P < 0.01; ***P < 0.005; n.s., not significant (bootstrap and permutation tests).
(B) Protein levels of p53 targets in HCT116 p53+/+ or p53-/- cells, which were treated with siLuc or siNML#1 for three
days, were analyzed by Western blotting. Representative Western blotting data are shown in the left panel.
The right graphs indicate the band intensity of the indicated proteins normalized that of β-actin. Mean values ± S.D. are shown (n = 3). *P < 0.05; **P < 0.01; ***P < 0.005 (bootstrap and permutation tests).
(C) The mRNA levels of p53 target genes in normal and immortalized MEFs (NML WT or KO) were investigated
by qRT-PCR. In the case of normal MEFs, the cells were treated with siLuc or siNML#1. Three days after transfection, the indicated mRNA levels were analyzed. Mean values ± S.D. are shown (n = 3). *P < 0.05; ***P < 0.005; n.s., not significant (bootstrap and permutation tests).
Normal MEFs
NML
Relative expression level (Fold) 0
0.2 0.6 0.8 1.0 0.4 *** siLuc siNML
Mdm-2
0 0.5 1.5 2.0 2.5 1.0 *** 3.0 siLuc siNMLPUMA
0 0.5 1.5 2.0 2.5 1.0 * siLuc siNMLNoxa
0 0.5 1.5 2.0 2.5 1.0 *** 3.0 siLuc siNMLImmortalized MEFs
NML
Relative expression level (Fold) 0
0.2 0.6 0.8 1.0 0.4 *** WT KO NML