2008 年 4 月 3 日受理
メタン水蒸気改質における2種類の水素選択透過膜反応器
の実験的及び理論的比較
相原雅彦、竹内隆、羽深等
横浜国立大学大学院 工学研究院 機能の創生部門 過程の機能と安全分野 化学システム工学コース 〒240-8501 横浜市保土ヶ谷区常盤台 79-5Experimental and Theoretical Comparison of Two Types of Hydrogen-Permselective Membrane
Reactor for
Methane Steam Reforming
Masahiko Aihara, Takashi Takeuchi, Hitoshi Habuka
aDepartment of Chemical Engineering Science, Yokohama National University 79-5 Tokiwadai, Hodogaya-ku, Yokohama 240-8501, Japan
To compare the experimental data of the membrane reactors with results of simulation, two types of hydrogen-permselective membranes, ZrO2/SiO2 composite membrane and Pd membrane, were prepared and installed in a reactor for methane steam reforming, respectively. Hydrogen permeation mechanisms through ZrO2/SiO2 composite membrane indicated Knudsen diffusion and that through Pd membrane indicated solution diffusion transport. Comparison with the experimental and simulation data showed a good agreement. The results of numerical analysis based on the obtained exergy of product and the total exergy supplied in the reaction system showed that the exergy loss of hydrogen production using a hydrogen-permselective membrane reactor for methane steam reforming process at the lowest was 30-50% less than that of a conventional process.
Key words: steam reforming, hydrogen, membrane reactor, exergy analysis 1. Introduction
Methane steam reforming is one of the most important chemical processes in hydrogen production. Methane steam reforming involves five species in two reversible reaction.
CH4 + H2O = CO + 3H2 G298 = 206 kJ mol-1 (1) CO + H2O = CO2 + H2 G 298 = -41 kJ mol-1 (2) CH4 + 2H2O = CO2 + 4H2 G 298 = 165 kJ mol-1 (3) Reaction (1), reforming reaction, is thermodynamically favored by high temperature and low pressure. Reaction (2), water-gas shift, does not depend on pressure and is favored by low temperature. Reaction (3) is the overall reaction.
out in furnace containing hundreds of tubes packed with a catalyst. One possible way to liberate this reaction from the equilibrium limitation and thus attain a high methane conversion is by use of membrane reactor. By employing a hydrogen-permselective membrane, the hydrogen produced by methane steam reforming is removed from the reaction zone so that the chemical equilibrium shifts towards a higher reactant conversion. Based on this concept, hydrogen-permselective membrane reactors have been proposed and investigated for the methane steam reforming process.[1-5]
This paper describes the preparation of two types of hydrogen-permselective membrane and the experimental and numerical analysis of membrane reactor installed these membrane in. 2. Experimental
2.1 Membrane
Two kinds of hydrogen-permselective membrane were prepared and installed in a membrane reactor for methane steam reforming. The former is the ZrO2/SiO2 composite membrane expected to be high thermal stability. The later is the Pd membrane well-known for the the high hydrogen-permselectivity.
Via a metal-alkoxide method[4], a thin layer of the ZrO2/SiO2 composite membrane was coated on the surface of porous ceramic tubing, the dimensions of which were 10 mm in outer diameter, 7 mm in inner diameter, and the average pore diameter was 100 nm (supplied by NGK INSULATORS. LTD.) The composition of the coating solutions are listed on Table 1 and the procedure of preparing the composite membrane is outlined in Fig. 1(a).
The Pd membrane was coated on the surface of the same porous ceramic tubing by the electroless-plating method[5-7]. The base ceramic tubing was sensitized and activated by
pretreatment with aqueous solutions of stannous chloride and palladium chloride, respectively. The composition of the plating solutions are listed on Table 2 and the procedure of preparing the Pd membrane is outlined in Fig. 1(b).
Fig. 1. Preparation of separation membrane Table 1. Coating solution for Alkoxide method
Zr(OC
3H
7)
4Si(OC
2H
5)
4Y(CH
3COO)
3•4H
20
i-C
3H
7OH
22.4 ml
0.9 ml
1.0 g
84.8 ml
Table 2. Electroless-plating solution
Pd[(NH
3)
4]Cl
2EDTA•2Na
NH
3(28% solution)
H
2NNH
2H
2O
4.7 g
67.2 g
651.3 ml
0.35 ml
348.4 ml
Pd[(NH
3)
4]Cl
2EDTA•2Na
NH
3(28% solution)
H
2NNH
2H
2O
4.7 g
67.2 g
651.3 ml
0.35 ml
348.4 ml
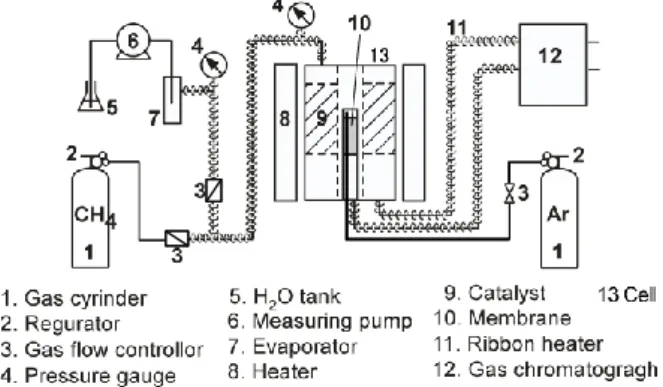
2.2 ApparatusA schematic flow diagram of the experimental apparatus is shown in Fig. 2. A schematic view of the reactor cell is shown in Fig. 3. For the measurement of membrane separation characteristic, no catalyst is packed in the reactor cell. For the investigation of reaction characteristic, Ru/Al2O3 catalyst pellets and alumina balls were packed in the annular region between two coaxial circular cylinders by the length of effective membrane. The inner cylinder which is perforated with circular holes of 2 mm, and of 22 % open area ratio, protects the active
surface of the membrane from the direct contact with catalyst pellets. The Ru-catalyst which is the alumina cylinder pellet containing 0.5% ruthenium (D: 3.2 mm, L: 3.4 mm, Pore Volume: 0.33-0.37 cm3/g, Superficial Density: 1.55 g/cm3; N. E. Chemcat, Co. Ltd.) is used for steam reforming reaction experiment. The catalyst concentration and the height of catalyst zone are adjusted using alumina balls (D: 3.2 mm, Superficial Density: 3.45 g/cm3). The flexible heaters were used to avoid the condensation of water contained in the reacted gas mixtures in the tubing of which temperature was kept above 423 K.
Fig. 2. Experimental apparatus
Fig. 3. Reactor Cell 2.3 Evaluation of membrane performance
Pure gas permeations of ZrO2/SiO2 composite membrane and Pd membrane were evaluated, respectively. Each feed pure gas of H2, CO2 and CH4 was introduced from each gas cylinder into the cell. In the case of measurement of water vapor permeation through the membrane, water was introduced by the measuring pump into the
evaporator where it was vaporized, and introduced into the cell. Ar gas was introduced onto the surface of the permeation side of membrane to purge the permeant. The pressure in the cell was controlled by the pressure-control valve. The water vapor permeation rate through the membrane was determined by the weight method, using cold trap cooled by liquid N2 and the other pure gas (H2, CO2, CH4) permeation rates were measured by soap-bubble flow meter. The permeation experiment was carried out at 523 K and at 0.15-0.35 MPa absolute on the feed side.
Separation performance of gas mixture was evaluated by the separation factor,
i/j, defined bythe following equation.
x j xi y j yi j / i
(4)
where xi (or xj) and yi (or yj) are the molar
fractions of the component i (or j) in the feed and permeated gas, respectively.
2.4 Reaction experiment
Reaction experiment was carried out with the conditions as follows: reaction temperature 623 – 973 K, molar ratio of H2O to CH4 1 : 3, gas feed rate 100 – 300 Nml/min, superficial space velocity 0.08 - 0.4 s-1, reaction pressure 0.2 MPa absolute. The permeation rate of the product gas was measured by the same method used for the gas permeation experiment. The compositions of the gas mixture of the feed and permeated gas were determined by the gas chromatography.
3. Experimental Results and Discussions
3.1 Performance of ZrO2/SiO2 composite membrane
pure gas permeation fluxes of H2, CO2, CH4 and H2O through the ZrO2/SiO2 composite membrane and trans-membrane pressure at 523 K. Fluxes through the membrane. Permeation fluxes for each gas increase linearly with the increase of the trans-membrane pressure. The permeances of each gas are defined by the each slope of the relationships in Fig. 4. The main permeation mechanism for all the gases tested except H2O was estimated as Knudsen diffusion, while that for H2O was estimated as surface diffusion[4]. The permeances of H2, CH4 and CO2 through this membrane were showed on Table 3. Figure 5 shows the relationship between separation factor of gaseous mixture of CH4-CO2 and trans-membrane pressure at 298 K. Applying the equation of Present-de Bethune[8] to this relationship, the average mean pore diameter of the membrane was estimated about 4nm.
Fig. 4. Relationship between flux and trans- membrane pressure
Fig. 5. Relationship between separation factor and trans-membrane pressure.
Table 3. Permeance through ZrO2/SiO2 membrane
H2 CH4 CO2 5.9 x 10⁻⁷ [mol/(m2 Pa s)] 2.1 x 10⁻⁷ [mol/(m2 Pa s)] 1.3 x 10⁻⁷ [mol/(m2 Pa s)] 3.2 Performance of Pd membrane
The theoretical permeation flux through Pd membrane JH2 [mol/(m2s)] was defined by the
following equation[9], ) . L . H ( (-E/RT) H
ke
P
-P
J
05 05 2(5) where PH and PL are pressures of the feed and permeation sides, respectively.
Figures 6 and 7 show the effects of pressure and temperature on the obtained permeation flux, respectively. Both linear relationships in these graphs indicated that the flux mechanism through this Pd membrane satisfied the equation (5). Flux [ mol /(m 2s) ] 0 0.1 0.2 0.3 0.4 0.5 0.6 0.7 0 50 100 150 200 250 300 P H 0.5 -P L 0.5 [Pa0.5] T=773[K] Flux [ mol /(m 2s) ] 0 0.1 0.2 0.3 0.4 0.5 0.6 0.7 0 50 100 150 200 250 300 P H 0.5 -P L 0.5 [Pa0.5] T=773[K] 0 0.1 0.2 0.3 0.4 0.5 0.6 0.7 0 50 100 150 200 250 300 P H 0.5 -P L 0.5 [Pa0.5] T=773[K]
Fig. 6. Relationship between flux of H2 through a palladium membrane and PH0.5-PL0.5. The permeances of H2 and He through this Pd membrane were showed on Table 4. These results showed the prepared Pd membrane is a high hydrogen-permselective dense membrane as the permeance of H2 was 65 times that of He.
0.1 0.2 0.3 0.4 0.5
Flux
[mo
l/(
m
2•s)]
0.0012 0.0016T
-1[K
-1]
0.1 0.2 0.3 0.4 0.5 0.1 0.2 0.3 0.4 0.5 0.1 0.2 0.3 0.4 0.5Flux
[mo
l/(
m
2•s)]
Flux
[mo
l/(
m
2•s)]
0.0012 0.0016T
-1[K
-1]
Fig. 7. Arrhenius plot between the hydrogen permeation flux and temperature Table 4. Permeance through Pd membrane
H
2He
3.06 x 10
-6[mol/(m
2Pa s)]
4.72 x 10
-8[mol/(m
2Pa s)]
3.3 Membrane reactor test
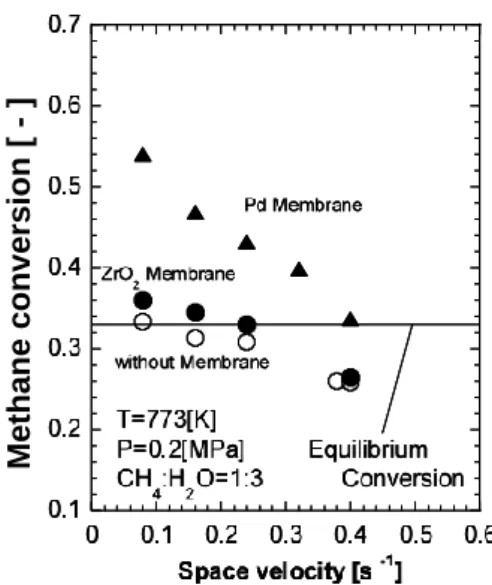
Figures 8 and 9 show the effect of space velocity and temperature on the methane conversion for three reactors, without membrane, with the ZrO2/SiO2 composite membrane, and with Pd membrane, respectively. Both figure solid lines are indicated the equilibrium conversion for each given condition, respectively.
In Fig. 8 the methane conversions for the reactors installed the hydrogen perm-selective membrane became greater than the equilibrium conversion in the case of the ZrO2/SiO2 composite membrane and the Pd membrane below the space velocity of 0.2 s-1 and 0.4 s-1, respectively, though that for the reactor without membrane could reach the ewuilibrium conversion below the space velocity of 0.08 s-1. In Fig. 9 the methane conversion for the both membrane reactors was shown to be greater than the equilibrium conversion in the all tested temperature range.
Me
tha
n
e c
o
n
ve
rs
ion
[
-]
Me
tha
n
e c
o
n
ve
rs
ion
[
-]
Fig. 8. Relationship between space velocity and conversion
Fig. 9. Relationship between temperature and conversion
4. Numerical Analysis 4.1 Reactor model
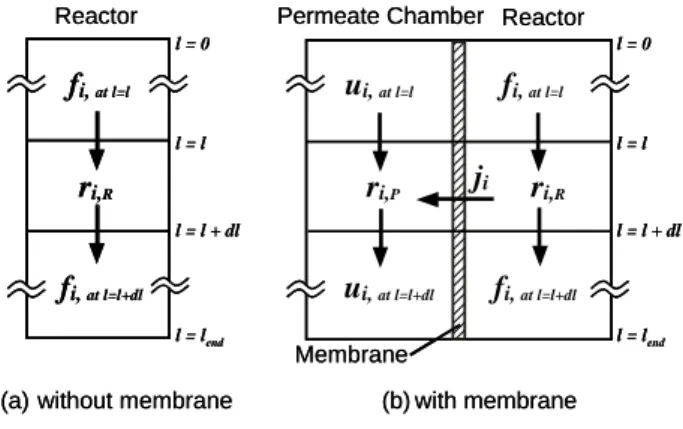
The schematic diagram of the systems with and without separation membrane are shown in Fig. 10 (a) and (b), respectively.
fi, at l=l
Reactor
(a) without membrane
Permeate Chamber Reactor
ji Membrane (b) with membrane l = l fi, at l=l+dl ri,R fi, at l=l fi, at l=l+dl ri,R ri,P ui, at l=l ui, at l=l+dl l = l + dl l = 0 l = lend l = l l = l + dl l = 0 l = lend fi, at l=l Reactor
(a) without membrane
Permeate Chamber Reactor
ji Membrane (b) with membrane l = l fi, at l=l+dl ri,R fi, at l=l fi, at l=l+dl ri,R ri,P ui, at l=l ui, at l=l+dl l = l + dl l = 0 l = lend l = l l = l + dl l = 0 l = lend
Fig. 10. Schematic diagram of Reactor for numerical analysis
The plug flow in the reactor and permeate chamber, uniform temperature in the each chamber and no concentration gradient in the vertical direction to the flow are assumed. Material balances of each gaseous component across a longitudinal length, dl of the reactor yields the following ordinary differential equations. More detail derivation of the equations and the numerical integration method were described in the previous papers [10-12].
(Conventional Reactor)
4 CH Ri
r
s
dl
R
s
i
f
d
(6) (Membrane Reactor)(In the main chamber (reactor))
ij
h
s
r
i
s
dl
s
i
f
d
R R , CH R R 4
(7)(In the permeate chamber)
ij
h s r i s dl s i u d R P , CH p P 4 (8)where fi [mol/s] (or ui [mol/s]), i [ - ], and ji
[mol/(m2s)]are the flow rate, the stoichiometric coefficient, the permeation flux of component i, respectively, sR [m2],sP [m2], and h [m]are the cross-sectional areas of reactor and permeate chamber and the volume ratio of reactor volume
to membrane area, respectively, and rCH4,R
[mol/(m3 s)] and rCH4,P [mol/(m3 s)]are the reaction rates of methane in reactor and permeate chamber, respectively[13].
Figures 11 and 12 show the results of the simulation[6] using the numerical analysis. Figures 11 and 12 correspond to Figs 8 and 9, respectively. As the calculated results agreed with the experimental data, the numerical analysis was thought to be adequate at the given conditions.
The mole fraction profile in the reactor at 773 K and 0.08
s
-1 of the space velocity is shown in Fig.13. The drastic change at 0.05 m of reactor length indicates the position of separation membrane.
Methane conve rsion [ -] Methane conve rsion [ -]
Fig. 11. Relationship between space velocity and conversion Me th a n e c o n v e rs io n [ -] 0 0.2 0.4 0.6 0.8 1 600 650 700 750 800 850 900 950 without membrane (exp.)
Zr membrane (exp.) Pd membrane (exp.) (calculated) (calculated) (calculated) T [ K ] Equilibrium Conversion P=0.2[MPa] Sv=0.08[1/s] CH4:H2O=1:3 Me th a n e c o n v e rs io n [ -] 0 0.2 0 0.2 0.4 0.6 0.8 1 600 650 700 750 800 850 900 950 without membrane (exp.)
Zr membrane (exp.) Pd membrane (exp.) (calculated) (calculated) (calculated) T [ K ] Equilibrium Conversion P=0.2[MPa] Sv=0.08[1/s] CH4:H2O=1:3
Fig. 12. Relationship between temperature and conversion
Mole
frac
ti
on
[
-]
Mole
frac
ti
on
[
-]
Fig. 13. Mole fraction profile in reactor 4.2 Exergy analysis
To consider hydrogen as the secondary energy, the required energy to obtain hydrogen needs to be evaluated on a reasonable basis. In this study the evaluation method was proposed to compare quantitatively between the obtained exergy of product and the total exergy supplied in the reaction system.
The exergy of mixture is the sum of the following exergies, the sum of the chemical exergy
E0, the sum of the exergy due to temperature
change ET, the exergy due to compression EP, the
sum of the exergy due to mixing EM. Each exergy
is defined by the following equations[14],
M P T E E E E E 0 (10) 0 0 niei E (11)
TT dT T T ETn
iC
P,i 0 0 1 (12) P P P dP P P NRT P E 0 2 0 1 0 (13) NRT xi ln(xi ) M E 0 (14),where ni [kmol], e0i [kJ/kmol], xi [-] and Cp,i [kJ/(kmolK)] are number of moles, standard chemical exergy, mole fraction and heat capacity at constant pressure of component i, respectively, and N [kmol] and R [kJ/(kmol K)] are total number of moles and gas constant, respectively.
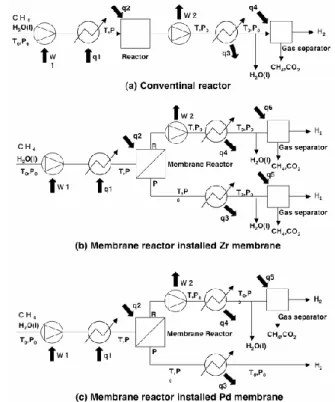
The exergy of each system was calculated by using these equations on the base of flow schemes[14-16] in Fig.14. On the supposition of ideal heat input and output, the exergy loss of each system was evaluated by converting to the basis per one mole product hydrogen.
Fig. 14. Process flow diagram for exergy analysis
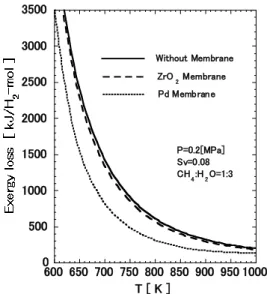
The relationship between temperature and the exergy loss per mol hydrogen production is shown in Fig. 15. The exergy loss decreases rapidly with a temperature rise in the lower range, while the decreasing becomes gentle in the higher range. Compare with the exergy loss for the conventional reactor without membrane, that for the membrane reactor installed the ZrO2/SiO2 composite membrane and the Pd membrane in was saved 5 – 10 % and 30 – 50%, respectively.
0 500 1000 1500 2000 2500 3000 3500 600 650 700 750 800 850 900 950 1000 T [ K ] Without Membrane Pd Membrane ZrO2 Membrane P=0.2[MPa] Sv=0.08 CH4:H2O=1:3
Fig. 15. Relationship between temperature and exergy loss based on the value at 773K without membrane
5. Conclusions
(1) Two types of hydrogen-permselective membranes, ZrO2/SiO2 composite membrane
and Pd membrane with high
hydrogen-selectivity could be formed on a porous ceramic tube.
(2) The membrane reactors installed hydrogen-permselective membrane in were constructed, methane steam reforming reaction was carried out using the membrane reactors, and higher conversion of methane for membrane reactor than that for the conventional reactor was obtained.
(3) Theoretical equations for membrane reactor were applied to analyze the experimental data of methane conversion.
(4) Effectiveness of membrane reactor was showed by the numerical analysis in exergy saving.
References
1. Itoh, N., AIChE Journal vol.33, p1576-1578(1987)
2. Uemiya, S., Sato, N., Ando, H., Matsuda, T., Kikuchi, E., Applied Catalysis, Vol.67, p223-230(1990)
3. Uemiya, S., Sato, N., Ando, H., Kikuchi, E., Ind. Eng. Chem. Res., vol.30 p585-589(1991)
4. Ohya, H., Nakajima, H., Togami, N., Aihara, M., Negishi, Y., J. Membrane Sci., vol.97, p91-98(1994)
5. Shu, J., Grandjean, B. P. A., Ghali, E., Kaliaguine, S., J. Membrane Sci., vol.77, p181-195(1993) 6. Uemiya, S., Matsuda, T., Kikuchi, E., J.
Membrane Sci., vol.56,p.315-325(1991)
7. Uemiya, S., Matsuda, T. Kikuchi, E., Nippon Kagaku Kaishi (6), p669-675(1990)
8. Present, R. D., Debethune, A. J., Phys. Rev., vol.75, p1050(1991)
9. Yan, S., Maeda, H., Kusakabe, K., Morooka, S., Ind. Eng. Chem. Res., vol.33, p.616-622(1994) 10. Ohashi, H., Ohya, H., Aihara, M., Negishi, Y.,
Semenova., S. I., J. Membrane Sci., vol.146, p39-52(1998)
11. Fan, J., Ohya, H., Ohashi, H., Aihara, M., Takeuchi, T., Negishi., Y., Semenova, S. I., J. Membrane Sci., vol.162, p125-134(1999)
12. Ohashi, H., Ohya, H., Aihara, M., Takeuchi, T., Negishi., Y., Fan, J., Semenova, S. I., J. Membrane Sci., vol.166, p239-247(2000)
13. Lunde, P. J., Kester, F. L., J. Catalysis, vol.30, p423-429(1973)
14. Yoshida, K., “Ekuserugi Kogaku,” Kyoritsu Shuppan, p154(1999).
15. Hinderink, A. P., Kerkhof, F. P. J. M., Lie, A. B. K., Arons J. D. S., Kooi, H. J. V. D., Chem. Eng. Sci., vol.51(20), p4693-4700 (1996)
16. Inagaki, Y., Haga, K., Aita, H., Sekita, K., Koiso, H., Hino, R., Nihon Genshiryoku Gakkaishi, vol.40(1), p59-64(1998)
![Table 2. Electroless-plating solution Pd[(NH 3 ) 4 ]Cl 2 EDTA•2Na NH 3 (28% solution) H 2 NNH 2 H 2 O 4.7 g 67.2 g 651.3 ml 0.35 ml 348.4 ml Pd[(NH3)4]Cl2EDTA•2Na NH3 (28% solution) H2NNH2H2O 4.7 g 67.2 g 651.3 ml 0.35 ml 348.4 ml 2.2 Apparatus](https://thumb-ap.123doks.com/thumbv2/123deta/8298976.1775303/2.892.494.772.691.792/table-electroless-plating-solution-edta-solution-solution-apparatus.webp)
![Table 3. Permeance through ZrO 2 /SiO 2 membrane H 2 CH 4 CO 2 5.9 x 10 -7 [mol/(m 2 Pa s)] 2.1 x 10⁻⁷ [mol/(m2 Pa s)] 1.3 x 10⁻⁷ [mol/(m2 Pa s)] 3.2 Performance of Pd membrane](https://thumb-ap.123doks.com/thumbv2/123deta/8298976.1775303/4.892.156.372.889.1090/table-permeance-zro-sio-membrane-ch-performance-membrane.webp)