publication title
number
18
page range
1-28
year
2018-03
1. Introduction
Various studies suggest that financial accounting information has become less value-relevant over time (Francis and Schipper, 1999; Lev and Zarowin, 1999) because of changing business models that shift firm value drivers from tangibles to intangibles, increase redundant information, and decrease the interpretability of traditional financial statements. Over the last several decades, significant efforts have been made to complement financial reporting (Gray, 2010). One such effort involves social and environmental accounting. Since the 1980s, more firms have voluntarily published their environmental reports and, recently, firms have started to publish corporate social responsibility (CSR) and sustainability reports. These reports are now a standard global business practice.
Cultural Influence on Corporate Social Responsibility Disclosure in East Asia
Chika SAKA*, Akihiro NODA**, Masayuki JIMICHI*
Abstract
This study investigates (1) whether there is a difference in firm CSR (Corporate Social Responsibility) disclosure practices among China, Japan, and Korea; (2) whether and which cultural factors affect CSR disclosure; and (3) whether the influence differs among CSR items. First, a content analysis of the CSR reports is conducted based on the framework of ISO 26000. Based on the analysis, we investigate cultural influence on CSR disclosures and the degree of influence among CSR items. This study provides evidence that, first, there are differences in CSR disclosure practices among the three countries. Second, cultural influence is reflected by CSR disclosures that are positively related to individualism, uncertainty avoidance, and masculine cultures, and negatively related to power distance. Third, cultural influence differs among CSR items. This study sheds light on the importance of cultural influence on CSR disclosure and the associated differences among CSR items, which imply that, even when global guidelines are introduced, firms might disclose differently depending on their culture. When regulators design institutional arrangements to promote CSR disclosures, they should consider the influence of domestic cultures and commit to improving disclosures of specific CSR areas where firms disclose less. Users should be careful to conduct cross-national comparisons of CSR disclosure.
Keywords: Corporate Social Responsibility; Disclosure; Culture; ISO 26000; East Asia
* Professor, School of Business Administration, Kwansei Gakuin University ** Professor, Faculty of Economics, Shiga University
In descending order, China, Japan, and South Korea (hereafter, Korea) are the leading Asian countries in gross national product and CSR disclosures. China, Japan, and Korea have common roots based on Confucianism, and this cultural inheritance provides a competitive advantage for successful business activity (Hofstede and Bond, 1988). In addition, these three countries share similar regulatory backgrounds for CSR disclosures (Wong, 2009). However, there are significant differences in the countries’ CSR disclosure practices.
Accounting practices, including disclosures, are increasingly considered societal practices rather than purely financial reporting (Burchell et al., 1985). A country’s accounting standards and practices are the result of a complex interaction among cultural, historical, economic, and institutional factors (Gordon et al., 2013). Hofstede’s (1980) analysis of culture and Gray’s (1988) theory of the influence of culture on accounting are extensively applied in cross-cultural accounting studies to explain the differences across countries (e.g., Chand et al., 2012). Compared to financial reporting, CSR disclosure is influenced by stakeholders’ information needs that are based on their respective national cultural background. O’Riordan and Fairbrass (2008) suggest that Hofstede’s (1980) work on culture is relevant to CSR practices.
Although Orij (2010) shows that CSR disclosure levels relate to national cultures, the author uses a secondary data source (the Siri database) for CSR disclosure. In addition, in an analysis of CSR disclosure, other conditions should be as equal as possible. Therefore, this study focuses on China, Japan, and Korea, where historical roots and the institutional background of CSR disclosures are similar, and uses primary data sources such as firm CSR or sustainability reports published in their local languages (in Chinese, Japanese, and Korean) for content analysis. This study addresses three key questions: (1) Is there a difference in firm CSR disclosure practices among Chinese, Japanese, and Korean firms, where the historical backgrounds and institutional environments for CSR disclosure are relatively similar? (2) Do cultural factors affect CSR disclosure, and what are the factors? (3) Does the influence differ among CSR items? First, a content analysis is conducted of the CSR reports of Chinese, Japanese, and Korean firms in their local languages based on the
framework of the International Organization for Standardization (ISO) 26000―Social
Responsibility. Based on this analysis, we investigate whether and how national cultures influence CSR disclosures and the degree of the influence among CSR items using the theories of Hofstede (1980) and Gray (1988).
The results reveal three key findings. First, we confirm evidence that there are differences in firm CSR disclosure practices among countries with relatively similar historical backgrounds and institutional CSR disclosure environments. Second, we provide evidence that the differences in CSR disclosures are partially attributable to domestic culture, in that
they are positively related to individualism, uncertainty avoidance, and masculine cultures, and negatively related to power distance. These findings are consistent with Gray’s (1988) hypothesis. Third, this study is the first to show evidence that cultural influence on CSR disclosure differs among the core items of ISO 26000.
Our study contributes to the literature on CSR disclosures in the following ways. First, we show evidence that domestic culture influences firms’ CSR disclosures in a rigorous setting among countries where historical backgrounds and institutional environments are similar. Second, our analysis uses primary CSR disclosure sources, such as firm reports published in their local language (Chinese, Japanese, and Korean), where previous research uses secondary data sources such as Siri (Orij, 2010).
The results imply that both regulators and users must acknowledge cultural bias in firm CSR disclosures. When regulators design institutional arrangements to promote firm CSR disclosures, they should consider the influence of domestic culture. Additionally, despite the excellent global CSR and sustainability disclosure guidelines, firms disclose differently depending on their local culture. Country regulators should commit to improving disclosure of specific CSR areas where firms are less likely to disclose. In addition, users of CSR disclosure should compare the disclosed information cross-nationally and provide feedback to firms to encourage and improve disclosure. Strategies to adjust to country cultural profiles are required for both regulators and users.
The remainder of this paper is organized as follows. Section 2 reviews the institutional background of CSR disclosures and the related research. Section 3 describes the research design and hypotheses. Section 4 presents the sample, key findings, and supplementary analysis. Section 5 presents the conclusions.
2. Background and Previous Research
2.1 Institutional Background of CSR Disclosures
China, Japan, and Korea have common roots based on Confucianism, influenced by Chinese civilization. Confucian ethics emanate an emphasis on social obligations, ethical decision-making, positive business dealings and harmonious relationships within organizations, and the value of learning and education; these bring attendant benefits and good practices, including good business management and labor practices, as well as CSR (Law and Ang, 2013). It is well known that these three countries are the leading Asian countries in CSR disclosures.
In addition, China, Japan, and Korea have similar frameworks for CSR disclosures (Wong, 2009). In China, the Shanghai Stock Exchange and the Shenzhen Stock Exchange issued a notice and guidelines, respectively, in 2006, suggesting that listed firms disclose CSR information. In 2008, the Chinese Stock Regulatory Commission made the CSR report
a formal requirement for three types of listed firms on the Shanghai Stock Exchange―firms in the financial services industry, firms in the corporate governance composite index group, and firms listed on foreign exchange markets. The number of Chinese firms that publish CSR reports has grown rapidly over the last several years (Zhao, 2012; Yao et al., 2013).
In Japan, the Ministry of the Environment issued Environmental Reporting Guidelines in 2001, which were subsequently revised in 2003, 2007, and 2012. In 2005, the Law Concerning the Promotion of Business Activities with Environmental Consideration by Specified Corporations, etc., by Facilitating Access to Environmental Information, and Other Measures was enacted requiring designated highly public organizations, including national universities, the Japan Broadcasting Corporation, and Nippon Telegraph and Telephone Corporation, to publish environmental reports. These guidelines and law facilitate firm environmental and CSR disclosures and improve their quantity and the quality.
Korea has enacted guidelines similar to those issued by the Japanese Ministry of the Environment. The Korean Ministry of Environment issued the Environmental Reporting Guideline in 2000, and this was revised in 2002. Additionally, the Korean Ministry of Environment launched the Corporate Environmental Information Disclosure Scheme in Korea in 2010. The Korea Chamber of Commerce and Industry issued Sustainability Management Report Indicators. Korean CSR practices resemble those of Japan (Lee, 2012).
Overall, the regulatory backgrounds of CSR disclosures of these three countries are similar, and are based on domestic guidelines and voluntary submission, with the exception of certain designated firms.
2.2 The Influence of National Culture on Accounting
In contrast to single-country studies, there are unique challenges in designing and completing cross-country accounting studies. A country’s accounting standards and practices are the result of complex interactions among cultural, historical, economic, and institutional factors (Gordon et al., 2013), and the application of judgment in accounting is a function of various factors, including individual cultural values (e.g., Chand et al., 2012). Culture can determine specific characteristics of a group and can explain contrasting business behaviors in different locations (Kim and Choi, 2013). Existing studies explore the relationship between culture and accounting practices, a controversial area of international accounting research (e.g., Gray, 1988; Smith, 2002; Noravesh et al., 2007; Finch, 2009; Han et al., 2010; Kanagaretnam et al., 2011; Rapp et al., 2011; Borker, 2012a, 2012b; Chand et al., 2012; Holmen, 2014).
CSR is also the consequence of the institutional and cultural environment (Welford, 2005; Tang and Li, 2009; Kim and Kim, 2010), therefore, countries exhibit differences in both CSR practices and disclosure (Chen and Bouvain, 2009). Since mandatory disclosures
do not necessarily include all information demanded by stakeholders, firms voluntarily disclose information, including CSR disclosure, to increase corporate transparency and reduce information asymmetry (Healy and Palepu, 2001). The variations in voluntary disclosures are more related to cultural differences among nations (Kumar, 2013; Holmen, 2014) than mandatory disclosures. Orij (2010) finds that CSR disclosure levels are likely to be influenced by national cultures, and Asian countries’ CSR disclosures especially vary considerably among countries (Chapple and Moon, 2005).
Cultural inheritance is not genetically transferred, and cultural values are generally static over time (Hofstede and Bond, 1988; Chand et al., 2012). Since Hofstede’s culture types have been widely used in empirical research (Sondergaard, 1994; Rapp et al., 2011), this study also uses Hofstede (1980) indices. In addition, accepting critiques (Fujita, 2002; McSweeney, 2002) of Hofstede (1980), the authors use alternative indicators instead of Hofstede’s in the second additional analysis to confirm the cultural influence on CSR disclosure.
Furthermore, Gray (1988) also suggests that the prevailing accounting values in a country are influenced not only by national cultural values but also by other institutional consequences. Given the complexity of the relationships between culture and other factors, an analysis of cultural influence on CSR disclosure requires that, to the extent possible, other conditions are equal. Therefore, this study focuses on China, Japan, and Korea, where historical roots, economies, and the institutional background of CSR disclosure are relatively similar. In addition, we consider stakeholder effects on CSR disclosure, as described in the next section.
2.3 Determinants of CSR Disclosures
Several prior studies address CSR disclosure practices in China, Japan, and Korea. Studies on CSR disclosures by Chinese firms reveal that disclosures are positively related to firm profitability, firm size, media exposure, ownership concentration, institutional shareholding, and sensitivity towards the environment (Liu and Anbumozhi, 2009; Yao et al., 2013; Lu and Abeysekera, 2014). In Japan, CSR performance, financial performance, size, and industry type are positively related to CSR disclosures (Saka and Noda, 2013). Korean studies show that large companies are more likely to disclose CSR activity (Lee, 2012).
There is growing research on the determinants of CSR disclosures other than cultural factors. Based on stakeholder theory, a firm’s success is dependent upon the successful management of all relationships a firm has with its stakeholders (Ten, 2007; Elijido-Ten et al., 2010). Since firms should consider the concerns of a wide range of stakeholders and incorporate their needs into the disclosure process, voluntary CSR disclosure requires
greater judgment by firms than regulatory financial reporting, and is affected by the firm’s shareholder structure and power (e.g., Roberts, 1992; Huang and Kung, 2010). For example, large or profitable firms tend to engage in CSR disclosure, taking into consideration the effects of government (e.g., Cox and Douthett, 2009; Gamerschlag et al., 2011; Saka and Noda, 2013) because very large or highly profitable firms tend to attract political attention, which incurs political cost (Watts and Zimmerman, 1986). Creditors affect a firm’s CSR disclosure through their governance (e.g., Saka and Noda, 2013). Non-government organizations (NGOs) also affect CSR disclosure; to avoid negative campaigns by environmental conservation groups, the number of firms that engage in CSR activities with the cooperation of NGOs is rising (Van der Laan et al., 2008), and high-profile environmental industries tend to be more affected.
Based on these previous research results, this study addresses three key questions: (1) Is there a difference in CSR disclosure practices of firms in China, Japan, and Korea, where the historical backgrounds and institutional environments for CSR disclosure are relatively similar? (2) Do cultural factors affect CSR disclosure, and what are the factors? (3) Does the influence differ among CSR items? Significant knowledge concerning the influence of culture on disclosure is required for a clear understanding of the differences in CSR disclosure across countries, and to move toward global improvement of CSR disclosure.
3. Research Design
3.1 CSR Disclosures and Culture Indices
China, Japan, and Korea were selected for this study to eliminate factors other than cultural differences, such as institutional, economic, and historical differences, based on the following characteristics. First, China, Japan, and Korea have common historical roots and background, and the Confucian ethical structure continues to influence business perspectives in these countries (Jacobs et al., 1995; Hofstede and Bond, 1988; Boardman and Kato, 2003; Park et al., 2005). Second, in descending order of gross national product, China, Japan, and Korea represent the top three Asian countries; thus, their economic development and level of globalization are more similar than those of other Asian countries. Third, the regulatory background of CSR disclosure in these three countries is similar, and disclosure is mainly on a voluntary basis. Despite these similarities, there are actual differences in CSR disclosure in China, Japan, and Korea, which are presented in Table 1 later in the paper.
In addition, most of the previous research uses a secondary data source (e.g., the Siri database) for CSR disclosure, which might induce a data processing bias. Therefore, this
study goes directly to primary data sources―firm CSR or sustainability reports published in
local languages (in Chinese, Japanese, and Korean)―to analyze the content. Using the
Hofstede’s (1980) indices and Gray’s (1988) theory. Two additional analyses are conducted: (1) an analysis examining cultural influence on each subject of CSR disclosure, and (2) an analysis using alternative indices to Hofstede’s to confirm the cultural influence on CSR disclosure.
First, this study investigates whether the contents of CSR disclosures differ across these three countries. The research target is CSR or sustainability reports published by all listed Chinese, Japanese, and Korean firms in their local language. We collected all available CSR reports from all listed firms of the Shanghai Stock Exchange, the Tokyo Stock Exchange, and the Korea Stock Exchange as of July 2013. CSR reports were collected for 279 Chinese firms, 345 Japanese firms, and 48 Korean firms (see Section 4.1 for the sample selection method). We analyzed and quantified the CSR reports by reading each firm’s entire report in their local language (Chinese, Japanese, and Korean), and scored them using the ISO 26000 framework. Previous studies relied on simple measures, such as word and page counts, to compare the extent of CSR disclosure; however, such a method may not capture significant differences in the content of these reports (Chen and Bouvain, 2009). Several existing studies quantify firm-level CSR disclosures based on GRI (Global Reporting Initiatives) Sustainability Reporting Guidelines (Clarkson et al., 2008), and Wiseman’s classification (Huang and Kung, 2010). However, ISO 26000 is the framework for our analysis for two reasons. At the time the disclosures used in this study were prepared, some firms were using the GRI guidelines (G4) issued in 2013, but most firms were using the older version of those guidelines (G3), so they may not have been consistently prepared, or were prepared with out-of-date guidelines. Wiseman’s classification focuses only on environmental issues, which is insufficient for our analysis.
ISO 26000 was developed through a multi-stakeholder process, including 99 countries and 42 organizations from industries, NGOs, and intergovernmental organizations. The CSR requirements under ISO 26000 reflect the demands of the various stakeholders. ISO 26000 comprises seven core subjects that organizations must consider as part of their social
responsibility commitments―organizational governance, human rights, labor practices,
environment, fair operating practices, consumer issues, and community involvement and development. These seven core subjects are further composed of 37 issues. To calculate our CSR disclosure score, we scored each of the 37 issues for each firm’s disclosure as follows. Based on the content analysis, we recorded a value of two if the firm disclosed quantitative information, one if the firm disclosed qualitative information, and zero if it did not disclose any information. Thus, the value of the CSR disclosure score, CSR, ranges from zero to 74.
Table 1 presents the CSR disclosure average score ratio for the Chinese, Japanese, and Korean firms for each of the 37 issues of ISO 26000. The overall CSR disclosure ratio is highest for Korean firms at 45%, followed by Japanese firms at 38%, and Chinese firms at
Table 1. Chinese, Japanese, and Korean firms’ CSR disclosure score ratio by ISO26000, 37 issues*
Items Core subjects and issues ISO section Chinese firms CSR disclosure ratio (%) 279 firms Japanese firms CSR disclosure ratio (%) 345 firms Korean firms CSR disclosure ratio (%) 48 firms 1 Organizational Governance 6.2 47% 37% 60% Human rights 6.3 16% 34% 40% 2 Due diligence 6.3.3 13% 33% 31%
3 Human rights risk situations 6.3.4 3% 23% 36%
4 Avoidance of complicity 6.3.5 1% 19% 9%
5 Resolving grievances 6.3.6 4% 34% 45%
6 Discrimination and vulnerable groups 6.3.7 13% 58% 47%
7 Civil and political rights 6.3.8 23% 34% 39%
8 Economic, social and cultural rights 6.3.9 52% 34% 68% 9 Fundamental rights at work 6.3.10 16% 40% 47%
Labor practices 6.4 36% 47% 56%
10 Employment and employment relationships 6.4.3 24% 41% 56% 11 Conditions of work and social protection 6.4.4 25% 57% 43%
12 Social dialogue 6.4.5 7% 23% 28%
13 Health and safety at work 6.4.6 50% 63% 68%
14 Human development and training in the workplace 6.4.7 76% 49% 84%
Environment 6.5 31% 84% 60%
15 Prevention of pollution 6.5.3 39% 93% 66%
16 Sustainable resource use 6.5.4 49% 92% 69%
17 Climate change mitigation and adaptation 6.5.5 27% 97% 81% 18 Protection and restoration of the natural environment 6.5.6 10% 53% 24%
Fair operating practices 6.6 13% 24% 36%
19 Anti−corruption 6.6.3 21% 35% 49%
20 Responsible political involvement 6.6.4 2% 10% 3%
21 Fair competition 6.6.5 20% 34% 51%
22 Promoting social responsibility in the sphere of influence 6.6.6 17% 32% 51%
23 Respect for property rights 6.6.7 6% 12% 23%
Consumer issues 6.7 14% 33% 38%
24 Fair marketing, factual and unbiased information and fair contractual practices 6.7.3 10% 31% 32% 25 Protecting consumers’ health and safety 6.7.4 25% 43% 39%
26 Sustainable consumption 6.7.5 16% 40% 55%
27 Consumer service, support, and dispute resolution 6.7.6 28% 46% 49% 28 Consumer data protection and privacy 6.7.7 6% 29% 46% 29 Access to essential services 6.7.8 6% 12% 15%
30 Education and awareness 6.7.9 11% 28% 30%
Community involvement and development 6.8 33% 26% 45%
31 Community involvement 6.8.3 36% 47% 63%
32 Education and culture 6.8.4 27% 41% 44%
33 Employment creation and skills development 6.8.5 25% 19% 52% 34 Technology development and access 6.8.6 13% 16% 14%
35 Wealth and income creation 6.8.7 69% 10% 45%
36 Health 6.8.8 11% 29% 22%
37 Social investment 6.8.9 47% 23% 73%
Total 24% 38% 45%
* The ratio of average score to maximum score on CSR information disclosure of 37 issues (the disclosure score takes on the value 2 if firms disclose quantitative information, 1 if firms disclose qualitative information, and 0 if there is no information.)
24%. However, the number of firms that publish CSR reports is the smallest for Korean firms. Moreover, of the 48 Korean firms, 21 firms belong to the big four chaebol group (Samsung, Hyundai, LG, and SK); thus, the big four chaebol group firms’ disclosure trend influences the Korean results.
The issues for which firms make maximum disclosures have some differences across countries. Except for organizational governance, which is comprised of only one item, the highest and second-highest disclosure ratios for Chinese firms are Labor practices (36%) and Community involvement and development (33%). The highest and second-highest disclosure ratios for Japanese firms are Environment (84%) and Labor practices (47%), while the highest and second-highest disclosure ratios for Korean firms are Environment (60%) and Labor practices (56%). Firms in all three countries disclosed Fair operating practices the least. In addition, the disclosure ratios for Human rights (16%) and Consumer
issues(14%) in China were much lower than the ratios for Japan and Korea.
Table 2 presents the analysis of variance (ANOVA) tables of CSR disclosure scores. The test of mean differences of total scores for the three countries is significant, and the tests of mean differences of each core subject are significant, which implies that CSR disclosures among China, Japan, and Korea are significantly different. This study investigated whether and which culture factors explain the differences in CSR disclosure.
Hofstede’s Culture’s Consequences (1980) identified four dimensions of culture, as a result of his extensive research (conducted in 1967-69 and 1971-73) through an international comparison of corporate culture, using data from 117,000 IBM workers across 66 countries. Although Hofstede (1980) is critiqued because it did not explicitly present the exact computation formula (Fujita, 2002; McSweeney, 2002), Hofstede’s analysis of culture (1980) and Gray’s theory on the influence of culture on accounting (1988) have been used extensively in cross-cultural studies in accounting to explain differences in judgments across countries (e.g., Smith, 2002; Noravesh et al., 2007; Tsakumis, 2007; Finch, 2009; Han et al., 2010; Kanagaretnam et al., 2011; Borker, 2012a, 2012b; Chand et al., 2012; Holmen, 2014). Beyond citation, Hofstede’s culture types have been widely used in empirical research, resulting in confirmation of his results and validation of the dimensions (Sondergaard, 1994; Rapp et al., 2011). In addition, cultural inheritance is not genetically transferred, and cultural values are generally static over time (Hofstede and Bond, 1988; Chand et al., 2012). Therefore, Hofstede (1980) indices are used in this study. In addition, accepting the critiques of Hofstede (1980), alternative indicators are used in the second additional analysis to confirm the cultural influence on CSR disclosure.
Hofstede (1980) presents indices for China, Japan, and Korea along the four dimensions of individualism, power distance, uncertainty avoidance, and masculinity. The overall values of the individualism indices range from 3 to 91 and from low to high; these values are 20
for China, 46 for Japan, and 18 for Korea. The overall values of the power distance indices range from 11 to 104 and from low to high; the indices’ values are 80 for China, 54 for Japan, and 60 for Korea. The overall values of the uncertainty avoidance indices range from 6 to 112 and from low to high; the indices’ values are 30 for China, 92 for Japan, and 85 for Korea. Finally, the overall values of the masculinity indices range from 5 to 95 and from low to high; the indices’ values are 66 for China, 95 for Japan, and 39 for Korea. Among
Table 2. Analysis of variance (ANOVA) tables of CSR disclosure scores among China, Japan, and Korea
Df Sum Sq Mean Sq F value Pr(>F)
CSR country Residuals 6662 21067.0856697.06 10533.5485.13 123.73 0.0000 ORGAN country Residuals 6662 140.6313.45 6.720.21 31.84 0.0000 HUMAN country Residuals 6662 1539.235997.77 769.619.01 85.46 0.0000 LABOR country Residuals 6662 2673.99219.55 109.784.02 27.34 0.0000 ENVIR country Residuals 6662 2542.221624.21 1271.112.44 521.21 0.0000 FAIR country Residuals 6662 1385.01300.35 150.172.08 72.21 0.0000 CONSU country Residuals 6662 1158.682845.74 579.344.27 135.59 0.0000 COMMU country Residuals 6662 3550.31337.22 168.615.33 31.63 0.0000
CSR = Total CSR disclosure score for 37 items, ORGAN = Organizational governance disclosure score for 1 item, HUMAN = Human rights disclosure score for 8 items, LABOR = Labor practices disclosure score for 5 items, ENVIR = Environment disclosure score for 4 items, FAIR = Fair operating practices disclosure score for 5 items, CONSU = Consumer issues disclosure score for 7 items, COMMU = Community involvement and development disclosure score for 7 items.
the three countries, China scores highest for the power distance aspect and lowest for the
uncertainty avoidance aspect; Japan scores highest for the individualism, uncertainty
avoidance, and masculinity aspects, whereas Korea scores lowest for the individualism and
masculinity aspects. Based on these measures, hypotheses are developed in the following
section.
3.2 Hypotheses Development
Based on the data collected by Hofstede (1980), Gray (1988) suggests a hypothetical set of relationships using Hofstede’s dimensions and his own culturally derived accounting value dimensions. Gray’s (1988) application of Hofstede’s cultural dimensions (Hofstede, 1980, 1983, 2001; Hofstede and Bond, 1988) has led to numerous related studies (e.g., Smith, 2002; Chanchani and Willett, 2004; Noravesh et al., 2007; Finch, 2009; Borker, 2012b; Kumar, 2013). Gray’s (1988) set of accounting values are related to Hofstede’s (1980) dimensions and are based on the argument that culture influences accounting practices (Borker, 2012a). Hofstede (1980) identified the following four factors as cultural dimensions:
(1) Individualism
Individualism indicates a preference for a loosely knit societal framework where individuals and their immediate family are independent. In contrast, collectivism indicates a preference for a tightly knit societal framework where individuals can expect their relatives, clan, or any other close group to care for them in exchange for unquestioning loyalty (Hofstede, 1980, 1983). Gray (1988) hypothesized that the lower a country ranks in terms of individualism, the higher it will rank in terms of secrecy. Noravesh et al. (2007) support this hypothesis. Kumar (2013) documents that firms from individualistic countries provide more voluntary disclosures than those from collectivist countries. In a collectivist society, firms give their information directly to the stakeholder, and tend to restrict the disclosure of information to outsiders. Societies characterized by high levels of individualism have a higher tolerance for unilateral decision-making and individual initiatives, which are also pursued to distinguish oneself from others, which results in high corporate CSR capability (Matthiesen and Salzmann, 2016). Previous research also shows that individualistic societies are more likely to punish unethical business practices (Williams and Zinkin, 2008). A higher demand for CSR results in firms responding to stakeholders’ expectations; therefore, we expect a positive relationship between individualism and CSR. Ioannou and Serafeim (2012) find a positive relationship between Hofstede’s individualism dimension and CSR. Adnan et al. (2014) indicate that CSR reporting is prominent in countries that have individualistic societies. Therefore, firms in an individualistic society are more likely to disclose higher levels of CSR information than those in a collectivist society. The first hypothesis is as
follows:
H1. Individualism is positively related to CSR disclosure levels. (2) Power distance
Power distance is the extent to which the less powerful members of organizations and institutions accept and expect that power is distributed unequally among them. Power and inequality are a fundamental societal condition (Hofstede, 1980, 1983). Gray (1988) hypothesized that the higher a country ranks in terms of power distance, the more likely it will rank highly in terms of secrecy. Noravesh et al. (2007) support this hypothesis. Kumar (2013) suggests that information from authorities is questioned to a lesser extent in a high power-distance society. In addition, power distance exhibits a negative influence on CSR in most studies (Matthiesen and Salzmann, 2016). Regarding Hofstede’s power distance dimension, Ringov and Zollo (2007), and Ioannou and Serafeim (2012) theorize it and find the relationship, which they attribute to business leaders’ use of power for the pursuit of personal benefit (Liang et al., 2014). Therefore, societies with low levels of power distance are likely to discourage extensive sharing of information. Firms in a low power distance society are more likely to disclose higher levels of CSR information than firms in a collectivist society. The second hypothesis is as follows:
H2. Power distance is negatively related to CSR disclosure levels. (3) Uncertainty avoidance
Uncertainty avoidance indicates the degree to which members of a society are uncomfortable with uncertainty and ambiguity. Uncertainty avoiding cultures attempt to minimize uncertainty through strict laws, rules, and safety and security measures (Hofstede, 1980, 1983). Gray (1988) suggests that a preference for conservative profit measures is consistent with strong uncertainty avoidance. Based on this hypothesis, Chalmers et al. (2014) show that a risk-averse attitude leads to lower materiality thresholds. A lower materiality threshold implies higher CSR information disclosures. Williams (1999) finds that uncertainty avoidance is related to voluntary environmental and social disclosure. In addition, from the perspective of CSR, Matthiesen and Salzmann (2016) state that business strategies to help develop sustainable relationships with stakeholders and to minimize the likelihood of negative events in turn minimize long-term uncertainty, which suggests a positive relationship between uncertainty avoidance and CSR. Ho et al. (2012) find a positive relationship between uncertainty avoidance and CSR activities. Thus, the third hypothesis is as follows:
H3. Uncertainty avoidance is positively related to CSR disclosure levels. (4) Masculinity
Masculinity indicates a society’s preference for achievement, heroism, assertiveness, and material success (Hofstede, 1980, 1983). Gray (1988) hypothesized that the lower a country
Table 3. Average CSR disclosure scores by country China (N=279) (N=345)Japan (N=48)Korea CSR(0-74) 17.74 28.31 33.02 ORGAN(0-2) 0.95 0.74 1.21 HUMAN(0-16) 2.56 5.49 6.35 LABOR(0-10) 3.70 4.66 5.58 ENVIR(0-8) 2.63 6.70 4.77 FAIR(0-10) 1.34 2.46 3.56 CONSU(0-14) 2.02 4.60 5.29 COMMU(0-14) 4.53 3.67 6.25
ranks in terms of masculinity, the more likely it will rank highly in terms of secrecy. Masculinity is negatively correlated to secrecy; instead, it is positively related to disclosure. Williams (1999) finds that masculinity is related to voluntary environmental and social disclosure. In addition, from the perspective of CSR activities, regarding Hofstede’s masculinity dimension, Ho et al. (2012) find a positive relationship. Thus, the fourth hypothesis is as follows:
H4. Masculinity is positively related to CSR disclosure levels.
3.3 Estimated Model
Table 3 summarizes firms’ average CSR disclosure scores by country. Among the three countries, 48 Korean firms show the highest mean CSR at 33.0 points, followed by 345 Japanese firms with a moderate mean CSR of 28.3 points, and 279 Chinese firms with the lowest mean CSR of 17.7 points. In addition, Table 3 presents the CSR for these three countries by subject for the seven core ISO 26000 subjects. This suggests that firms’ CSR disclosure practices differ according to CSR issues and by country.
Considering stakeholders’ influence on CSR disclosure, our empirical model incorporates four stakeholder power proxies as control variables to abstract the influence of cultural factors. Size and profitability are proxies for governments, which can create political costs; the debt-equity ratio is a proxy for creditors; and high-profile environmental industries is a proxy for environmental conservation groups. In addition, although Gray (1988) suggests that the prevailing accounting values in a country are influenced not only by national cultural values but also by other institutional factors, three countries with relatively similar economic background and institutional background on CSR disclosure are the subject of this
study, which allows us to focus on the effect of cultural factors. Hence, this study estimates the following model that incorporates Hofstede’s cultural dimensions:
CSR j= α0 + α1CDj + α2log (SALES) +α3ROA+ α4 DE+ α5 HPEI+ εj, j =1,...,4,
where CDj denotes the cultural dimensions, which are CD1 = IDV, CD2 = PDI, CD3 =
UAI, and CD4= MAS, IDV denotes the individualism index, PDI denotes the power distance
index, UAI denotes the uncertainty avoidance index, and MAS denotes the masculinity index. These variables take the values of Hofstede’s index by country. The coefficients of IDV, UAI, and MAS are expected to be positive, whereas the coefficient of PDI is expected to be negative. The model incorporates log of sales (log (SALES)), return on assets (ROA), and the debt-to-equity ratio (DE) to control for firm profitability and capital structure, and high-profile environmental industries (HPEI) to control for the effect of environmental conservation groups.
4. Results
4.1 Sample and Data
The principle stock exchanges for China, Japan, and Korea were the sources for the study sample. All CSR reports of the listed firms from the largest CSR reports websites in each country were collected. As of July 2013, 279 Chinese firms out of 941 total A-share firms listed on the Shanghai Stock Exchange disclose CSR reports on the Syntao website. 345 Japanese firms out of 1,787 total firms listed on the First Section of the Tokyo Stock Exchange disclose CSR reports on the Environmental Reporting Plaza website provided by the Japanese Ministry of Economy, Trade, and Industry. 48 Korean firms out of 774 total firms listed on the Korea Stock Exchange disclose CSR reports on the Business Institute for Sustainable Development website provided by the Korean Chamber of Commerce and Industry. We collected all CSR reports for all these firms for the year 2012, using the version published in their local languages, and the related financial data for each firm was obtained from the NEEDS financial database by Nikkei Digital Media, the Compustat database by Standard and Poor’s, and the firms’ annual reports.
4.2 Estimation Results
Tables 4 and 5 present the descriptive statistics and correlation coefficient matrices, respectively. As Table 5 demonstrates, the four Hofstede cultural dimension variables are highly correlated, which suggests the presence of multicollinearity. Therefore, models are estimated that contain one cultural dimension variable, while alternately removing the other three variables.
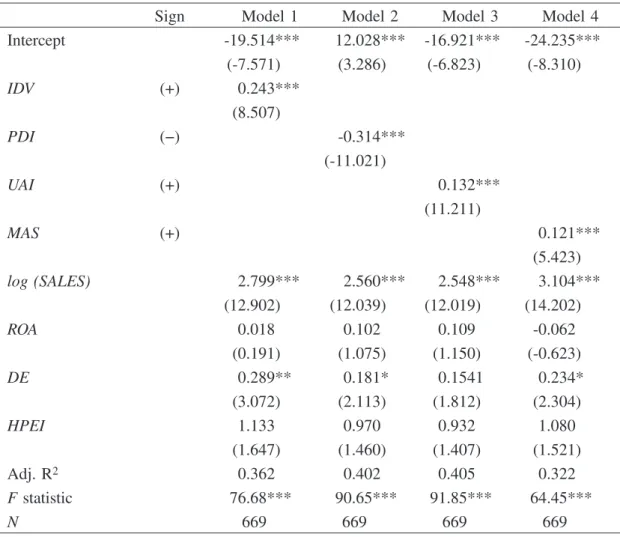
Table 6 presents the results of the ordinary least squares (OLS) model estimations. The values in parentheses are White’s heteroskedasticity-consistent standard errors. The first
column shows the OLS estimate of the coefficient of IDV (Model 1). The coefficient of IDV is significant and positive (p < 0.001). This may reflect the higher preference for a loosely knit social framework, which facilitates more CSR disclosures; thus, hypothesis 1 is supported. This result may be caused by differences in the IDV index between the Japanese and Chinese firms. Japan has an IDV index of 46, with a moderate CSR disclosure level. In contrast, the Chinese IDV index is 20 with the lowest level of CSR disclosure. Therefore,
IDVis positively related to CSR disclosure.
Model 2 uses PDI as the cultural dimension. The coefficient of PDI is significant and negative at the 0.1% level. This suggests that the higher the degree to which the less powerful members of a society accept and expect that power is unequally distributed, the less the amount of CSR information disclosed; thus, hypothesis 2 is supported. The Japanese firms have a PDI index of 54, while the Chinese firms have a PDI index of 80. Therefore, PDI has a negative relationship with CSR disclosure levels. This result is
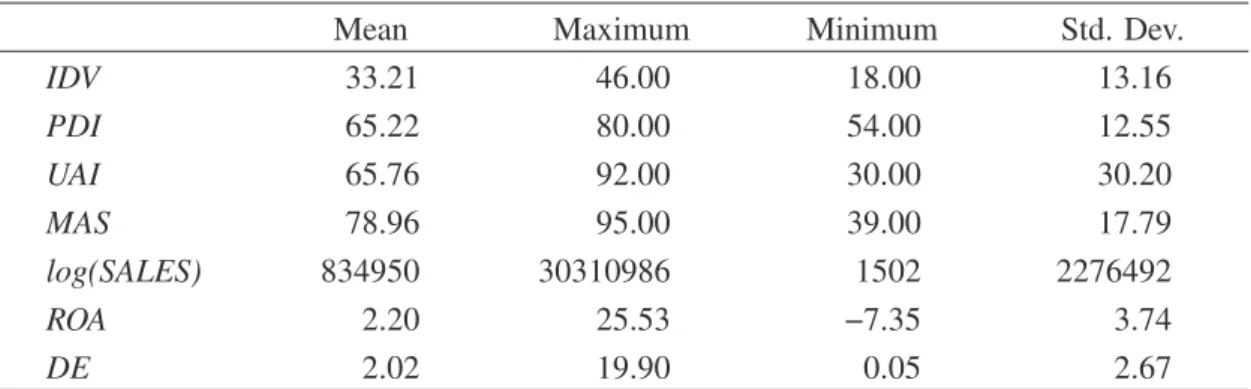
Table 4. Descriptive statistics (N = 669)
Mean Maximum Minimum Std. Dev.
IDV 33.21 46.00 18.00 13.16 PDI 65.22 80.00 54.00 12.55 UAI 65.76 92.00 30.00 30.20 MAS 78.96 95.00 39.00 17.79 log(SALES) 834950 30310986 1502 2276492 ROA 2.20 25.53 −7.35 3.74 DE 2.02 19.90 0.05 2.67
IDV = Individualism, PDI = Power distance, UAI = Uncertainty avoidance, MAS = Masculinity, log (SALES)= log of Sales, ROA = Return on assets, DE = Debt-to-equity ratio.
Table 5. Pearson correlation coefficients for independent variables (N = 669)
(1) (2) (3) (4) (5) (6) (7) (1) IDV 1.000 (2) PDI -0.903 1.000 (3) UAI 0.940 -0.998 1.000 (4) MAS 0.875 -0.703 0.658 1.000 (5) log (SALES) 0.244 -0.344 0.353 0.132 1.000 (6) ROA -0.092 0.198 -0.210 0.004 -0.143 1.000 (7) DE -0.271 0.056 -0.024 -0.405 0.282 -0.286 1.000
consistent with the idea that high power distance makes managers act in a more self-interested way rather than considering the interests of society (Matthiesen and Salzmann, 2016)
In Model 3, the coefficient of UAI is significant (p < 0.001) and positive, which indicates that hypothesis 3 is supported. This suggests that uncertainty avoidance in a society increases its CSR disclosure. Japan and Korea, where firms disclose CSR information at relatively high levels, have a UAI of 92 and 85, respectively, whereas the Chinese UAI has a
Table 6. Regression results (Dependent variable: CSR)
Sign Model 1 Model 2 Model 3 Model 4
Intercept -19.514*** 12.028*** -16.921*** -24.235*** (-7.571) (3.286) (-6.823) (-8.310) IDV (+) 0.243*** (8.507) PDI (−) -0.314*** (-11.021) UAI (+) 0.132*** (11.211) MAS (+) 0.121*** (5.423) log (SALES) 2.799*** 2.560*** 2.548*** 3.104*** (12.902) (12.039) (12.019) (14.202) ROA 0.018 0.102 0.109 -0.062 (0.191) (1.075) (1.150) (-0.623) DE 0.289** 0.181* 0.1541 0.234* (3.072) (2.113) (1.812) (2.304) HPEI 1.133 0.970 0.932 1.080 (1.647) (1.460) (1.407) (1.521) Adj. R2 0.362 0.402 0.405 0.322 Fstatistic 76.68*** 90.65*** 91.85*** 64.45*** N 669 669 669 669
* p < 0.05. ** p < 0.01. *** p < 0.001. IDV, PDI, UAI and MAS are one-tailed. IDV = Individualism, PDI= Power distance, UAI = Uncertainty avoidance, MAS = Masculinity, log (SALES) = log of sales, ROA = Return on assets, DE = Debt-to-equity ratio, HPEI = High-profile environmental industries dummy. White heteroskedasticity-consistent standard errors are in parentheses.
value of 30. This attitude toward uncertainty may create a situation where firms are required to provide further CSR information.
In Model 4, the coefficient of MAS is significant (p < 0.001) and positive, as expected. Japan and China have an MAS index of 95 and 66, respectively. These results suggest that competitiveness in society encourages firm CSR disclosure; thus, hypothesis 4 is supported.
4.3 Additional Analysis
(1) Cultural influence on each subject of CSR disclosure
Table 1 and Table 2 show that firms’ CSR disclosure practices differ according to CSR issues and country. Therefore, the CSR disclosure scores are divided into six categories according to the ISO 26000 core subjects on CSR (HUMAN, LABOR, ENVIR, FAIR, CONSU, and COMMU),and are used as dependent variables to estimate Equation (1). Tables 7 to 12 show the estimation results using the ISO 26000 categories.
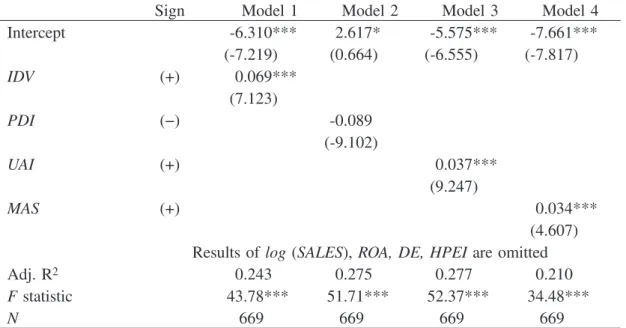
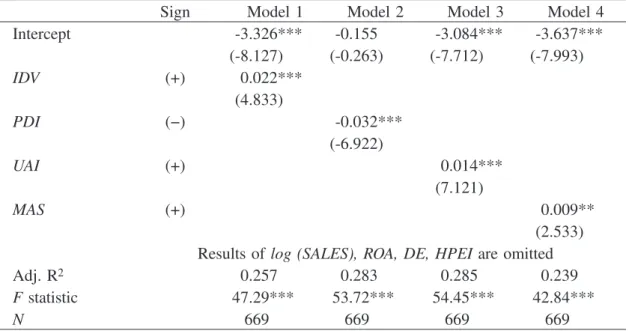
Table 7 displays estimation results using the human rights score (HUMAN), which shows results similar to those in Table 6. Table 8 shows that estimation results using the labor practices score (LABOR) are also similar to those in Table 6. MAS, however, is not significantly related to LABOR in Model 4. This suggests that the degree of masculinity in society does not affect firm disclosure of labor practices. Estimation results using the environmental disclosure score (ENVIR) are shown in Table 9, and Hofstede’s cultural dimension variables are significantly related to the environmental disclosure score in each model, which portray results similar to those in Table 6. Table 10 shows that estimation results using the fair operating practices score (FAIR) are like those in Table 6. Estimation results using the consumer issues score (CONSU) are presented in Table 11; the results shown are similar to those in Table 6. Interestingly, estimation results using the community involvement and development score (COMMU) in Table 12 show results that are opposite to those in Table 6. This suggests that there is a different mechanism for firm disclosure of community involvement and development.
(2) Cultural Influence on CSR disclosure using alternative indices
Because similar cultural backgrounds among the three countries might have changed over the last couple of decades since the Hofstede research, we conduct an additional analysis for our hypotheses using alternative cultural indices. We used Perceptions of society (Trust in
people) (PS) instead of individualism (IDV), Perceptions of individual well-being
(Satisfaction with freedom of choice) (PIW) instead of power distance (PDI), both of which
are from the United Nations Human Development Index from the UN Human Development Report 2013, and Gender gap index rank (GGI) instead of Masculinity (MAS), which is from the Global Gender Gap Report 2012 by the World Economic Forum. There is no alternative index for UAI from any other reliable source.
Table 7. Regression results (Dependent variable: HUMAN)
Sign Model 1 Model 2 Model 3 Model 4
Intercept -6.310*** 2.617* -5.575*** -7.661*** (-7.219) (0.664) (-6.555) (-7.817) IDV (+) 0.069*** (7.123) PDI (−) -0.089 (-9.102) UAI (+) 0.037*** (9.247) MAS (+) 0.034*** (4.607) Results of log (SALES), ROA, DE, HPEI are omitted
Adj. R2 0.243 0.275 0.277 0.210
Fstatistic 43.78*** 51.71*** 52.37*** 34.48***
N 669 669 669 669
* p < 0.05. ** p < 0.01. *** p < 0.001. IDV, PDI, UAI and MAS are one-tailed. White heteroskedasticity -consistent standard errors are in parentheses.
Table 8. Regression results (Dependent variable: LABOR)
Sign Model 1 Model 2 Model 3 Model 4
Intercept -0.824 1.784* -0.637 -0.978 (-1.405) (0.462) (-1.098) (-1.512) IDV (+) 0.016** (2.535) PDI (−) -0.026*** (-3.951) UAI (+) 0.011*** (4.097) MAS (+) 0.005 (1.046) Results of log (SALES), ROA, DE, HPEI are omitted
Adjusted R2 0.112 0.124 0.126 0.105
Fstatistic 17.85*** 19.92*** 20.18*** 16.66***
N 669 669 669 669
* p < 0.05. ** p < 0.01. *** p < 0.001. IDV, PDI, UAI and MAS are one-tailed. White heteroskedasticity -consistent standard errors are in parentheses.
Table 9. Regression results (Dependent variable: ENVIR)
Sign Model 1 Model 2 Model 3 Model 4
Intercept -2.411*** 12.603*** -1.022* -6.024*** (-5.095) (19.190) (0.254) (-10.072) IDV (+) 0.137*** (26.038) PDI (−) -0.148*** (-28.898) UAI (+) 0.061*** (28.413) MAS (+) 0.085*** (18.677) Results of log (SALES), ROA, DE, HPEI are omitted
Adj. R2 0.598 0.641 0.634 0.468
Fstatistic 200.1*** 239.0*** 232.1*** 118.4***
N 669 669 669 669
* p < 0.05. ** p < 0.01. *** p < 0.001. IDV, PDI, UAI and MAS are one-tailed. White heteroskedasticity -consistent standard errors are in parentheses.
Table 10. Regression results (Dependent variable: FAIR)
Sign Model 1 Model 2 Model 3 Model 4
Intercept -3.326*** -0.155 -3.084*** -3.637*** (-8.127) (-0.263) (-7.712) (-7.993) IDV (+) 0.022*** (4.833) PDI (−) -0.032*** (-6.922) UAI (+) 0.014*** (7.121) MAS (+) 0.009** (2.533) Results of log (SALES), ROA, DE, HPEI are omitted
Adj. R2 0.257 0.283 0.285 0.239
F statistic 47.29*** 53.72*** 54.45*** 42.84***
N 669 669 669 669
* p < 0.05. ** p < 0.01. *** p < 0.001. IDV, PDI, UAI and MAS are one-tailed. White heteroskedasticity -consistent standard errors are in parentheses.
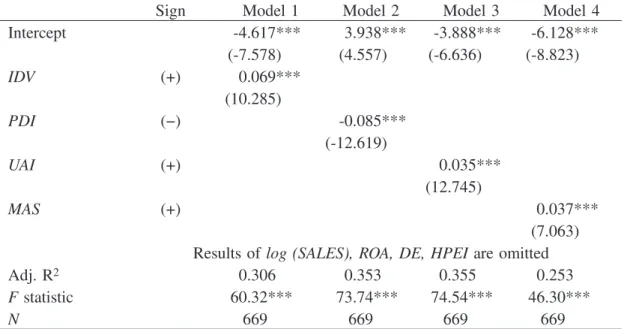
Table 11. Regression results (Dependent variable: CONSU)
Sign Model 1 Model 2 Model 3 Model 4
Intercept -4.617*** 3.938*** -3.888*** -6.128*** (-7.578) (4.557) (-6.636) (-8.823) IDV (+) 0.069*** (10.285) PDI (−) -0.085*** (-12.619) UAI (+) 0.035*** (12.745) MAS (+) 0.037*** (7.063) Results of log (SALES), ROA, DE, HPEI are omitted
Adj. R2 0.306 0.353 0.355 0.253
Fstatistic 60.32*** 73.74*** 74.54*** 46.30***
N 669 669 669 669
* p < 0.05. ** p < 0.01. *** p < 0.001. IDV, PDI, UAI and MAS are one-tailed. White heteroskedasticity -consistent standard errors are in parentheses.
Table 12. Regression results (Dependent variable: COMMU)
Sign Model 1 Model 2 Model 3 Model 4
Intercept -2.646*** -8.385*** -3.231*** -0.789 (-4.447) (-9.508) (-5.379) (-1.199) IDV (+) -0.059*** (-9.021) PDI (−) 0.056*** (8.137) UAI (+) -0.026*** (-7.887) MAS (+) -0.042*** (-8.422) Results of log (SALES), ROA, DE, HPEI are omitted
Adj. R2 0.319 0.305 0.301 0.309
Fstatistic 63.69*** 56.69*** 58.63*** 60.93***
N 669 669 669 669
* p < 0.05. ** p < 0.01. *** p < 0.001. IDV, PDI, UAI and MAS are one-tailed. White heteroskedasticity -consistent standard errors are in parentheses.
The value of Perceptions of society (PS) indices are 57 for China, 33 for Japan, and 26 for Korea, which indicates the percentage answering “yes” for the question about having trust in people; this is the opposite of IDV, therefore the expected sign in our estimation model is negative. The value of Perceptions of individual well-being (Satisfaction with
freedom of choice) (PIW) indices are 77 for China, 78 for Japan, and 66 for Korea, and is
the equivalent of PDI; therefore the expected sign is negative. The value of Gender gap
index rank (GGI) indices are 69 for China, 101 for Japan, and 108 for Korea, where a
higher index suggests a smaller gender gap; this is the equivalent of MAS, and therefore the
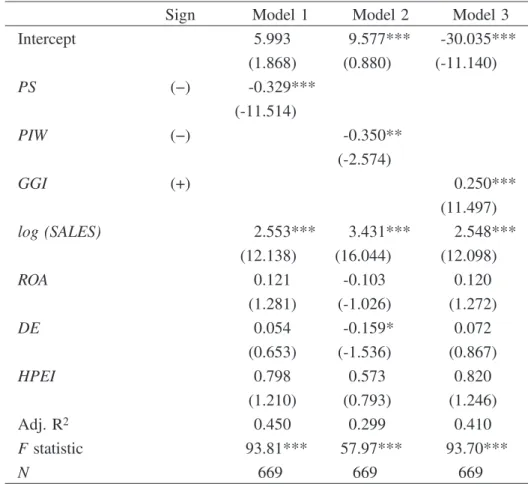
Table 13. Regression results (Additional analysis) (Dependent variable: CSR)
Sign Model 1 Model 2 Model 3
Intercept 5.993 9.577*** -30.035*** (1.868) (0.880) (-11.140) PS (−) -0.329*** (-11.514) PIW (−) -0.350** (-2.574) GGI (+) 0.250*** (11.497) log (SALES) 2.553*** 3.431*** 2.548*** (12.138) (16.044) (12.098) ROA 0.121 -0.103 0.120 (1.281) (-1.026) (1.272) DE 0.054 -0.159* 0.072 (0.653) (-1.536) (0.867) HPEI 0.798 0.573 0.820 (1.210) (0.793) (1.246) Adj. R2 0.450 0.299 0.410 Fstatistic 93.81*** 57.97*** 93.70*** N 669 669 669
* p < 0.05. ** p < 0.01. *** p < 0.001. PS, PIW and GGI are one-tailed. PS = Perceptions of society (Trust in people), PIW = Perceptions of individual well-being (Satisfaction with freedom of choice), GGI = Gender gap index rank, log (SALES) = log of sales, ROA = Return on assets, DE = Debt-to-equity ratio, HPEI = High-profile environmental industries dummy. White heteroskedasticity-consistent standard errors are in parentheses.
expected sign is positive. Thus, our hypotheses will be empirically supported if the sign of the estimated coefficient for PS is significantly negative, the sign of the estimated coefficient for PIW is significantly negative, and the sign of the estimated coefficient for GGIS is significantly positive.
Table 13 presents the results. In Model 1, the coefficient of PS is significant (p < 0.001) and negative, which indicates that hypothesis 1 is supported. In Model 2, the coefficient of
PIW is significant (p < 0.01) and negative, which indicates that hypothesis 2 is supported.
In Model 3, the coefficient of GGI is significant (p < 0.001) and positive, which indicates that hypothesis 4 is supported. These results confirm that these cultural factors influence CSR disclosure.
5. Conclusion
CSR disclosure is a standard business practice worldwide, and China, Japan, and Korea lead CSR disclosure in Asia. Although these three countries have common Confucian cultural and historical roots, there are significant differences in their CSR disclosures. Hofstede’s (1980) analysis of culture and Gray’s (1988) theory on the influence of culture on accounting are extensively used in cross-cultural accounting studies to explain the differences across countries (e.g., Chand et al., 2012). In comparison to financial reporting, CSR disclosure is influenced by stakeholders’ information needs that are based on their respective national cultural backgrounds. O’Riordan and Fairbrass (2008) suggest that Hofstede’s (1980) work on culture is relevant to CSR practices.
When analyzing cultural influence on CSR disclosure, it is important that other conditions should be equal to the extent possible. Therefore, this study focuses on China, Japan, and Korea, where the historical roots and institutional background of CSR disclosures are similar. In addition, although Orij (2010) uses a secondary data source (the Siri database) for CSR disclosure to represent CSR disclosure levels related to national cultures,
this study uses primary data sources―firm CSR or sustainability reports published in local
languages (in Chinese, Japanese, and Korean) for CSR disclosure content analysis. This study addresses three key questions: (1) whether there is a difference in firm CSR disclosure practice among China, Japan, and Korea, where historical backgrounds and institutional environments for CSR disclosures are relatively similar; (2) whether and which cultural factors affect CSR disclosure; and (3) whether the influence differs among CSR items. First, a content analysis of the CSR reports of Chinese, Japanese, and Korean firms in their local languages is conducted, based on the framework of the International Organization for
Standardization (ISO) 26000―Social Responsibility. Based on this analysis, the study
investigates whether and how national cultures influence CSR disclosures, and the degree of the influence among CSR items, using the theories of Hofstede (1980) and Gray (1988).
The results reveal three key findings. First, we confirm evidence that there are differences in firm CSR disclosure practices among countries. Second, we show evidence that the differences in CSR disclosures are partially attributable to domestic culture in the following ways. (a) CSR disclosure is positively related to individualism. This implies that, in individualist societies where the needs of the individual outweigh those of the many, firm CSR disclosure is prevalent. (b) CSR disclosure is negatively related to power distance. In societies where power is distributed equally, there is a greater likelihood of CSR disclosure. (c) CSR disclosure is positively related to uncertainty avoidance. A society’s intolerance for uncertainty and ambiguity encourages firm CSR disclosure. (d) Masculine cultures, which typically value competitiveness, assertiveness, materialism, ambition, and power, stimulate firm CSR disclosure. These results are consistent with Gray’s (1988) hypothesis. Third, this paper is the first to provide evidence that the cultural influence on CSR disclosure differs among the core items of ISO 26000. Each subject of CSR disclosure is also influenced by culture.
Our study contributes to the literature on CSR disclosures in several ways. First, we find evidence that domestic culture influences firm CSR disclosures in a more rigorous setting among countries where other historical backgrounds and institutional environments are
similar. Second, our analysis used a primary firm CSR disclosure source―reports published
in their local language (Chinese, Japanese, and Korean)―instead of secondary data sources,
such as Siri, that have been used in previous research (Orij, 2010).
The results imply that both regulators and users must acknowledge cultural biases in firm CSR disclosures. When regulators design institutional arrangements to promote firm CSR disclosure, they should consider the influence of domestic culture. In addition, no matter how excellent the global CSR or sustainability disclosure guidelines are, firms disclose differently depending on their local culture. Regulators should commit to improving the disclosures in specific CSR areas where firms in a country disclose less. In addition, users of CSR disclosures should compare the disclosed information cross-nationally with consideration for domestic culture, and provide feedback to firms to improve the disclosure. Chand et al. (2012) indicate that national culture has a significant effect on accounting judgments, and educational similarity does not moderate the effect. As Chalmers et al. (2014) state, the results imply that global CSR disclosure guideline-setters should consider the cultural factors that may result in differences in interpretation and application, and should consider reducing these biases to avoid unintended reporting differences despite the use of global guidelines by firms. Strategies to adjust according to country cultural profiles are required for both regulators and users.
This study is limited by a focus on three countries in East Asia. Confucianism is a
cultural roots of Confucianism. Although differences in CSR disclosure among these countries based on cultural influence are found, extended research into other areas might reveal greater differences. In addition, our content analysis is hampered by potential limitations with the measurement of our CSR disclosure score, which uses zero (no disclosure), one (only qualitative disclosure) and two (qualitative and quantitative disclosure) for each item. A disadvantages of this type of analysis is that it can present an overly simplistic view of the disclosure by distilling a great deal of information into a series of numbers. This limitation, however, applies to all content analysis studies, and has been noted in previous studies. Moreover, the study relates to the CSR reports of a single year, which was 2012. A longitudinal study may provide further insights.
References
Adnan, S.M., van Staden, C.J., and Hay, D. (2014), “The legitimacy of institutional theory: the case of CSR reporting in cross-cultural setting”, SSRN http://ssrn.com/abstract=2498257
Boardman, C.M. and Kato, H.K. (2003), “The Confucian roots of business kyosei”, Journal of Business
Ethics, Vol. 48 No. 4, pp. 317-333.
Borker, D.R. (2012a), “Accounting, culture, and emerging economies: IFRS in the BRIC countries”,
Journal of Business & Economics Research, Vol. 10 No, 5, pp. 313-324.
Borker, D.R. (2012b), “Accounting, culture and emerging economies: IFRS in central and eastern Europe”,
International Business & Economics Research Journal, Vol. 11 No 9, pp. 1003-1018.
Burchell, S., Clubb, C., and Hopwood, A.G. (1985), “Accounting in its social context: toward a history of value added in the United Kingdom”, Accounting, Organizations and Society, Vol. 10 No. 4, pp. 381-413.
Chalmers, K., Voets, C., and Kajuter, P. (2014), “The impact of national culture on accounting judgement under IFRS: experimental evidence from Asia and Europe”, paper presented at American Accounting Association, International Accounting Section / International Association for Accounting Education & Research Conference in San Antonio.
Chanchani, S., and Willett, R. (2004), “An empirical assessment of Gray’s accounting value constructs”,
The International Journal of Accounting, Vol. 39 No. 2, pp. 125-154.
Chand, P., Cummings, L., and Patel, C. (2012), “The effect of accounting education and national culture on accounting judgments: a comparative study of Anglo-Celtic and Chinese culture”, European
Accounting Review, Vol. 21 No. 1, pp. 153-182.
Chapple, W., and Moon, J. (2005), “Corporate social responsibility (CSR) in Asia: a seven-country study of CSR web site reporting”, Business and Society, Vol. 44 No. 4, pp. 415-441.
Chen, S., and Bouvain, P. (2009), “Is corporate responsibility converging? a comparison of corporate responsibility reporting in the USA, UK, Australia, and Germany”, Journal of Business Ethics, Vol. 87, pp. 299-317.
Clarkson, P.M., Li, Y., Richardson, G.D., and Vasvari, F.P. (2008), “Revisiting the relation between environmental performance and environmental disclosure: an empirical analysis”, Accounting,
Organization and Society, Vol. 33, pp. 303-27.
Cox, C.A., and Douthett Jr., E.B. (2009), “Further evidence on the factors and valuation associated with the level of environmental liability disclosures”, Academy of Accounting and Financial Studies Journal, Vol. 13 No. 3, pp. 1-26.
Elijido-Ten, E. (2007), “Applying stakeholder theory to analyze corporate environmental performance: evidence from Australian listed companies”, Asian Review of Accounting, Vol. 15 No. 2, pp. 164-184. Elijido-Ten, E., Kloot, L., and Clarkson, P. (2010), “Extending the application of stakeholder influence
strategies to environmental disclosures: an exploratory study from a developing country”, Accounting,
Auditing & Accountability Journal, Vol. 23 No. 8, pp. 1032-1059.
Finch, N. (2009), “Towards an understanding of cultural influence on the international practice of accounting”, Journal of International Business and Cultural Studies, Vol. 2 No. 1, pp. 1-6.
Francis, J., and Schipper, K. (1999), “Have financial statements lost their relevance?”, Journal of
Accounting Research, Vol. 37 No. 2, pp. 319-352.
Fujita, H. (2002), “The reproduction of Hofstede model”, Annals of Business Administrative Science, Vol. 1 No. 3, pp. 47-56.
Gamerschlag, R., Moller, K., and Verbeeten, F. (2011), “Determinants of voluntary CSR disclosure: empirical evidence from Germany”, Review of Management Science, Vol. 5, pp. 233-262.
Gordon, E.A., Greiner, A., Kohlbeck, M.J., Lin, S., and Skaife, H. (2013), “Challenges and opportunities in cross-country accounting research”, Accounting Horizons, Vol. 27 No. 1, pp. 141-154.
Gray, R. (2010), “A re-evaluation of social, environmental and sustainability accounting: an exploration of an emerging trans-disciplinary field?”, Sustainability Accounting, Management and Policy Journal, Vol. 1 No. 1, pp. 11-32.
Gray, S.J. (1988), “Towards a theory of cultural influence on the development of accounting systems internationally”, Abacus, Vol. 24 No. 1, pp. 1-15.
Han S., Kang, T., Salter, S., and Yoo, Y.K. (2010), “A cross-country study on the effects of national culture on earnings management”, Journal of International Business Studies, Vol. 41, pp. 123-141.
Healy, P.M. and Palepu, K.G. (2001), “Information asymmetry, corporate disclosure, and the capital markets: a review of the empirical disclosure literature”, Journal of Accounting and Economics, Vol. 31, pp. 405-440.
Ho, F.N., Wang, H.M., and Vitell, S.J. (2012), “A global analysis of corporate social performance: the effects of cultural and geographic environments”, Journal of Business Ethics, Vol. 107 No. 4, pp. 423-433.
Hofstede, G. (1980), Cultures’ Consequences: International Differences of Work Related Values, Sage, Beverly Hills.
Hofstede, G. (1983), “National cultures in four dimensions”, International Studies of Management &
Organization, Vol. 13 No. 1-2, pp. 46-74.
Hofstede, G. (2001), Culture’s Consequences: Comparing Values, Behaviors, Institutions, and
Organizations across Nations(2nd edition), Sage, Thousand Oaks, CA.
Hofstede, G., and Bond, M.H. (1988), “The Confucius connection: from cultural roots to economic growth”, Organizational Dynamics, Vol. 16 No. 4, pp. 5-21.
Holmen, J. (2014), “Cultural differences of nations and the reporting of intellectual capital”, International
Journal of Business and Social Science, Vol. 5 No. 8, pp. 10-17.
Huang, C.-L., and Kung, F.-H. (2010), “Drivers of environmental disclosure and stakeholder expectation: evidence from Taiwan”, Journal of Business Ethics, Vol. 96, pp. 435-451.
Ioannou, I., and Serafeim, G. (2012), “What drives corporate social performance?: the role of national-level institution”, Journal of International Business Studies, Vol. 43, pp. 834-864.
Jacobs, L. Guopei, G., and Herbig, P. (1995), “Confucian roots in China: a force for today’s business”,
Management Decision, Vol. 33 No. 10, pp. 29-34.
Kanagaretnam, K., Lim, C.Y., and Lobo, G.J. (2011), “Effects of national culture on earnings quality of banks”, Journal of International Business Studies, Vol. 42, pp. 853-874.
Kim, D., and Choi, M.-II. (2013), “A comparison of young publics’ evaluations of corporate social responsibility practices of multinational corporations in the United States and South Korea”, Journal of
Business Ethics, Vol. 113, pp. 105-118.
Kim, Y., and Kim S-Y. (2010), “The influence of cultural values on perceptions of corporate social responsibility: application of Hofstede’s dimensions to Korean public relations practitioners”, Journal
of Business Ethics, Vol. 91, pp. 485-500.
Kumar, G. (2013), “Voluntary disclosures of intangibles information by U.S.-listed Asian companies”,
Journal of International Accounting, Auditing and Taxation, Vol. 22, pp. 109-118.
Law, P.K.C., and Ang, S.L. (2013), “Confucian ethics, governance and corporate social responsibility”,
International Journal of Business and Management, Vol. 8 No. 4, pp. 30-43.
Lee, D.Y. (2012), “Corporate social responsibility disclosure among large Korean companies”, Australian
Journal of Business and Management Research, Vol. 2 No. 11, pp. 1-14.
Lev, B., and Zarowin, P. (1999), “The boundaries of financial reporting and how to extend them”, Journal
of Accounting Research, Vol. 37 No 2, pp. 353-385.
Liang, H., Marquis C., Renneboog, L., and Sun, S.L. (2014), “Speaking of corporate social responsibility”,
European Corporate Governance Institution, Finance Working Paper, No. 412/2014, pp. 1-48.
Liu, X., and Anbumozhi, V. (2009), “Determinant factors of corporate environmental information disclosure: an empirical study of Chinese listed companies”, Journal of Cleaner Production, Vol. 17, pp. 893-600.
Lu, Y., and Abeysekera, I. (2014), “Stakeholders’ power, corporate characteristics, and social and environmental disclosure: evidence from China”, Journal of Cleaner Production, Vol. 64, pp. 426-436. Matthiesen, M.-L., and Salzmann, A.J. (2016), “Corporate social responsibility and firm’s cost of equity:
how does culture matter?”, Cross Cultural & Strategic Management, Vol. 24 No. 1, pp. 105-124. McSweeney, B. (2002), “Hofstede’s model of national cultural differences and their consequences: A
triumph of faith - a failure of analysis”, Human Relations, Vol. 55 No. 1, pp. 89-118.
Noravesh, I., Dilami, Z.D., and Bazaz, M.S. (2007), “The impact of culture on accounting: does Gray’s model apply to Iran?” Review of Accounting and Finance, Vol. 6 No. 3, pp. 254-272.
Orij, R. (2010), “Corporate social disclosures in the context of national cultures and stakeholder theory”,
Accounting, Auditing & Accountability Journal, Vol. 23 No. 7, pp. 868-889.
O’Riordan, L., and Fairbrass, J. (2008), “Corporate social responsibility (CSR): models and theories in stakeholder dialogue”, Journal of Business Ethics, Vol. 83, pp. 745-758.
Park, H., Rehg, M.T., and Lee, D. (2005), “The influence of Confucian ethics and collectivism on whistleblowing intentions: a study of South Korean public employees”, Journal of Business Ethics Vol. 58, pp. 387-403.
Rapp, J.K., Bernardi, R.A., and Bosco, S.M. (2011), “Examining the use of Hofstede’s uncertainty avoidance construct in international research: a 25-year review”, International Business Research, Vol. 4 No. 1, pp. 3-15.
Ringov, D., and Zollo, M. (2007), “The impact of national culture on corporate social performance”,
Corporate Governance, Vol. 7 No. 4, pp. 476-485.
Roberts, R.W. (1992), “Determinants of corporate social responsibility disclosure: an application of stakeholder theory”, Accounting, Organizations and Society, Vol. 17 No. 6, pp. 595-612.
Saka, C. (2016), “Corporate Social Responsibility Disclosure and Social Value in East Asia”,
Syogaku-Ronkyu,Vol. 63 No. 3, pp. 505-522. (in Japanese)
Saka, C., and Noda, A. (2013), “The effects of stakeholders on CSR disclosure: evidence from Japan”,
Proceedings of the 8th International Conference of Accounting and Management Systems (AMIS 2013), The Bucharest University of Economic Studies, Piata Romana, No. 6, pp. 867-897.
Smith, A. (2002), “Testing the stability of the global concept of culture in an accounting context”,
Accounting Enquiries, Vol. 11 No. 2, pp. 227-248.
Sondergaard, M. (1994), “Hofstede’s consequences: a study of reviews, citations and replications”,
Organization Studies, Vol. 15 No. 3, pp. 447-456.
Tang, L., and Li, H. (2009), “Corporate social responsibility communication of Chinese and global corporations in China”, Public Relations Review, Vol. 35, pp. 199-212.
Tsakumis, G.T. (2007), “The influence of culture on accountants’ application of financial reporting rules”,
Van der Laan G., Van Ees, H. and Witteloostuijn, A.V. (2008), “Corporate social and financial performance: an extended stakeholder theory, and empirical test with accounting measures”, Journal of
Business Ethics, Vol. 79, pp. 299-310.
Watts, R. and Zimmerman, J. (1986), Positive Accounting Theory,Prentice Hall, Englewood Cliffs. Welford, R. (2005), “Corporate social responsibility in Europe, North America and Asia: 2004 survey
results”, Journal of Corporate Citizenship, Vol. 17, pp. 33-52.
Williams, S.M. (1999), “Voluntary environmental and social accounting disclosure in the Asia-Pacific region: an international empirical test of political economy theory”, The International Journal of
Accounting, Vol. 34 No. 2, pp. 209-238.
Williams, G. and Zinkin, J. (2008), “The effect of culture on consumers’ willingness to punish irresponsible corporate behaviour: applying Hofstede’s typology to the punishment aspect of corporate social responsibility”, Business Ethics, Vol. 17 Iss. 2, pp. 210-226.
Wong, L. 2009, “Corporate social responsibility in China: between the market and the search for a sustainable growth development”, Asian Business & Management, Vol. 8 No. 2, pp. 129-148.
Yao, S., Wang, J., and Song, L. (2013), “Determinants of corporate social responsibility disclosure: evidence from China”, The Journal of Applied Business Research, Vol. 29 No. 6, pp. 1833-1847. Zhao, M. (2012), “CSR-based political legitimacy strategy: managing the state by doing good in China and