Immune Regulation by Transforming Growth
Factor-β Superfamily Cytokines
著者
Youn Jung Hwan
year
2016
その他のタイトル
TGF-β スーパーファミリーサイトカインによる免
疫系制御
学位授与大学
筑波大学 (University of Tsukuba)
学位授与年度
2016
報告番号
12102乙第2791号
URL
http://hdl.handle.net/2241/00145208
筑
波
大
学
Immune Regulation by
Transforming Growth Factor-β
Superfamily Cytokines
(
TGF-β スーパーファミリーサイトカインによる
免疫系制御)
201
6
筑波大学
尹 晶煥
1
Table of Contents
I.
Introduction
---
2
II.
Phosphorylation status determines the opposing functions of ---
9
Smad2/Smad3 as STAT3 cofactors in Th17 differentiation
(リン酸化状態が
STAT3 転写共役因子としての Smad2/Smad3 相反作用を規定する)
Materials and Methods
---
10
Results ---
17
Summary
---
52
Discussion ---
53
III.
Activin receptor-like kinase5 inhibition suppresses mouse
---
56
melanoma by ubiquitin degradation of Smad4, thereby derepressing
eomesodermin in cytotoxic T lymphocytes
(TGF-β I 型受容体阻害は、細胞障害性 T リンパ球に発現する Smad4 ユビキチン
分解による
eomesodermin 抑制解除を誘導しマウス悪性黒色腫を抑制する)
Materials and Methods
---
57
Results ---
63
Summary
---
94
Discussion --- 95
IV. Conclusion ---
98
2
Introduction
1. TGF-β superfamily cytokines and signal transduction pathways
Transforming growth factor-β (TGF-β) superfamily cytokines are the evolutionary conserved pleiotropic secreted cytokines, which consist of TGF-β, Activins, Nodals, Bone Morphogenetic Protein (BMP), Myostatins, Growth and Differentiation Factors (GDF), Anti-Muellerian Hormones (AMH) and others (over 30 members) (Massague J et al, 2005). Individual family cytokines have crucial roles in multiple processes throughout development and in the maintenance of tissue homeostasis. Subversion of signaling by TGF-β superfamily members has been implicated in many human diseases, including cancer, fibrosis, inflammation, autoimmune and vascular diseases (Dijke P et al. 2007). Among them, TGF-β is produced from many kinds of cells, tissues and organs, and plays important roles in regulating cell proliferation, differentiation, homeostasis and death (Massague J et al, 2012).
The active form of TGF-β initiates its signal transduction by binding to specific serine/threonine kinase transmembrane type I and type II receptors (Heldin CH et al, 2012; Massague J et al, 2003). Upon ligand-induced heteromeric complex formation, the TGF-β type II receptor transphosphorylates and activates TGF-β type I receptor (Activin receptor-like kinase (ALK)5). Activated TGF-β type I receptor phosphorylates TGF-β-specific receptor regulated SMAD (R-Smad): Smad2 and Smad3 at the C-terminal two serine residues of Mad homology (MH)-2 domain. Activated Smad2 and Smad3 form heteromeric complexes with common-mediator SMAD: Smad4 to regulate transcription of the target genes (Massague J et al, 2005; Heldin CH et al, 2012). Besides SMAD pathway, various kinds of protein kinases mediate non-SMAD pathway. TGF-β type I receptor phosphorylates various protein kinases including phosphoinositide 3 kinase (PI3K), mitogen-activated protein kinases (MAPKs): extracellular signal-regulated kinase (ERK), c-Jun N-terminal kinase (JNK), and p38 MAPK (p38), which then phosphorylate the variable linker regions of receptor regulated SMADs (Massague J et al, 2003; Wrighton KH et al, 2009; Matsuzaki K et al, 2013) (Background Fig. 1).
<Background Figure 1> TGF-β signaling pathways
3
TGF-β R-Smads: Smad2 and Smad3 are highly homologous in their structure. They contain 2 conserved polypeptide segments, MH1 and MH2 domain, and connected by linker domain (Background Fig. 2 left). The MH1 domain is involved in DNA binding and nuclear transport, whereas the MH2 domain is involved in receptor-mediated Smad C-terminal phosphorylation, Smad-Smad interaction and binding with many different transcriptional regulators (Gaarenstroom T et al, 2014). MH1 domain has a DNA binding site, which recognizes Smad binding elements (SBE, 5’-CAGA-3’) and regulates transcriptions of the genes. However, Smad2 cannot bind directly to DNA, it regulates transcriptions of target by interacting with other related molecules (Matsuzaki K, 2012). C-terminal serine residues, SSXS motif in MH2 domain are phosphorylated by TGF-β type I receptor, whereas various kinds of phosphorylation sites of linker domain are phosphorylated by protein kinases including MAPK. TGF-β type I receptor and various kinds of protein kinases differentially regulate Smad2 and Smad3 phosphorylations in a context-dependent manner (Matsuzaki K et al, 2013) (Background Fig. 2 right). Linker phosphorylated R-SMADs through Ras-MAPK antagonize C-terminally phosphorylated R-SMADs. Ras-MAPK mediated Smad3 linker phosphorylation enhances cell growth and proliferation by upregulating mitogenic signal genes such as c-Myc gene in normal epithelial cells. By contrast, TGF-β type I receptor regulated Smad3 C-terminal phosphorylation is involved in cell growth inhibition by inducing growth inhibition
genes such as p15, p21 and p27 in normal epithelial cells (Matsuzaki K, 2012 and 2013).
However,
precise roles and regulatory mechanisms of linker-phosphorylated or C-terminal-phosphorylated
R-SMADs remain largely undetermined in immune regulation.
<Background Figure 2> Structure of receptor regulated SMAD (R-Smad) and TGF-β signaling pathways via linker phosphorylated R-SMAD and C-terminally phosphorylated R-SMAD
4 2. Role of TGF-β on immune system
TGF-β has been recognized as the most potent immunosuppressive cytokine, suppressing the differentiation and function of effector immune cells and inducing suppressor immune cells in immune system (Li MO et al, 2006; Travis MA et al, 2014). TGF-β inhibits differentiation, activation and immunogenic function of innate immune cells such as immunogenic dendritic cells (DC), macrophages and NK cells and immune responses of adaptive effector immune cells (Flavell RA et al, 2010). TGF-β directly suppresses the development, differentiation and immunogenic functions and activities of various
effector T cell subsets such as CD4+ T lymphocytes Th1 (cellular immunity), Th2 (allergic diseases and
humoral immunity), cytotoxic CD8+ T lymphocytes (CTL) (cytotoxic immunity and anti-tumor
immunity) and IL-17 producing CD4+ T cells: Th17 (autoimmunity). In addition to direct immune
suppression, TGF-β indirectly suppresses effector immune cells by inducing differentiation and function of CD4+Foxp3+ regulatory T cells: Treg (immune surveillance) (Li MO et al, 2006 and Korn T et al, 2009) (Background Fig. 3).
< Background Figure 3> Effects of TGF-β on effector T cell differentiation
Although TGF-β is abundantly produced and activated in inflammation and tumor microenvironment, however, precise molecular mechanisms how TGF-β signaling regulates effector immune cell responses in immune diseases and cancer still remain largely unknown.
In my doctoral dissertation, I report the novel TGF-β signaling mechanisms for Th17 cells in rheumatoid arthritis which is the representative autoimmune disease, and TGF-β signaling mechanisms for suppressing CTL in melanoma, which is a prototypical immunogenic tumor expressing melanoma -associated antigens.
3. Role of TGF-β signaling on Th17 in rheumatoid arthritis
Rheumatoid arthritis is one of autoimmune diseases, in which infiltration of the joint synovium membrane leads to bone and cartilage destruction. Th17 plays the pathogenic role in rheumatoid arthritis. IL-17A produced by Th17 enhances arthritogenic symptoms, such as inflammation, cartilage damage,
5
thrombosis and bone erosion (Korn T et al, 2009 and Pierre M et al, 2012). TGF-β had been appreciated as the most potent immunosuppressive cytokine, suppressing the differentiation and functions of effector immune cells as inducing suppressor immune cells (Li MO et al, 2006; Travis MA et al, 2014). However, since identified as the requisite cytokine in combination with IL-6 for the differentiation of Th17 through inducing a master transcription factor, RORγt and IL-17 (Veldhoen M et al, 2006; Manel N et al, 2008), context-dependent multidirectional roles of TGF-β have been highlighted in immune regulation, similarly with its roles in carcinogenesis and cancer progression (Massague J et al, 2012). Th17 is a crucial effector
CD4+ T cell subset in inflammation, protective mechanisms against infections, tumor immunity, and
autoimmune responses (Korn T et al, 2009; Iwakura Y et al, 2011). Crucial pathogenic role of Th17 in rheumatoid arthritis has been well demonstrated by numerous studies including the pioneer work showing the attenuation of collagen-induced arthritis (CIA) in the mice deficient in IL-17A (Nakae S et al, 2003). Activated TGF-β type I receptor through TGF-β signal phosphorylates not only C-termini of R-Smads, but also activates various protein kinases including mitogen-activated protein kinases (MAPKs) (Background Fig. 1). TCR, IL-6 and TGF-beta share Ras-MAPK pathways, which induce linker phosphorylation of TGF-β receptor-regulated SMADs, Smad2 and Smad3. However, phosphorylation status of Smad2/Smad3, C-terminal and linker phosphorylation or unphosphorylation during Th17 differentiation remains undetermined (Neurath MF et al, 2011; Liu H et al, 2013) (Backgrund Fig. 2 right).
Several reports have been published regarding TGF-β signaling in Th17 differentiation as listed in Background Table 1. However, there are points of controversy in theses reports. Lu L et al. concluded that JNK and p38-mediated TGF-β signaling pathways are required for Th17 differentiation based on the similar inhibitory effect of inhibitors against TβRI, JNK and p38 on Th17 differentiation. However, effect similarity of inhibitors with TβRI/TβRII inhibition on Th17 cannot demonstrate that each targeted enzyme is downstream of TβRI for Th17 differentiation (Hasan M et al, 2015). Lu L et al. also addressed that Smad2 and Smad3 were not involved in Th17 differentiation both in vitro and in vivo using murine experimental encephalomyelitis (EAE) model, which is inconsistent with the other reports by Matinez GJ et al. and Malhorta N et al, in which they showed that Smad2 deficiency suppressed, whereas Smad3 deficiency enhanced Th17 differentiation and EAE. Martinez GJ et al. reported that Smad3 interacted with RORγt to decrease, whereas Smad2 interacted with RORγt to enhance RORγt-induced Th17 differentiation. However, mechanisms how Smad2 and Smad3 oppositely regulate RORγt-induced Th17 differentiation were not addressed. Malhorta N et al. reported that Smad2 was essential for Th17 differentiation by modulating IL-6 receptor (IL-6R) expression, which was not observed in my system (Fig. 9). Takimoto T et al. reported that TGF-β-mediated induction of RORγt was independent of both
Smad2 and Smad3 and Ichiyama K et al. reported that the suppression of Eomesodermin by TGF-β via
the JNK pathway is an important mechanism for Smad-independent Th17 cell differentiation using Smad2/3 double knockout mice, in which it is impossible to distinguish the distinct effects of Smad2 and
6
Smad3. Xial S et al. reported that TGF-β-driven Smad3 signaling enhanced by retinoic acid inhibited Th17 differentiation. Collectively, Smad2 seems to be an inducer, whereas Smad3 seems to be a suppressor of Th17, thus far. MAPK signaling pathways, which phosphorylate linker regions of R-Smads, play crucial roles in differentiation and functions of effector T cells (Li MO et al, 2006; Travis MA et al, 2014; Dong C et al, 2002). Chang X et al reported that the kinases MEKK2/3 induced linker phosphorylation of Smad2/3, which antagonized their C-terminal phosphorylation and inhibited Th17 differentiation, although inhibition of Smad3 C-terminal phosphorylation in MEKK2/3 double knockout T cells determined by CAGA-luc reporter assay and Western blotting did not seem to be significant,
moreover, they did not examine Smad2 linker phosphorylation. However whether diverse
phosphorylation status of R-Smads, such as linker phosphorylation or unphosphorylation affects Th17 differentiation remains largely undetermined.
<Background Table 1> Reported roles of TGF-β signaling in Th17 differentiation
IL-6 and other cytokines such as IL-21 and IL-23 that induce and maintain Th17 activate STAT3, a critical transcription factor for Th17 differentiation and the pathogenesis of autoimmune diseases including RA (Hirahara K et al, 2010). In contrast to the established essential roles of STAT3-mediated IL-6 signaling in Th17 differentiation, molecular mechanisms by which R-Smads regulate Th17 differentiation still remain under debate. Despite their high amino acid sequence homology, Smad2 and Smad3 exert both redundant and distinct functions in TGF-β signaling depending on the context (Brown KA et al, 2007).
Therefore, I sought to determine the mechanisms whereby R-Smads regulate Th17 differentiation. I investigated the molecular mechanisms how Smad2 and Smad3 regulate the transcription of the essential genes for Th17 and examined the pathophysiological roles of R-Smads in Th17-related inflammatory
disease by applying a CIA model to Smad2-deficient (Smad2-/-), Smad3-deficient (Smad3-/-), and control
wild-type mice. I discovered the opposing functions of Smad2 and Smad3 as transcription cofactors of STAT3 in Th17 differentiation independently of Smad4: the canonical partner of C-terminally phosphorylated R-Smads. Mechanistic studies showed that phosphorylation status of R-Smads
7
distinctively modulated STAT3-induced transcription of the Rorc and Il17a genes. Linker-phosphorylated Smad2 (pSmad2L) at the residue Ser255 via ERK served as a STAT3 coactivator in cooperation with p300, whereas C-terminally unphosphorylated Smad3 (unphosphorylated Smad3C) served as a STAT3 corepressor in cooperation with protein inhibitor of activated STAT3 (PIAS3), the negative regulator of STAT3 signaling.
4. Role of TGF-β signaling on CTL in melanoma
Tumor cells and stromal cells in the tumor microenvironment produce and activate TGF-β abundantly for suppressing anti-tumor immunity (Bierie et al, 2006; Flavell RA et al, 2010). TGF-β suppresses anti-tumor immunity by directly inhibiting the differentiation and functions of various effector cells, such as DC, NK, Th1, and cytotoxic T lymphocytes (CTLs) (Li MO et al, 2006). In addition to direct immune suppression, TGF-β indirectly suppresses anti-tumor immunity by inducing suppressor immune cell subsets,
such as Foxp3+ regulatory T cells (Treg) and myeloid-derived suppressor cells (Flavell RA et al, 2010)
(Background Fig. 4).
<Background Figure 4> Inhibition of Anti-tumor Immune Responses by TGF-β
Varieties of TGF-β antagonists have been developed to intervene with excessive TGF-β signaling activity in cancer (Hata A et al, 2012). TGF-β type I receptor: activin receptor-like kinase5 (ALK5) inhibitors are the small molecule inhibitors, which block phosphorylation of TGF-β receptor-activated Smads (R-Smads) by occupying the ATP binding site of TβRI domain (Jin et al, 2011). On the basis of a selective, imidazole-based ALK5 inhibitor, 4-(4-(benzo[d][1,3]dioxol-5-yl)-5-(pyridin-2-yl)-1H- imidazol-2-yl) benzamide, SB-431542 (Callahan et al, 2002) as a lead compound, we designed and synthesized an orally bioavailable ALK5 inhibitor, N-((4-([1,2,4]triazolo[1,5-a]pyridin-6-yl)-5- (6-methylpyridin-2-yl)-1H-imidazol-2-yl)methyl)-2-fluoroaniline, EW-7197 (Kim et al, 2011) <Background Fig. 5>.
8
< Background Figure 5> ALK5 inhibitors (EW7197 and LY2157299) and TGF-β signaling pathway
Melanoma is a prototypical immunogenic tumor expressing melanoma-associated antigens, which are targeted by CTLs (Thomson et al, 1988). CTLs lyse the target tumor cells with the cytolytic molecules (Russell et al, 2002). The T-box transcription factors, T-bet and Eomes are crucial for the differentiation and effector functions of CTLs (Glimcher et al, 2004; Intlekofer et al, 2005; Pearce et al, 2003), which are required for anti-tumor immune responses (Zhu et al, 2010). Thus, intensive efforts have focused on developing immunotherapies to activate anti-melanoma T cell responses (Kirkwood et al, 2008). However, melanoma cells produce high amounts of TGF-β, which limit the success of immunotherapy by rendering the host immune response tolerant to tumor-associated antigens (Javelaud et al, 2008).
Therfore, I report the cellular and molecular mechanisms how EW-7197 and a representative ALK5 inhibitor,4-(2-(6-methylpyridin-2-yl)-5,6-dihydro-4H-pyrrolo[1,2-b]pyrazol-3-yl)quinolone-6-carboxami de, LY-2157299 (Calvo-Aller et al, 2008) exert a therapeutic effect on a mouse model of B16 melanoma. Oral treatment with a novel ALK5 inhibitor, EW-7197 (2.5 mg/kg daily) or a representative ALK5 inhibitor, LY-2157299 (75 mg/kg bid) suppressed the progression of melanoma with enhanced CTL responses. Notably, ALK5 inhibitors not only blocked R-Smads phosphorylation, but also induced
ubiquitin-mediated degradation of the Smad4 mainly in CD8+ T cells in melanoma-bearing mice.
Accordingly, T-cell specific deletion of Smad4 was sufficient to suppress the progression of melanoma. I further identified eomesodermin (Eomes), the T-box transcription factor regulating CTL functions, as a
specific target repressed by TGF-β via Smad4 and Smad3 in CD8+ T cells. Thus, ALK5 inhibition
enhances anti-melanoma CTL responses through ubiquitin-mediated degradation of Smad4 in addition to the direct inhibitory effect on R-Smad phosphorylation.
9
Phosphorylation status determines the opposing functions of
Smad2/Smad3 as STAT3 cofactors in Th17 differentiation
(リン酸化状態が
STAT3 転写共役因子としての
10
Materials and Methods
Mice
Smad23loxp/3loxp mice targeting exons 9 and 10 (Liu Y et al, 2004), Smad3ex8/ex8 mice targeting exon 8 (Yang X et al, 1999) were generated as described on Sv129 x C57BL/6J background and backcrossed to
C57BL/6J mice (Nihon SLC) for eight generations. For in vitro experiments, Smad3ex8/ex8 mice were
backcrossed to C57BL/6J background for four generations. I used Smad3+/- mice because Smad3-/- mice
develop osteoarthritis, bone malformation (Yang X et al, 2001), and impaired mucosal immunity (Yang X
et al, 1999), and the embryonic lethality of Smad3-/- mice in C57BL/6 background was extremely high,
similarly with Tgf-β1-/- mice (Bonyadi M et al, 1997). Cd4Cre transgenic mice (Lee PP et al, 2001) were
purchased from Jackson laboratories. Mx-1Cre transgenic mice (Kuhn R et al, 1995)were kindly provided
by Dr. Masayuki Yamamoto (Tohoku University, Japan). For Mx-1Cre mice, gene deletion was induced by i.p. injection of polyI:C at 2-3 weeks of age as described previously (Campbell IK et al, 2000). For immunophenotyping, spleens and superficial lymph nodes (cervical, axillary, brachial, and inguinal) from the female mice aged between 12-16 weeks were used (age and sex matched, no randomized). All animals were maintained and used for experiments according to the ethical guidelines for animal experiments and the safety guidelines for gene manipulation experiments at Konkuk University, Korea, University of Tsukuba, Japan, Tokyo Medical University, Japan under approved animal study protocols.
Collagen Induced-Arthritis (CIA)
For induction of collagen-induced arthritis, I used immunization protocol for C57BL/6 strain (H-2b) (Campbell IK et al, 2000). Briefly, 100 µg of type II chick collagen (Sigma-Aldrich, Cat. #C9301) was dissolved in 10 mM acetic acid (2 mg/ml) by stirring overnight at 4°C. I dissolved 250 µg of heat-killed
mycobacterium tuberculosis (Difco Laboratories) in incomplete Freund adjuvant (GIBCO). Type II chick
collagen mixture gently emulsified in complete Freund adjuvant by 1:1 ratio on ice for 1 hr (100 µg of type II chick collagen emulsified in 100 µl of incomplete adjuvant with 250 µg of heat-killed
mycobacterium tuberculosis). Mice aged between 8-10 weeks were injected i.d. (100 µl of emulsion) at
several sites into the base of the tail and back that is near hind leg areas by using 26 G needle on day -21, and the same injection was repeated on day 0. Arthritis development in each paw was scored by macroscopic evaluation (Rosloiec EF et al, 2010) as: (0) no change, (1) erythema and mild swelling confined to the ankle, (2) erythema and mild swelling from the ankle to mid-foot, (3) moderate swelling (4) severe swelling. The maximum score per mouse is 16. Ten to twenty mice/genotype were used (Figure 1 legend and Supplementary figure 2 legend). Mice were dissected 2 weeks after the second immunization to evaluate the draining lymph nodes (popliteal, inguinal, axillary, and brachial).
11
Histological analysis
Paws from collagen-immunized mice were harvested, fixed in 10% neutral-buffered formalin, decalcified, dehydrated with 70% ethanol, embedded in paraffin, and sectioned at 3 µm. Sections were stained with hematoxylin and eosin (H&E), toluidine blue, or safranin O. For immunohistochemistry, sections were incubated in the 60°C for overnight. Incubated sections were deparaffinized and hydrated by xylene and graded alcohol series (Xylene for 15 min, and 100%, 95%, 90%, 85%, 80% and 70% of EtOH for 5 min). After deparaffinization and hydration, tissue sections were rinsed in tap water for 10 min. Tissue sections were added by 3% hydrogen peroxide solution in room temperature for 30 min for peroxidase quenching, and washed in PBS for 5 min. After peroxidase quenching, added one or two drops of blocking solution (Dako, Cat.# x0590) in 37°C for 30 min. After blocking, tissue sections were incubated with rat anti-CD4 (Abcam, Cat.# ab25475), rabbit anti-RORγt (Abcam, Cat.# ab78007), rabbit anti-IL-17A (Abcam, Cat. #ab79056) antibodies in 4°C for overnight, and washed in PBS for 5 min. Incubated sections from primary antibodies were incubated by diluted biotinlated secondary antibody in 37°C for 30 min, and washed in PBS for 5 min. After secondary antibody incubation, the sections were incubated with VETA STAIN R.T.U Elite ABC Reagent (Vector) in 37°C for 30 min, and washed in PBS for 5 min. The tissue sections were treated DAB solution for 5 min (according to samples), and washed in PBS for 5 min. After DAB exposure step, the tissue sections were incubated in hematoxylene for 1 min, and washed in tap water for 30 min. After counterstain step, dehydrated and mounted. Slides were observed using an optical microscope, DM5000B (Leica).
Flow cytometry analyses
Fluorophore-conjugated antibodies were purchased from BD Pharmingen and eBioscience (APC-Cy7-anti-CD4, Pacific blue-anti-CD8, APC-anti-CD25, FITC-anti-CD103, PE-anti-RORγt, PE-anti-T-bet, PE-Cy7-anti-Foxp3, APC-anti-IL-17A, PE-anti-IL-6, FITC-anti-TNFa, PE-Cy7-anti-IFN-γ, APC-anti-phospho ERK1/2, PE-anti-phospho JNK, FITC-anti-phospho p38 were used). CD16/32 were blocked by Fc-Block (BD Pharmingen, Cat. #553142) and isotype-matched control antibodies were used in each experiment. For cytokine intracellular staining, cultured Th17 cells or freshly isolated cells from CIA mice were treated with 5 ng/ml of phorbol-12-myristate 13-acetate (PMA) (Sigma Aldrich) and 500 ng/ml of ionomycin (Sigma Aldrich) in the presence of GolgiPlug (BD Pharmingen) for the last 4 hours of culture. For intracellular staining, cultured cells were fixed by Cytoperm/Cytofix kit (BD Pharmingen). For Foxp3 staining, Foxp3 staining kit (eBioscience, Cat. #00-5523-00) was used. Stained cells were acquired and analyzed using LSR II (BD) and FlowJo software (Tree Star Inc.).
T cell stimulation in vitro.
Cell suspensions were prepared from spleens and superficial lymph nodes (cervical, brachial, axillary and inguinal and popliteal lymph nodes) by filtering through Cell Strainers (pore size: 40-µm diameter) (BD
12
Falcon). Erythrocytes were lysed using RBC Lysis Buffer (Rhoche) and cells were washed in PBS containing 2% FBS (Hyclone Laboratories). Viable cells were counted by hemacytometer using trypan blue exclusion. CD4+ T cells were purified to >90% by magnetic activated cell separation purification
using CD4+ (L3T4) Microbeads (Miltenyi Biotec). In some experiments, CD44lowCD62LhighCD4+ T cells
were sorted by FACS Aria (BD) and the purity was >98%. Purified CD4+ T cells were stimulated by plate-coated anti-CD3 (2.0 µg/ml; BD Pharmingen, Cat. #553057) and soluble anti-CD28 antibodies (5.0 µg/ml; BD Pharmingen, Cat. #553294) with mIL-6 (50 ng/ml), TGF-β1 (1 ng/ml; Peprotech), anti-mouse IL-4 (10 µg/ml; Biolegend, Cat. #504108) and anti-mouse IFN-γ antibodies (10 µg/ml; BioLegend, Cat. #505812) in 10% FCS RPMI 1640 media supplemented with penicillin and streptmycin (HyClone) for Th17 differentiation for 3-4 days as previously described (Veldhoen M et al, 2006). In
some experiments, Purified CD4+ T cells were stimulated by the indicated doses of plate-coated anti-CD3,
TGF-β1, and mIL-6, or by plate-coated anti-CD3 (10.0 µg/ml; BD Pharmingen, Cat. #553057), soluble anti-CD28 antibodies (5.0 µg/ml; BD Pharmingen, Cat. #553294), IL-1β (10 ng/ml; Peprotech), IL-23 (10 ng/ml; Peprotech), and the neutralizing antibodies described above, or by the indicated doses of various small molecule inhibitors: EW-7197 (ALK5 inhibitor) from Dr. Dae-Kee Kim, PD98059 (MEK inhibitor), SP600125 (JNK inhibitor), and SB203580 (p38 inhibitor) (Sigma Aldrich). STAT3 siRNA (Dharmacon), PIAS3 siRNA (Santa Cruz), DNA constructs: Smad2, Smad2 (S255A), Smad3, Smad3 (3S-A), and Smad3 (MH1+L) from Dr. Koichi Matsuzaki and Dr. Takeshi Imamura, PIAS3 (Addgene,
submitted by Shuai), and pcDNA or control RNA were transfected to purified CD4+ T cells using
4D-NucleofectorTM and AmaxaR Mouse T cell nucleofactorR kit (Lonza) prior to the cell culture.
RNA isolation and quantitation of mRNA by real-time RT-PCR
Total RNA was extracted using Trizol according to the manufacturer’s instructions (Invitrogen). RNA was reverse transcribed with cDNA reverse transcription kit (Invitrogen). Amount of cDNA was quantitated by SYBR green (Applied Biosystems) real time PCR using ABI 7900 and ABI 7300 machines (Applied Biosystems). The primers are described in Table 1.
13 Table 1 Primer sequences for quantitative RT-PCR
Western blotting and immunoprecipitation
293T cells (ATCC-CRL-3216) were transfected using PEI with STAT3 (Addgene, submitted by J. Darnell), FLAG-tagged Smad2 (full length, MH1, MH1+Linker, MH2+Linker, MH2, Y220V, S245A, S250A, S255A) and FLAG-tagged Smad3 (full length, MH1, MH1+Linker, MH2+Linker, MH2, 3S-A) from Dr. Koichi Matsuzaki and Dr. Takeshi Imamura. Cells were lysed with lysis buffer (PBS containing 0.5% Triton X-100, 20 mM HEPES (pH 7.4), 150 mM NaCl, 12.5 mM β-glycerol phosphate, 1.5 mM MgCl2, 10 mM NaF, 2 mM DTT, 1 mM NaOV, 2 mM EGTA, 1 mM PMSF, and protease inhibitor cock-tail) were electrophoresed on 10% SDS-polyacrylamide gel and transferred to PVDF membrane, and probed with antibodies against phospho-Smad2 (Abcam, Cat. #ab53100), phospho-Smad3 (Abcam, Cat. #ab51451), Smad2 (Santa Cruz, Cat. #sc-101153), Smad3 (Santa Cruz, Cat. #sc-101154), Smad4 (Santa Cruz, Cat. #sc-7966) and β-actin (Santa Cruz, Cat. #sc-7210). Blots were visualized using an electrochemiluminescence kit (GE Healthcare).
For immunoprecipitation, the lysates were cleared by centrifugation at 16,000 g for 10 min, incubated with protein A/G agarose beads and with anti-STAT3 antibody (Santa Cruz, Cat. # sc-7179) at 4°C for 12-16 h. The beads were washed three times with lysis buffer and immunoprecipitates were separated from the beads by adding 2× sample buffer and boiled. SDS–PAGE-separated immunoprecipitates were transferred onto PVDF membranes. The membranes were denatured with denaturation buffer containing 6 M guanidine chloride, 20 mM Tris (pH 7.5), 100 mM PMSF, and 5 mM β-mercaptoethanol at 4°C for 30 min and washed three times with TBST. The membranes were blocked with 5 % BSA and incubated with anti-FLAG antibody (Biomol, Cat. #ADI-SAB-410-0100). 293T cells (ATCC-CRL-3216) were confirmed to be mycoplasma negative using e-Myco plus Mycoplasma PCR Detection Kit (iNtRON
14 Biotechnology, Cat. #25237).
Immunocytochemistry: Proximity Ligation Assay (PLA)
CD4+ T cells cultured in Th17 condition for 3-5 days or 293T cells (ATCC-CRL-3216) transfected with
various constructs were fixed on the slides by 3.7 % formaldehyde in PBS. The slides were washed, permeabilized by 0.1 % Triton X-100 in TBS and blocked by 0.5 % bovine serum albumin. PLA was
performed using the Duolink II Fluorescence kit (OLINK) as previously described using the rabbit
antibodies against: STAT3 (Cell Signaling Technology, Cat. #12640), phospho-STAT3 Y705 (Cell Signaling Technology, Cat. #9145), phospho-STAT3 S727 (Cell Signaling Technology, Cat. #9134), Smad2 (Cell Signaling Technology, Cat. #5339), phospho-Smad2C S465/467 (Cell Signaling Technology, Cat. #3101), phospho-Smad2L S245/250/255 (Cell Signaling Technology, Cat. #3104), Smad3 (Cell Signaling Technology, Cat. #9523), phospho-Smad3C S423/425 (Cell Signaling Technology, Cat. #9520), RORγt (Abcam, Cat. #ab78007), PIAS3 (Santa Cruz, Cat. #sc-14017), Flag (Biomol, Cat. #ADI-SAB-410-0100) and phospho-Smad3L S208/213 (IBL, Cat. #JP28029), mouse antibodies against: Smad2/3 (Santa Cruz, Cat. #sc-133098), Smad4 (Santa Cruz, Cat. #sc-7966), STAT3 (Santa Cruz, Cat. #sc-8019), and p300 (Santa Cruz, Cat. #sc-48343). Target specific rabbit primary antibodies and the secondary antibodies conjugated with oligonucleotides: PLA probe anti-rabbit PLUS (Sigma-Aldrich, Cat. #DUO92002) and PLA probe anti-rabbit MINUS (Sigma-Aldrich, Cat. #DUO92005) or PLA probe anti-mouse PLUS (Sigma-Aldrich, Cat. #DUO92001) and PLA probe anti-mouse MINUS (Sigma-Aldrich, Cat. #DUO92004) were used for single recognitions. Two primary antibodies raised in different species and the secondary antibodies conjugated with oligonucleotides: PLA probe anti-rabbit PLUS and PLA probe anti-mouse MINUS were used for double recognitions. After incubation of the slides with Blocking Solution for 30 min at 37°C, they were incubated with primary antibodies diluted in the Antibody Diluent overnight at 4°C, in PLA probe solution for 1 h at 37°C and in Ligation-Ligase solution for 30 min at 37°C with washing with Wash Buffer A (0.01 M Tris, 0.15 M NaCl and 0.05% Tween 20, filtered in a 0.22 µm) in the interim of each step. The slides were incubated in Amplification-Polymerase solution for 100 min at 37°C and then washed in Wash Buffer B. Nucleus was stained with DAPI. Then, the slides were dried at room temperature in the dark. Slides were observed using a confocal microscope, LSM700 (Carl Zeiss). PLA signals were quantified using BlobFinder software (Centre for Image Analysis, Uppsala University).
Luciferase assay
The 2000 bp promoter region of RORγt was generated by PCR from genomic C57BL/6 DNA using primers described in Table 2. Products were verified by sequencing and were subcloned into pGL4 firefly luciferase construct (Promega) using NheI, EcoRV sites and XhoI, HindIII sites respectively. The pGL4 mIL-17 2kb promoter construct was from Addgene (submitted by W. Strober). The promoter constructs
15
in various combination with Flag-tagged STAT3 (Addgene, submitted by J. Darnell), Flag-tagged Smads, Flag-tagged Smad mutants, HA-tagged p300, Flag-tagged PIAS3 (Addgene, submitted by Shuai), or empty pcDNA3 plasmid were co-transfected with control TK-pRL Renilla plasmid using PEI for 293T
cells or using 4D-NucleofectorTM and AmaxaR Mouse T cell nucleofactorR kit (Lonza) for Th17 cells. Six
hours after transfection, 293T cells (ATCC-CRL-3216) were lysed for the measurement by luminometer.
CD4+ T cells were transfected in prior to the cell culture under Th17 polarizing condition for 4 days.
Table 2 Primer sequences for the proximal promoter regions
ChIP
Chromatin was prepared from 1x10⁷ CD4+ T cells isolated from C57BL/6 mice, Cd4Cre;Smad2fl/fl mice,
Smad3-/- mice and the littermate control mice under Th17 polarizing condition for 3-4 days. Immunoprecipitation was performed with antibodies against Smad2 (Cell Signaling Technology, Cat. #5339), Smad3 (Cell Signaling Technology, Cat. #9523), phospho-Smad3C S423/425 (Cell Signaling Technology, Cat. #9520), Smad4 (Santa Cruz, Cat. #sc-7966), STAT3 (Santa Cruz, Cat. #sc-7179), tri-methyl histone H3 Lys4 (Cell Signaling Technology, Cat. #9751), tri-methyl histone H3 Lys27 (Cell Signaling Technology, Cat. #9733), acetyl histone H3 Lys23 (Millipore, Cat. #17-10112), and PIAS3 (Santa Cruz) using ChIP kit (Cell Signaling) according to the manufacturer’s protocol. Immunoprecipitated DNA released from the cross-linked proteins was quantitated by real time PCR using the primers (Table 3) and was normalized to input DNA.
16 Table 3 Primer sequences for ChIP
Statistical analyses
Statistical analysis was performed using analysis tools on the VassarStats Statistical Computation site
(http://vassarstats.net/) and Excel. Data were analyzed using the parametric unpaired Student t-test, or
17
Results
Opposing roles of Smad2 and Smad3 in the pathogenesis of CIA
To examine the pathophysiological roles of R-Smads in Th17-mediated inflammatory disease, I applied a CIA model to T cell-specific (Cd4Cre;Smad2+/+,+/fl, fl/fl), inducible systemic (Mx-1Cre;Smad2+/+,+/fl, fl/fl)
Smad2 conditional knockout mice, and Smad3 heterozygote (Smad3+/+, +/-) mice. They showed normal
immune phenotypes with C57BL/6 background in a specific pathogen free environment (Fig. 1), indicating that R-Smads are dispensable for immune homeostasis. T cell-specific and systemic deletion of Smad2 ameliorated, whereas Smad3 heterozygosity exacerbated CIA (Fig. 2a and 3a). Because both systemic and T cell-specific deletion of Smad2 showed the same phenotype (Fig. 3a and 3b), I used
Cd4Cre;Smad2+/+,+/fl. fl/fl mice for further study. Cd4Cre;Smad2fl/fl mice showed significant amelioration
in joint lesions, whereas Smad3+/- mice showed proliferative detritic synovitis with mononuclear cell
infiltration and joint destruction (Fig. 2b, upper). Evaluation of proteoglycan and mucopolysaccharide of cartilage by staining with toluidine blue and Safranin O showed the significant maintenance of cartilages
in Cd4Cre;Smad2fl/fl mice and marked destruction of cartilages in Smad3+/- mice (Fig. 2b, lower).
Accumulation of CD4+, RORγt+, and IL-17A+ cells in the joint lesions was ameliorated in
Cd4Cre;Smad2fl/fl mice, whereas it was exacerbated in Smad3+/- mice (Fig. 4-6). Consistent with the joint
lesions, IL-17A+, RORγt+, IL-17A+TNF-α+ and IL-17A+RORγt+ CD4+ T cells decreased in the draining
lymph nodes of the arthritic joints of Cd4Cre;Smad2fl/fl mice and Mx-1Cre;Smad2fl/fl mice, whereas they
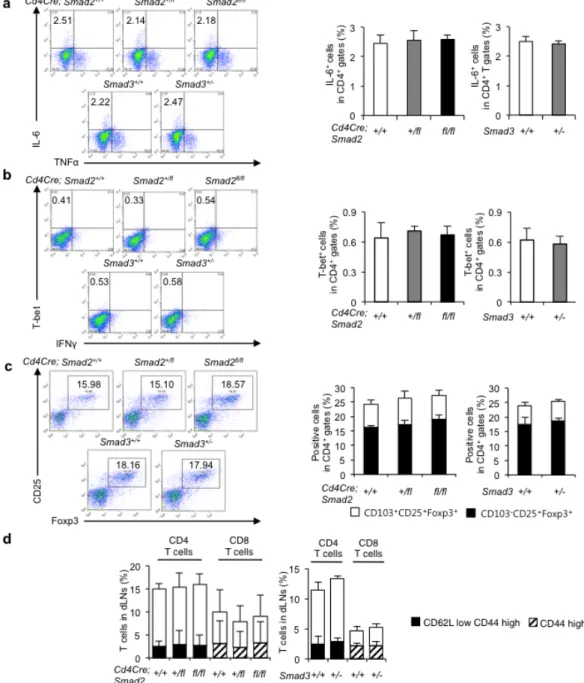
increased significantly in those of Smad3+/- mice (Fig. 2c and 3b). Smad genotypes did not affect other
effector T cell subsets, such as IL-6+CD4+, TNF-α+CD4+, Th1 (T-bet+IFN-γ+CD4+), natural and inducible
Treg cells (CD103-Foxp3+CD4+, CD103+Foxp3+CD4+), naïve and memory CD4+ and CD8+ T cells
(CD44lowCD62Lhigh, CD44highCD62Llow) in the draining lymph nodes of the arthritic joints (Fig. 7). Thus,
Smad2 and Smad3 have the opposing roles in Th17 differentiation in the pathogenesis of CIA.
18
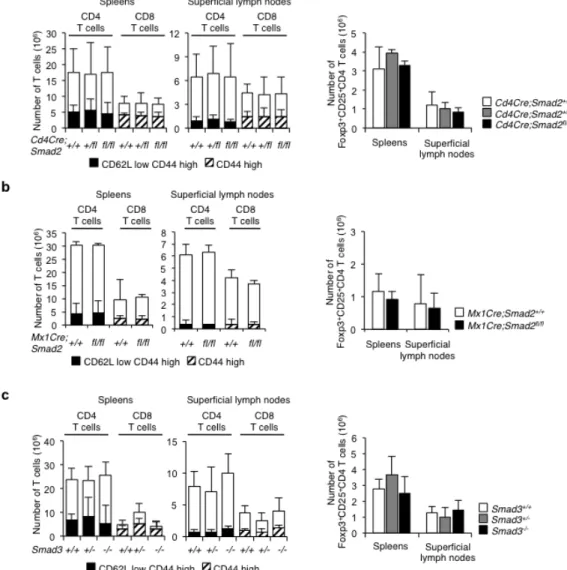
Figure 1 Smad2 and Smad3 are not essential for T cell homeostasis.
Numbers of naïve/memory CD4+ T cells, naïve/memory CD8+ T cells, and Foxp3+ Tregs in spleens and
superficial lymphnodes from (a) Cd4Cre;Smad2+/+,+/fl, fl/fl mice, (b) Mx-1Cre;Smad2+/+, fl/fl mice, and (c)
Smad3+/+, +/-, -/- mice (12-16 weeks of age, Cd4Cre;Smad2 and Smad3, n = 10/genotype, Mx-1Cre;Smad2,
n = 5 genotype). Data are from one experiment representative of seven independent experiments. Data are
19
Figure 2 Opposing effects of Smad2 and Smad3 on Th17 response in CIA.
Cd4Cre;Smad2+/+, +/fl, fl/fl and Smad3+/+, +/- mice were immunized with type II collagen emulsified in complete Freund adjuvant twice in 3 weeks interval to induce CIA. (a) CIA scoring courses of
20
Smad3+/+, Smad3+/- mice (right, n = 13/Smad3 genotype) with P values (two-way ANOVA test). (b) Pathological analyses of the joint sections (haematoxylin and eosin: HE, magnification, ×40, scale bar: 100 µm, toluidine blue and safranin O, magnification, ×200, scale bar: 50 µm). (c) Flow cytometry
analyses of IL-17A+TNF-α+ CD4+ T cells and RORγt+IL-17A+ CD4+ T cells in the draining lymph nodes
of Cd4Cre;Smad2+/+,+/fl, fl/fl (n = 20/Cd4Cre;Smad2 genotype) and Smad3+/+,+/- mice (n = 15/Smad3
genotype) on day 14 after second immunization. Graphs show the percentages and cell numbers of
IL-17A+, RORγt+, IL-17A+TNF-α+ and IL-17A+RORγt+ in CD4+ gates in the draining lymph nodes. Data
are from one experiment representative of seven (a, b), four (c, Cd4Cre;Smad2) or three (c, Smad3) independent experiments. Graphs show mean + s.d. with P values (unpaired Student’s t-test).
21
Figure 3 Inducible systemic disruption of the Smad2 gene ameliorates CIA.
(a) CIA scoring courses of Mx-1Cre;Smad2+/+,+/fl, fl/fl mice (n = 10/genotype) are shown. Dot plots and
graphs of the proportions and numbers of IL-17A+RORγt+CD4+ draining lymph node cells from
Mx-1Cre;Smad2+/+,fl/fl mice are shown. (b) Dot plots and proportions of IL-6+TNF-α+CD4+,
T-bet+IFN-γ+CD4+, CD25+Foxp3+CD4+, CD62LhighCD44low, CD62LlowCD44high CD4+ T cells and
CD44low,CD44high CD8+ T cells in the draining lymph nodes from Mx-1Cre;Smad2+/+,fl/fl mice are shown.
Data are from one experiment representative of two independent experiments. Data are mean + s.d. with
22
Figure 4 Accumulation of CD4+ cells in the joint lesions was ameliorated in Cd4Cre;Smad2fl/fl mice,
whereas it was exacerbated in Smad3+/- mice.
Immunohistochemistry staining of CD4+ in the joint sections (magnification, ×400, scale bars: 50 µm). Data are from
23
Figure 5 Accumulation of RORγt+ cells in the joint lesions was ameliorated in Cd4Cre;Smad2fl/fl
mice, whereas it was exacerbated in Smad3+/- mice.
Immunohistochemistry staining of RORγt+ in the joint sections (magnification, ×400, scale bars: 50 µm). Data are from one experiment representative of two independent experiments (Cd4Cre;Smad2 and Smad3, n = 10/genotype).
24
Figure 6 Accumulation of IL-17A+ cells in the joint lesions was ameliorated in Cd4Cre;Smad2fl/fl
mice, whereas it was exacerbated in Smad3+/- mice.
Immunohistochemistry staining of IL-17A+ in the joint sections (magnification, ×400, scale bars: 50 µm). Data are from one experiment representative of two independent experiments (Cd4Cre;Smad2 and Smad3, n = 10/genotype).
25
Figure 7 Disruption of Smad2 or Smad3 has no effect on effector T cell subsets except Th17 in CIA. Flow cytometry analyses of T cells in the draining lymph nodes of the arthritic joints from
Cd4Cre;Smad2+/+,+/fl, fl/fl mice and Smad3+/+, +/- mice (a) IL-6+TNF-α+ in CD4+ gates, (b) T-bet+IFN-γ+ in
CD4+ gates, (c) CD25+Foxp3+ in CD4+ gates, CD103-CD25+Foxp3+ in CD4+ gates, CD103+CD25+Foxp3+
in CD4+ gates, (d) CD62LhighCD44low, CD62LlowCD44high CD4+ T cells and CD44low, CD44high CD8+ T
cells (n = 10/genotype). Data are from one experiment representative of four (Cd4Cre;Smad2+/+,fl/fl, n =
20/genotype, Cd4Cre;Smad+/fl, n = 15) or three (Smad3, n = 15/genotype) independent experiments. Data
26
Opposing functions of Smad2 and Smad3 as STAT3 cofactors
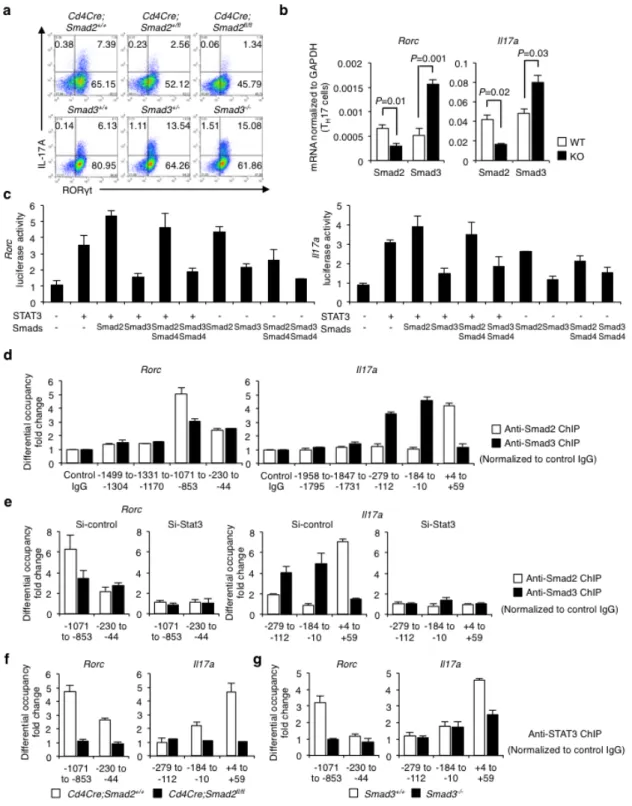
IL-6 is the main arthritogenic cytokine and TGF-β is produced and activated in the inflammatory lesions (Li MO et al, 2006; Travis MA et al, 2014; Kimura A et al, 2010). Because IL-6 and TGF-β are the pivotal cytokines to induce Th17 differentiation, I cultured Smad2-/- or Smad3-/- CD4+ T cells under Th17-polarizing condition with IL-6 and TGF-β (Veldhoen M et al, 2006) to examine the mechanisms whereby R-Smads regulate Th17 differentiation. Expression levels of protein and mRNA of RORγt and
IL-17A decreased in Smad2-/- CD4+ T cells, whereas those increased in Smad3-/- CD4+ T cells (Fig. 8a,b).
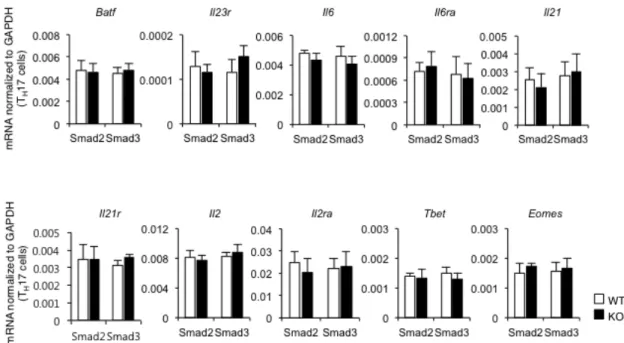
The mRNA levels of Th17-inducing genes (Batf, Il23r, Il6, Il6ra, Il21, and Il21r) and Th17-suppressing
genes (Il2, Il2ra, Tbet, and Eomesodermin) were unaffected in both Smad2-/- and Smad3-/- CD4+ T cells
(Fig. 9), suggesting that R-Smads regulate Th17 differentiation by specifically targeting the Rorc and
Il17a genes. Because IL-6 or TGF-β alone has little effect on Th17 differentiation (Veldhoen M et al,
2006) and STAT3-mediated IL-6 signaling is crucial for Th17 differentiation (Massague J et al, 2005), I
examined whether R-Smads regulate STAT3-induced transcription of RORγt and IL-17A in CD4+ T cells
cultured under Th17-polarizing condition by promoter assays with the luciferase reporters spanning 2 kilobase upstream of the first exons of the Rorc and Il17a genes (Fig. 8c). STAT3 or Smad2 alone induced their promoter activities, whereas Smad3 alone had no effect. Smad2 further enhanced, whereas Smad3 suppressed STAT3-induced reporter activation. Co-transfection of Smad4 with R-Smads and STAT3 did not show the additive effects. I next determined the binding of R-Smads to the proximal promoter regions of the Rorc and Il17a genes in Th17 cells by chromatin immunoprecipitation (ChIP) using the primers to detect the DNA-binding sequences of Smads and STAT3 (Heldin CH et al, 2012; Durant L et al, 2010; Yang XP et al, 2011). Smad2 and Smad3 were bound to the same sites in the Rorc promoter, whereas they were bound to the distinct sites in the Il17a promoter (Fig. 8d). Active promoters are characterized by histone acetylation and trimethylation of H3K4, whereas repressed inactive chromatin is marked by methylation of H3K27 and H3K9 (Gaarenstroom T et al, 2014). Smad2-binding sites in the Il17a promoter showed higher acetylation of histone H3 and trimethylation of histone H3K4, which correlate with transcriptionally active chromatin (Fig. 10a). By contrast, Smad3-binding sites in the Il17a promoter showed higher trimethylation of histone H3K27, which correlate with transcriptionally inactive chromatin (Fig. 10b). These data suggest that Smad2 and Smad3 have the opposing roles in STAT3-induced transcription of the Rorc and Il17a genes.
I next examined whether STAT3 was necessary for R-Smads to bind to these sites by STAT3 knockdown using siRNA in Th17 cells (Fig. 11). STAT3 knockdown completely abolished the binding of R-Smads to these sites (Fig. 8e). I then confirmed whether R-Smads are sufficient for STAT3 to bind to
these sites using Smad2-/- and Smad3-/- Th17 cells. STAT3 bound to the Smad2/3-binding sites in the Rorc
promoter or the Smad2-binding site in the Il17a promoter (Fig. 8f,g, white bars). Deficiency of Smad2 or Smad3 prevented STAT3 from binding to these sites (Fig. 8f,g, black bars). Thus, R-Smads and STAT3 are mutually required to bind to the proximal promoters of the Rorc and Il17a genes. Taken together,
27
Smad2 functions as a transcription coactivator, whereas Smad3 functions as a transcription corepressor of STAT3 in Th17 differentiation.
Figure 8 Opposing roles of Smad2 and Smad3 in STAT3-induced Th17 differentiation.
28
analyses of IL-17A and RORγt in Smad2+/+,+/-, -/- and Smad3+/+,+/-, -/- CD4+ T cells. (b) Quantitative
RT-PCR analysis of the Il17a and Rorc mRNA in Smad2+/+, -/- and Smad3+/+, -/- Th17 cells (n = 7). (c) Effects of Smads on STAT3-induced activation of the Rorc promoter and the Il17a promoter constructs transfected in Th17 cells were analyzed by luciferase assay. (d) Binding of Smad2 and Smad3 to the proximal promoter regions of the Rorc gene and the Il17a gene in Th17 cells was determined by ChIP. (e) Requirement of STAT3 for the binding of Smad2 and Smad3 to the proximal promoter regions of the
Rorc gene and the Il17a gene was determined by ChIP using STAT3 knockdown Th17 cells.
Requirement of Smad2 and Smad3 for the binding of STAT3 to the proximal promoter regions of the
Rorc gene and the Il17a gene was determined by ChIP using (f) Smad2-/- or (g) Smad3-/- Th17 cells. ChIP data are shown as differential occupancy fold changes. Data are from one experiment representative of seven (a, d), three (c), two (e) or five (f, g) independent experiments or pooled from seven experiments (b). Each experiment (a-g) was performed in triplicate (n = 3). Data are mean + s.d. or mean + s.d. with P values (b, unpaired Student’s t-test).
Figure 9 Disruption of Smad2 or Smad3 has no effect on Th17-related genes except the Rorc and
Il17a genes.
Quantitative RT-PCR analysis of Batf, Il23r, Il6, Il6ra, Il21, Il21r, Il2, Il2ra, Tbet, Eomes to Gapdh in
Smad2+/+, -/- and Smad3+/+, -/- Th17 cells. Data are pooled from three independent experiments. Each experiment was performed in triplicate (n = 3). Data are mean + s.d.
29
Figure 10 Smad2 binding sites are associated with active epigenetic marks, whereas Smad3 binding sites are associated with inactive epigenetic marks in the Rorc and Il17a promoter regions.
ChIP analysis of Th17 cells with antibodies against (a) acetylated histone H3 (H3Ac), trimethylated histone H3 Lys4 (H3K4me3), and (b) trimethylated histone H3 Lys 27 (H3K27me3). Data are from one experiment representative of two independent experiments. Each experiment was performed in triplicate (n = 3). Data are mean + s.d.
Figure 11 Knockdown of the Stat3 gene using STAT3 siRNA in Th17 cells.
Stat3 mRNA levels in Th17 cells transduced with the controls or STAT3 siRNA were confirmed by
quantitative RT-PCR. Flow cytometry analyses of IL-17A+RORγt+ in CD4+ gates transduced with pcDNA,
control siRNA or STAT3 siRNA in Th17-polarizing condition. Data are from one experiment representative of two independent experiments. Each experiment was performed in triplicate (n = 3). Data are mean + s.d.
30
Linker-phosphorylated Smad2 induces Th17 differentiation
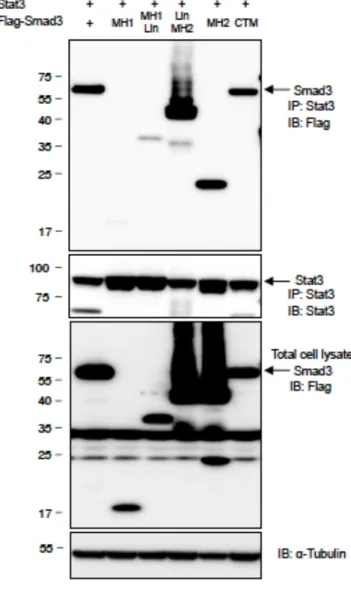
I investigated the mechanism how Smad2 functions as a transcription coactivator of STAT3. Proximity ligation assays (PLA) confirmed the endogenous close proximity between Smad2 and STAT3 in Th17 cells (Fig. 12a, left). I found that pSmad2L had close proximity with STAT3 in Th17 cells (Fig. 12a, right). By contrast, C-terminally phosphorylated Smad2 (pSmad2C) did not show close proximity with STAT3 (Fig. 12a, middle). PLA and immunoprecipitation of 293T cells transfected with the various deletion mutants of Smad2 showed that Smad2 linker deletion mutants (MH1 and MH2) (Kawabata M et al, 1999). failed to bind with STAT3 (Fig. 12b and 13a). Transfection of the linker variants of Smad2 showed that the mutant of the linker serine residue 255 to alanine: Smad2 (S255A) (Sekimoto G et al, 2007) failed to bind with STAT3 (Fig. 12c and 13b). Luciferase reporter assays showed that Smad2 (S255A) failed to enhance STAT3-induced activation of the Rorc and Il17 promoters (Fig. 12d).
Overexpression of Smad2 (S255A) in CD4+ T cells cultured under Th17-polarizing condition impaired
Th17 differentiation (Fig. 12e). Therefore, pSmad2L (Ser255) is essential for Th17 differentiation. The histone acetyl-transferase p300 is a crucial transcription coactivator of Smads (Massague J et al, 2005; Janknecht R et al, 1998). PLA showed that STAT3 and pSmad2L, but not pSmad2C, had the close proximity with p300 in Th17 cells (Fig. 12f). Luciferase reporter assays confirmed that p300 further enhanced Smad2/STAT3-induced activation of the Rorc and Il17 promoters in 293T cells (Fig. 12g). Smad2, STAT3, and p300 bound to the same sites in the proximal promoters of the Rorc and Il17a genes
in TH17 cells (Fig. 12h). Thus, pSmad2L (Ser255) forms complex with p300 and STAT3 to bind to the
31
Figure 12 Linker-phosphorylated Smad2 (S255)-STAT3-p300 complex transactivates the Rorc and
Il17a.
Interactions of endogenous proteins in Th17 cells and exogenous proteins in 293T cells were determined by proximity ligation assay (PLA). PLA signals (a-c, f) were quantified using BlobFinder software (scale bars: 10 µm, nucleus: black, cytoplasm: white, n = 10 fields). (a) Endogenous interaction between Smad2 and STAT3 in Th17 cells. (b) Effects of truncated mutations in Smad2 on the interaction with STAT3 in 293T cells. (c) Effects of linker domain variations in Smad2 on the interaction with STAT3 in 293T cells. (d) Effects of Smad2 (S255A) on STAT3-induced activation of the Rorc promoter and the Il17a promoter constructs transfected in Th17 cells were analyzed by luciferase assay. (e) Flow cytometry analyses of
IL-17A+RORγt+CD4+ T cells transduced with the indicated DNA constructs using Nucleofector (n = 2).
(f) Endogenous interactions between p300 and Smad2 or STAT3 in Th17 cells were determined by PLA. (g) Effects of p300 on Smad2/STAT3-induced activation of the Rorc promoter (white) and the Il17a promoter (black) constructs transfected in 293T cells were analyzed by luciferase assay. (h) Binding of Smad2 (white) and p300 (black) to the proximal promoter regions of the Rorc gene and the Il17a gene in Th17 cells was determined by ChIP. ChIP data are shown as differential occupancy fold changes. Data are from one experiment representative of six (a), three (b-d) or two (e-h) independent experiments. Each experiment (d, g, h) was performed in triplicate (n = 3). Data are mean + s.d.
32
Figure 13 Linker-phosphorylated Smad2 at S255 interacts with STAT3.
Interactions of exogenous Smad2 proteins and STAT3 protein in 293T cells were determined by immunoprecipitation. (a) Effects of truncated mutations in Smad2 on the interaction with STAT3 in 293T cells. (b) Effects of linker domain variations in Smad2 on the interaction with STAT3 in 293T cells. Data are from one experiment representative of three independent experiments.
33
Unphosphorylated Smad3 suppresses Th17 differentiation
I investigated the mechanism how Smad3 functions as a transcription corepressor of STAT3. PLA confirmed the endogenous close proximity between Smad3 and STAT3 in Th17 cells (Fig. 14a). Unlike R-Smads, Smad4 did not interact with STAT3 (Fig. 14a). Although STAT5 and STAT3 oppositely regulate Th17 differentiation by binding the multiple common sites across the locus encoding IL-17 (Yang XP et al, 2011), neither Smad2 nor Smad3 interacted with STAT5 (Fig. 15). Furthermore, interactions between Smad2/3 and STAT3 were more significant than the established interaction controls: pSmad2/3C-Smad4 (Massague J et al, 2005; Heldin CH et al, 2012) and Smad2/3-RORγt (Martinez GJ et al, 2009; Martinez GJ et al, 2010) (Fig. 16). PLA and immunoprecipitation of 293T cells transfected with the various deletion mutants of Smad3 showed that Smad3 MH2 deletion mutants (MH1 and MH1+L) (Kawabata M et al, 1999; Sekimoto G et al, 2007) failed to bind with STAT3 (Fig. 14b and Fig. 17). Thus, MH2 domain is required for Smad3 to bind STAT3.
PIAS3 belongs to the mammalian protein inhibitor of activated STAT (PIAS) protein family, which represses STAT3-dependent transcriptional activation by blocking the DNA-binding activity of STAT3, regardless of its small ubiquitin-like modifier-E3 ligase activity (Chung CD et al, 1997). Overexpression of Smad3, the deletion mutant lacking MH2 domain, or the C-terminal mutant in Th17 cells show that Smad3 MH2 domain, but not C-terminal SSXS motif, is functionally responsible for the suppression of Th17 differentiation (Fig. 14c). Because PIAS3 interacts with Smad3 at its C-terminal domain (Long J et al, 2004), I examined whether Smad3 recruits PIAS3 to repress STAT3-induced transcription of the Rorc and Il17a genes. PIAS3 showed the close proximity with both STAT3 and Smad3, but not with C-terminally phosphorylated Smad3 (pSmad3C) or Smad2 in Th17 cells (Fig. 14d). STAT3-PIAS3 interaction was
completely abolished in Smad3-/- Th17 cells (Fig. 14e). A mutant of serine residues to alanine in Smad3
SSXS motif, Smad3 (3S-A) was yet capable of binding with STAT3 and PIAS3 in 293T cells (Fig. 14f). Consistently, when co-transfected with PIAS3 in Th17 cells, Smad3 (3S-A) was able to suppress STAT3-induced activation of the Rorc and Il17a reporters (Fig. 14g). ChIP revealed that PIAS3 and Smad3, but not pSmad3C, bound to the same sites in the Rorc and Il17a promoters (Fig. 14h and Fig. 18). Thus, C-terminal phosphorylation is not required for Smad3 to bind with STAT3 and PIAS3. Overexpression of PIAS3 suppressed Th17 differentiation, whereas knockdown of PIAS3 by siRNA abolished the binding of Smad3 to the Rorc and Il17a promoter regions, although Th17 differentiation was unaltered by knockdown of PIAS3 presumably because relatively predominant binding of Smad2 over Smad3 in the absence of PIAS3 transactivated the Rorc and Il17a genes (Fig. 19). These data indicate that unphosphorylated Smad3C in cooperation with PIAS3 represses STAT3-induced transcription of the Rorc and Il17a gene
34
Figure 14 C-terminally unphosphorylated Smad3 recruits PIAS3 to act as a transcription corepressor of STAT3 in Th17 differentiation.
Interactions of endogenous proteins in Th17 cells and exogenous proteins in 293T cells were determined by PLA. PLA signals (a, b, d-f) were quantified using BlobFinder software (scale bars: 10 µm, nucleus: black, cytoplasm: white, n = 10 fields). (a) Endogenous interactions between Smad3/Smad4 and STAT3 in Th17 cells. (b) Effects of truncated mutations in Smad3 on the interaction with STAT3 in 293T cells.
35
(c) Flow cytometry analyses of IL-17A+RORγt+CD4+ T cells transduced with the indicated DNA
constructs using Nucleofector (n = 4). (d) Endogenous interactions between PIAS3 and
STAT3/Smad2/Smad3 in Th17 cells. (e) Endogenous interaction between PIAS3 and STAT3 in Smad3+/+,
-/- Th17 cells. (f) Effects of Smad3 C-terminal mutation on the interaction with STAT3 (left) or the
interaction with PIAS3 (right) in 293T cells. (g) Effects of PIAS3, Smad3 MH2 deletion, and Smad3C-terminal mutation on STAT3-induced activation of the Rorc promoter and the Il17a promoter constructs transfected in Th17 cells were determined by luciferase assay. (h) Binding of Smad3 (white) and PIAS3 (black) to the Rorc and the Il17a promoter regions in Th17 cells was determined by ChIP (differential occupancy fold changes). A representative of six (a), three (b, f, g), four (c, d) or two (e, h) independent experiments is shown. Each experiment (g, h) was performed in triplicate (n = 3). Data are mean + s.d. or mean + s.d. with P values (e, unpaired Student’s t-test).
Figure 15 TGF-β R-Smads do not interact with STAT5 in Th17 cells.
PLA shows no close proximity between Smad2/3 and STAT5 in Th17 cells (scale bar: 10 µm). Data are from one experiment representative of three independent experiments.
36
Figure 16 TGF-β R-Smads show close proximity with Smad4 or RORγt in Th17 cells.
PLA shows the endogenous close proximity between Smad2-Smad4, pSmad2C-Smad4, Smad3-Smad4,
pSmad3C-Smad4, Smad2-RORγt, and Smad3-RORγtin Th17 cells. PLA signals were quantified using
BlobFinder software (scale bars: 10 µm, nucleus: black, cytoplasm: white, n = 10 fields). Data are from one experiment representative of three independent experiments. Data are mean + s.d.
Figure 17 Smad3 MH2 domain interacts with STAT3.
Interactions of Smad3 or various Smad3 mutants and STAT3 in 293T cells were determined by immunoprecipitation. Data are from one experiment representative of three independent experiments.
37
Figure 18 C-terminally phosphorylated Smad3 does not bind to the PIAS3/Smad3-binding sites in the Rorc and Il17a proximal promoter regions in Th17 cells.
ChIP with the antibody against pSmad3C shows that pSmad3C does not bind to the PIAS3/Smad3-binding sites in the Rorc and Il17a proximal promoter regions of Th17 cells. Data are from one experiment representative of two independent experiments. Each experiment was performed in triplicate (n = 3). Data are mean + s.d.
Figure 19 PIAS3 is required for Smad3 to bind to the Rorc and the Il17a promoter regions. (a) PIAS3 mRNA levels in Th17 cells transduced with the control siRNA or PIAS3 siRNA were
confirmed by quantitative RT-PCR. (b) Flow cytometry analyses of IL-17A+RORγt+CD4+ T cells
transduced with control siRNA, PIAS3 siRNA or PIAS3 in Th17-polarizing condition. (c) ChIP analysis of Th17 cells transduced with control siRNA or PIAS3 siRNA with the antibodies against Smad2 and Smad3. One experiment was performed in triplicate (n = 3). Data are mean + s.d.
38
ERK phosphorylates Smad2 linker in Th17 differentiation
Previous studies have paid attention to C-terminal phosphorylation of R-Smads as TGF-β signaling mediators in Th17 differentiation (Xiao S et al, 2008; Martinez GJ et al, 2009; Lu L et al, 2010; Martinez GJ et al, 2010; Malhotra N et al, 2010; Takimoto T et al, 2010). However, pSmad2L (Ser255) and unphosphorylated Smad3 are not involved in the canonical C-terminally phosphorylated R-Smad/Smad4-mediated TGF-β signaling. Three clustered serine residues in the linker regions of Smad2 (Ser245/250/255) are the phosphorylation sites for MAPKs (ERK, JNK, and p38) (Kretzschmar M et al, 1999; Massague J et al, 2003; Wrighton KH et al, 2009; Heldin CH et al, 2012; Matsuzaki K et al, 2013). Because MAPKs are shared by TGF-β, IL-6, and TCR, I sought to identify the MAPK responsible for Smad2 linker phosphorylation in Th17 differentiation.
Signal intensities of TGF-β, IL-6, and TCR have been reported to correlate with the extent of Th17 differentiation (Veldhoen M et al, 2006; Manel N et al, 2008; Hirahara K et al, 2010). Therefore, I treated
CD4+ T cells under Th17-polarizing condition with various concentrations of TGF-β, IL-6, and anti-CD3
antibody. I confirmed that higher doses of TGF-β1, anti-CD3 antibody, and IL-6 induced more Th17
differentiation (Fig. 20a, 21a and 22a). Percentages of IL-17A+RORγt+CD4+ T cells were directly
proportional to phosphorylation of Smad2L (Fig. 20b, 21b and 22b) and ERK, but not to phosphorylation of JNK or p38 (Fig. 20c, 23 and 24).
To confirm whether TβRI-mediated phosphorylation of Smad2L is required for Th17 differentiation, I
treated CD4+ T cells under Th17-polarizing condition with specific inhibitors against TβRI (Yoon JH et al,
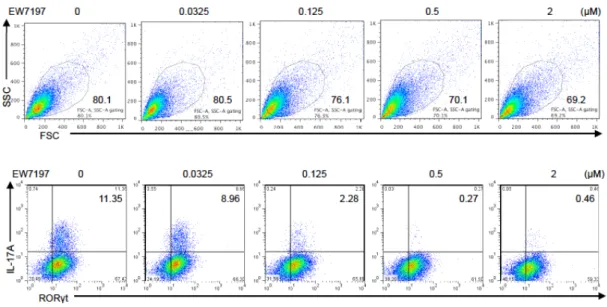
2013) at the doses that maintain cell viability (Fig. 25). A potent selective ATP-competitive inhibitor of TβRI kinase (activin receptor-like kinase5: ALK5), EW-7197 (Yoon JH et al, 2013; Jin CH et al, 2014) completely suppressed Th17 differentiation at the dose of 0.5 mM (Fig. 20d). Treatment with EW-7197 suppressed pSmad2L (Fig. 20e) and phosphorylation of ERK, but not phosphorylation of JNK and p38 (Fig. 20f and Fig. 26). One of the prototype ALK5 inhibitors, SB-505124 inhibits TGF-β-induced activation of MAPKs without altering ALK5-independent MAP kinase pathways (DaCosta Byfield S et al, 2004). A more highly selective ALK5 inhibitor, EW-7197 does not directly inhibit MEK1 and ERK1 (Jin CH et al, 2014). Therefore, inhibitory effect of EW-7197 on ERK phosphorylation is ALK5-specific. Culture media containing IL-6, IL-23, and IL-1β is sufficient to induce Th17 in the absence of TGF-β (Ghoreschi K et al, 2010). However, EW-7197 inhibited, whereas TGF-β1 enhanced Th17 differentiation along with ERK phosphorylation even in this culture condition (Fig. 27). These results suggest that TGF-β-TβRI signal phosphorylates ERK and pSmad2L in Th17 cells.
To confirm whether ERK-mediated phosphorylation of Smad2L is required for Th17 differentiation, I
next treated CD4+ T cells under Th17-polarizing condition with specific inhibitors against MAPKs at the
doses that maintain cell viability (Fig. 28 and 29). A MEK inhibitor: PD98059 suppressed Th17 differentiation in a dose dependent manner (Fig. 20g and 28), whereas a JNK inhibitor: SP600125 or p38 inhibitor: SB203580 did not affect Th17 differentiation (Fig. 29). PD98059 showed the similar effects
39
with EW-7197 on pSmad2L (Fig. 20h). Specific inhibition of MAP kinase by the corresponding inhibitor was confirmed (Fig. 30). Taken together, ERK-mediated Smad2 linker phosphorylation is responsible for Th17 differentiation and the concentrations of TGF-β, TCR, and IL-6 determine the intensities of Smad2 linker phosphorylation and the extent of Th17 differentiation.
40
Purified CD4+ T cells were activated under Th17-polarizing condition with the indicated doses of TGF-β1
and plate-coated anti-CD3 antibody, or small molecule inhibitors (EW-7197: ALK5 inhibitor, PD98059:
MEK inhibitor) for 3 days. (a) Flow cytometry analyses of IL-17A+RORγt+CD4+ T cells treated with
TGF-β1 and plate-coated anti-CD3 antibody. (b) Endogenous expression of pSmad2L in Th17 cells treated with TGF-β1 and plate-coated anti-CD3 antibody was determined by PLA. (c) Flow cytometry analyses of phospho-ERK in Th17 cells treated with TGF-β1 and plate-coated anti-CD3 antibody. (d)
Flow cytometry analyses of IL-17A+RORγt+CD4+ T cells treated with EW-7197. (e) Endogenous
expression of pSmad2L in Th17 cells treated with EW-7197 was determined by PLA. (f) Flow cytometry
analyses of phospho-ERK in TH17 cells treated with EW-7197. (g) Flow cytometry analyses of
IL-17A+RORγt+CD4+ T cells treated with PD98059. (h) Endogenous expression of pSmad2L in Th17
cells treated with PD98059 was determined by PLA. The values of mean fluorescence intensity (MFI) are shown in histograms. PLA signals (b, e, h) were quantified using BlobFinder software (scale bars: 10 µm, nucleus: black, cytoplasm: white, n = 10 fields). Data are representative of two (a-h) independent experiments. Data are mean + s.d.
Figure 21 Strength of TGF-β and TCR signals correlate with Th17 differentiation and pSmad2L.
Purified CD4+ T cells were activated under Th17-polarizing condition with the indicated doses of TGF-β
and plate-coated anti-CD3 for 3 days. (a) Percentages of IL-17A+RORγt+CD4+ T cells determined by
41
quantified using BlobFinder software (nucleus: black, cytoplasm: white, n = 10 fields). Data are from one experiment representative of two independent experiments. Data are mean + s.d.
Figure 22 IL-6 doses correlate with Th17 differentiation.
Purified CD4+ T cells were activated under Th17-polarizing condition with the indicated doses of IL-6 for
3 days. (a) Flow cytometry analyses of IL-17A+RORγt+CD4+ T cells. (b) Expression of pSmad2L in
CD4+ T cells determined by PLA. PLA signals were quantified using BlobFinder software (scale bars: 10
µm, nucleus: black, cytoplasm: white, n = 10 fields). Data are from one experiment representative of two independent experiments. Data are mean + s.d.
42
Figure 23 Strength of TGF-β and TCR signals correlate with ERK phosphorylation.
Purified CD4+ T cells were activated under Th17-polarizing condition with the indicated doses of TGF-β,
and plate-coated anti-CD3 for 3 days. Flow cytometry analyses of phospho-ERK, phospho-JNK, and
phospho-p38 in RORγt+CD4+ gate. Graphs show mean fluorescence intensity (MFI). Data are from one
43
Figure 24 High doses IL-6 enhance ERK phosphorylation.
Purified CD4+ T cells were activated under Th17-polarizing condition with the indicated doses of IL-6 for
3 days. Flow cytometry analyses of phospho-ERK, phospho-JNK, and phospho-p38 in RORγt+CD4+ gate.
Graphs show mean fluorescence intensity (MFI). Data are from one experiment representative of two independent experiments.
Figure 25 Viability and Th17 differentiation of CD4+ T cells treated with ALK5 inhibitor,
EW-7197.
Purified CD4+ T cells were activated under Th17-polarizing condition with the indicated doses of
EW-7197 for 3 days. Flow cytometry analyses of FSC/SSC and IL-17A+RORγt+CD4+ T cells. Data are