in silico analysis of gene expression dynamics
during human iPS cell generation
その他のタイトル
ヒトiPS細胞形成過程における遺伝子発現変動の生
物情報学解析
学位授与大学
筑波大学 (University of Tsukuba)
学位授与年度
2018
報告番号
12102甲第8770号
URL
http://doi.org/10.15068/00156446
in silico analysis of gene expression dynamics
during human iPS cell generation
ヒト iPS 細胞形成過程における遺伝子発現変動の生物情報学解析
2017
筑波大学グローバル教育院
School of Integrative and Global Majors (SIGMA) in University of
Tsukuba
Ph.D. program in Human Biology
1
Table of Contents
Abstract ... 2
Chapter 1: Introduction ... 5
1-1: Overview of human iPSCs and their relation to Human Biology ... 5
1-2: Mechanisms of reprogramming somatic cells into iPSCs ... 10
Chapter 2: Materials and Methods ... 17
2-1: Microarray data ... 17
2-2: Data processing ... 17
2-3: Selection of dynamically expressed genes ... 18
2-4: Transcription factor activity inference ... 19
2-5: Principal component analysis (PCA) and Hierarchical Clustering Analysis (HCA) ... 26
2-6: Pathway, Gene Ontology (GO), and Protein-protein Interaction (PPI) Enrichment Analysis 27 Chapter 3: Results ... 31
3-1: Three distinct transcriptomic states exist during cellular reprogramming in various cell types. ... 31
3-2: Identification of common gene expression patterns with distinct functions during reprogramming ... 37
3-3: TF influence drastically changes between the mid phase and the late phase ... 48
Chapter 4: Discussion ... 52
4-1: Maturation might be the roadblock in the reprogramming of various somatic cell types into hiPSCs ... 52
4-2: Comparison of the results with previous studies ... 54
4-3: Comparison of the reprogramming processes in mice and humans ... 55
4-4: A possible population selection in maturation ... 57
Acknowledgements ... 61
2
Abstract
Background
Human induced pluripotent stem cells (hiPSCs), which are derived by introducing
reprogramming factors, such as OCT4, SOX2, KLF4, and MYC (OSKM), into somatic
cells, have revolutionized not only stem cell biology but also clinical medicine. In the
clinic, various types of cells, including monocytes, adipocytes, and fibroblasts, can be
used for hiPSC generation, which suggests that there may be a common reprogramming
route regardless of somatic cell type. A recent study suggests that the maturation step,
the reprogramming phase in which pluripotency genes begin to be expressed, is the
main roadblock for reprogramming hiPSCs from human dermal fibroblasts (HDFs).
Therefore, I investigated whether a common reprogramming route exists across various
human cell types and whether the maturation step is the major barrier to reprogramming
in various cell types.
Results
To identify common reprogramming routes for hiPSC generation, I analyzed
time-course microarrays containing gene expression data from 5 human somatic cell lines,
3
HAs (Human Astrocytes), NHBEs (Normal Human Bronchial Epithelial cells) and
PrECs (Prostate Epithelial Cells). I identified 3615 genes that underwent dynamic
expression changes during the reprogramming process. I evaluated the overall similarity
between samples using principal component analysis and hierarchical clustering. The
results indicated that there were 3 distinct transcriptomic phases following induction of
OSKM reprogramming factors: an early phase between days 0 and 3, a mid phase
between days 7 and 15, and a late phase encompassing days 20 and on. The greatest
phase-to-phase differences were found between the mid and late phases. To study the
molecular events that take place during reprogramming, I categorized the 3615 genes
into 5 separate groups according to their gene expression patterns during
reprogramming. Functional annotation of the gene lists in each group revealed common
reprogramming events among the 5 cell types: mesenchymal-epithelial transition
between days 0 and 3, transient up-regulation of epidermis-related genes between days
7 and 15, and up-regulation of cell cycle and pluripotency genes beginning at day 20.
Furthermore, because TFs can regulate cell fate by controlling target gene expression, I
focused on transcription factor activity at each time point during the reprogramming
process and identified a major transition between days 15 and 20, regardless of cell
4
maturation phase for HDF reprogramming, my results imply that the maturation step is
a major roadblock in the reprogramming process across multiple cell types.
Conclusions
This study suggests that the human cellular reprogramming process of multiple different
cell types can be separated into 3 different phases following OSKM induction: an early
phase between days 0 and 3, a mid phase between days 7 and 15, and a late phase
beginning at day 20. As the late phase exhibited the greatest dissimilarity based on
transcriptome and transcription factor activity analysis, the transition from the mid
phase to the late phase is likely to be a common major roadblock during human cellular
reprogramming. A better understanding of the molecular mechanisms of this transition
5
Chapter 1: Introduction
1-1: Overview of human iPSCs and their relation to Human
Biology
The human body is estimated to contain approximately 37 trillion cells (Bianconi et al.,
2013) and renewal of these cells is essential to maintain a stable internal environment.
Although the human body is able to replace injured skin and vasculature, entire organs
cannot be regenerated. Regenerative medicine aims to compensate for damaged organs
by replacing them with healthy cells, tissues, and organs from patients. Current
regenerative medicine techniques involve organ transplantations and artificial internal
organs, however these methods could present significant problems, including transplant
rejection and donor shortages.
Along with the development of stem cell biology, regenerative medicine using stem
cells (including somatic stem cells and embryonic stem cells (ESCs)) has attracted
attention as a solution to these problems. Mouse and human ESCs were first generated
in 1981 and 1998, respectively (Evans and Kaufman, 1981; Martin, 1981; Thomson et
al., 1998). Since ESCs theoretically are able to differentiate into all cell types in the
6
valuable for the treatment of various diseases and trauma, including diabetes,
Parkinson's disease, and spinal cord injury. However, because it is impossible to
establish ESCs and ESC-derived somatic cells with the same genetic information as that
of the recipient, administration of immunosuppressive drugs is necessary to avoid
transplant rejection. In addition, ethical problems remain, as the establishment of ESCs
involves the sacrifice of fertilized eggs.
One way to solve these problems is to generate pluripotent stem cells, such as ESCs,
from the patient's own cells. The phenomenon whereby differentiated cells, including
skin cells, acquire ESC-like pluripotency is called reprogramming, and several methods
of establishing this pluripotency have previously been reported.
Representative pluripotency-establishing methods include nuclear transplantation and
cell fusion. Nuclear transplantation involves the removal of the nucleus of an
unfertilized egg and the subsequent transplantation of the nucleus of a somatic cell into
the enucleated unfertilized egg. Since the nuclear transplanted fertilized egg contains a
somatic cell-derived nucleus, it has the genetic information of the somatic cell. Thus, it
is possible to generate stem cells containing a recipient’s genetic information. Dolly, the cloned sheep, was generated in 1997 by transplanting the nucleus of a mammary gland
7
cell into an enucleated unfertilized egg (Wilmut et al., 1997). Meanwhile, cell fusion is
a phenomenon whereby a stimulated ESC is fused with a somatic cell; the resulting
cells display the properties of ESCs in both mice and humans (Cowan et al., 2005; Tada
et al., 2001). However, since pluripotent cells obtained by cell fusion contain
ESC-derived genetic information, transplantation of these cells could cause rejection by the
recipient. To solve this problem, research aiming to remove ESC-derived genetic
information is actively being conducted (Matsumura et al., 2007; Pralong et al., 2005).
Although the biotechnology has been developed to the point where both nuclear
transplantation and cell fusion technology can successfully generate pluripotent stem
cells, ethical problems remain because these techniques require unfertilized eggs and
ESCs, respectively.
Meanwhile, somatic stem cells can be collected directly from patients, thus no ethical
problems or risk of transplant rejection limit their clinical application. However, they
are inferior to ESCs in terms of differentiation and proliferation ability. Typical
examples of somatic stem cells include hematopoietic stem cells (HSCs) in the bone
marrow and umbilical cord blood. HSCs can differentiate into various cells of the
circulatory system. In addition, mesenchymal stem cells residing in the bone marrow
8
have certain advantages, it is difficult to prepare a large enough number of cells because
their proliferative capacity is limited and it can be difficult to collect enough of the
somatic stem cells by biopsy. Therefore, there is a need to establish patient-derived
pluripotent stem cells that have neither rejection nor ethical problems but display the
high proliferation and pluripotency characteristic of ESCs.
Mouse and human induced pluripotent stem cells (iPSCs) were first established in 2006
and 2007, respectively (Takahashi and Yamanaka, 2006; Takahashi et al., 2007; Yu et
al., 2007). iPSCs can be generated from somatic cells via induction of four transcription
factors (Oct3/4, Sox2, Klf4, c-Myc, called OSKM). OSKM-induced somatic cells
change their morphology and acquire ESC-like pluripotency. The discovery of iPSCs
has revolutionized not only stem cell biology but also clinical medicine. Since human
iPSCs (hiPSCs) were first established in 2007 (Takahashi et al., 2007; Yu et al., 2007),
they have enabled new strategies for regenerative medicine, research into disease
mechanisms, and an understanding of cell fate. In particular, the differentiation of
hiPSCs into target cell types plays a pivotal role in accelerating clinical applications for
the treatment of diseases with patient-derived hiPSCs. Current transplantation methods
require cells or tissues from a donor; however, hiPSCs do not require any sacrifice.
9
The establishment of hiPSCs has been reported by various research groups. The first
major somatic cells used to generate hiPSCs were newborn fibroblasts and adult skin
cells (Lowry et al., 2008; Park et al., 2008; Takahashi et al., 2007; Yu et al., 2007).
Although fibroblasts can be relatively easily harvested by biopsy, hiPSCs sometimes
cannot be established from these cells due to their decreased proliferative capacity and
cellular senescence (Park et al., 2008). Therefore, researchers have aimed to generate
hiPSCs from other somatic cells. Currently, hiPSCs have been derived from various
tissues, including lung-derived fibroblasts (Park et al., 2008; Yu et al., 2007),
adipocytes (Aoki et al., 2010), epithelial cells (Aasen et al., 2008; Ono et al., 2012;
Zhou et al., 2012) and peripheral blood cells (Loh et al., 2009; Staerk et al., 2010).
However, one drawback of hiPSCs is that it takes approximately 1-2 months to generate
patient-derived hiPSCs. Although some chronic diseases, such as Parkinson’s disease
and age-related macular degeneration, can be treated with patient-derived hiPSCs,
clinical treatment of acute diseases, including acute ischemic cardiomyopathy and
cerebral stroke, is difficult due to the time required for reprogramming. To overcome
this problem, the iPSC Bank has been established (McKernan and Watt, 2013).
Allotransplantation of hiPSCs is possible when the types of human leukocyte antigen
10
various HLA types are stocked, these cells could be readily available for transplantation.
In Japan, the world’s first allotransplantation of hiPSCs to treat age-related macular degeneration was conducted in 2017 using a stockpile of hiPSCs at Kyoto University.
The iPSC Bank could make the application of hiPSCs for regenerative medicine rapid,
safe, and cost-friendly. However, a recent study indicated that approximately 30% of
stocked hiPSCs still might be rejected by natural killer T cells (Ichise et al., 2017).
Therefore, the generation of patient-specific iPSCs remains of the utmost importance.
This will require a better understanding of reprogramming mechanisms leading to the
establishment of an optimal method for preparing hiPSCs and an improvement in
production efficiency.
1-2: Mechanisms of reprogramming somatic cells into iPSCs
Compared to the progress made in the clinic, the understanding of the molecular
mechanisms underlying cellular reprogramming is significantly lagging. However,
some mechanistic insights have been acquired and I will discuss them here.
Previous studies involving time-course gene expression analyses during reprogramming
were mostly performed using mouse embryonic fibroblasts (MEFs). These studies
11
phases: initiation, maturation, and stabilization (David and Polo, 2014; Golipour et al.,
2012; Samavarchi-Tehrani et al., 2010). Cellular reprogramming begins with the
mesenchymal-to-epithelial transition (MET), one of the hallmark events of initiation.
MET occurs within a few days of OSKM induction (David and Polo, 2014; Li et al.,
2010). It is well known that induction of MET initiates iPSC reprogramming and that
inhibition of MET suppresses reprogramming. Among the OSKM factors, Sox2
suppresses expression of Snail, an EMT inducer (Liu et al., 2013), and Klf4 induces
expression of E-cadherin, thus promoting MET (Li et al., 2010). In addition, Glis1, a
Gli-like transcription factor, can substitute for c-Myc and can enhance the expression of
forkhead box A2 (Foxa2), which inhibits epithelial-mesenchymal transition (EMT).
Thus, Glis1 might stimulate somatic cell reprogramming by promoting MET (Maekawa
et al., 2011). In addition, TGF-β signaling enhances EMT by activating EMT-related
genes, mediating the disassembly of junctional complexes, and reorganizing the cell
cytoskeleton (Thiery and Sleeman, 2006). Several groups have demonstrated the ability
of TGF-β inhibition to enhance the initiation stage of somatic cell reprogramming in
both mice (Maherali and Hochedlinger, 2009; Shi et al., 2008) and humans (Lin et al.,
2009). This observation is supported by the finding that addition of recombinant TGF-β
12
action of TGF-β signaling, which then prevents MET. Furthermore, various TGF-β
inhibitors have been used to promote reprogramming, including A-83-01 (Li et al.,
2010; Zhu et al., 2010), E616452 (also known as RepSox) (Hou et al., 2013; Maherali
and Hochedlinger, 2009) and SB431542 (Lin et al., 2009). Together, these results
indicate that MET plays a critical role in early cellular reprogramming.
Maturation is described as the phase during which pluripotency genes, such as
endogenous Oct4 (not exogenously induced Oct4), Nanog, and Sall4, begin to be
expressed in an exogenous OSKM-dependent manner (David and Polo, 2014; Golipour
et al., 2012; Samavarchi-Tehrani et al., 2010). This intermediate phase can play
important roles in acquiring stable pluripotency. In the maturation phase, several
pluripotency-related genes are gradually expressed. Fbxo15, Sall4, and endogenous
Oct4 are the first markers to be detected; this is followed by the expression of Nanog
and Esrrb in mouse iPSCs (Buganim et al., 2012; David and Polo, 2014; Golipour et al.,
2012; Polo et al., 2012). Although the underlying molecular mechanisms of maturation
largely remain unknown, maturation genes are known to be good markers of
reprogramming. In addition, the epigenetic barriers involved in maturation have actively
been studied. One study showed that over-expression of C/EBPα leads to the expression
13
reprogramming efficiency in mouse B cells (Di Stefano et al., 2014). Furthermore, the
expression pattern of pluripotency genes during B cell reprogramming was highly
correlated to the pattern observed during MEF reprogramming (Di Stefano et al., 2014).
This study suggested that the maturation process was conserved across cell types.
Finally, the cells that are able to transition to the stabilization phase gain
transgene-independent stem cell properties through stable expression of pluripotency genes and
become iPSCs (Brambrink et al., 2008; David and Polo, 2014; Golipour et al., 2012;
Maekawa et al., 2011; Samavarchi-Tehrani et al., 2010).
Compared to reprogramming systems in mouse cells, some hiPSCs reprogramming
events differ slightly in terms of characteristics and timing, although hiPSCs can be
generated by the induction of the same transcription factors (Teshigawara et al., 2017).
For example, MET occurs relatively later in the human reprogramming process, when
exogenous OSKM becomes suppressed and endogenous OCT4 starts to appear
(Teshigawara et al., 2016). In addition, the pluripotent states are different in human and
mouse iPSCs, called 'primed' and 'naïve', respectively (Chia et al., 2010; Hanna et al.,
2010). Naïve stem cells, such as mouse ESCs, have the ability to contribute to chimera
14
ability. hiPSC colony morphology and gene expression profiles are more similar to
those of mouse epiblast stem cells (Nichols and Smith, 2009). These differences
between mouse and human iPSC generation suggest that there might be some distinct
reprogramming events. Because the understanding of the human cell reprogramming
process is still limited relative to that of mice, it is of the utmost importance to explore
the reprogramming process in human cells as comprehensively as it has been studied in
mouse cells.
Although current insights into the cellular reprogramming of hiPSCs are confined to
fibroblasts, hiPSCs have been established from multiple somatic cell types, including
dermal fibroblasts (Lowry et al., 2008; Park et al., 2008; Takahashi et al., 2007; Yu et
al., 2007), adipocytes (Aoki et al., 2010), epithelial cells (Aasen et al., 2008; Ono et al.,
2012; Zhou et al., 2012) and peripheral blood cells (Loh et al., 2009)). Notably, a recent
study reported that all five types of OSKM-induced human somatic cells (fibroblasts,
adipose-derived stem cells, astrocytes, bronchial epithelial cells and prostate epithelial
cells) exhibited transiently similar transcriptome profiles that resemble a primitive
streak (Takahashi et al., 2014). The facts that hiPSCs can be generated from various
types of cells and that different types of reprogramming cells have transiently similar
15
exist across multiple cell types. Furthermore, a recent study indicated that the
maturation stage, which occurs between days 7 and 15 following OSKM transduction in
human dermal fibroblasts (HDFs) and when the expression of pluripotency genes, such
as OCT4, NANOG, and SALL4, begins, is a major roadblock in the reprogramming
process (Tanabe et al., 2013). Based on these results, I aimed to detect a common
reprogramming process in various human cell types and to evaluate whether maturation
is a common roadblock in multiple cell types.
For this purpose, I extracted 3615 dynamically expressed genes from time course gene
expression data across five different human somatic cell types undergoing
reprogramming (Takahashi et al., 2014). Next, I divided these genes into five clusters
according to their gene expression patterns and functionally characterized each cluster.
Lastly, I inferred transcription factor (TF) activity during the reprogramming process.
The results obtained in this work suggested that reprogramming was consistently driven
through three phases in all five-cell types, including fibroblasts, adipose-derived stem
cells, astrocytes, bronchial epithelial cells and prostate epithelial cells. Furthermore,
maturation is suggested to be the common roadblock in reprogramming in all five cell
17
Chapter 2: Materials and Methods
2-1: Microarray data
To identify conserved genes with dynamic expression from various reprogrammed
human cell types, I used a dataset from the Gene Expression Omnibus under the
accession number GSE50206
(https://www.ncbi.nlm.nih.gov/geo/query/acc.cgi?acc=GSE50206) (Takahashi et al.,
2014). This dataset contains time-course microarray data of cellular reprogramming in
five human somatic cell types - HDFs (Human Dermal Fibroblasts), ASCs
(Adipose-derived Stem Cells), HAs (Human Astrocytes), NHBEs (Normal Human Bronchial
Epithelial cells) and PrECs (Prostate Epithelial Cells) - and two stem cells types -
hiPSCs and human ESCs (hESCs) (Figure 1a).
2-2: Data processing
Raw microarray signals (gProcessedSignal) were processed using log2 transformation
and quantile normalization to compare samples using the following statistical analysis.
Log-transformed signals were used so that signal distributions were close to a normal
distribution because many statistical methods are available for signals that follow a
18
to make the signals comparable across samples. I used the limma package for quantile
normalization in R using Bioconductor (Ritchie et al., 2015).
2-3: Selection of dynamically expressed genes
To identify genes that were dynamically expressed across all cell types during the
reprogramming process, I used the maSigPro package (Conesa et al., 2006) on each cell
type and screened genes that showed significant differences among all five cell types
(P-value < 0.01, FDR < 0.05, R2 > 0.6). In detail, I first fitted a regression model to
discover probe sets with significant differential expression during reprogramming. The
null hypothesis was that the means of the microarray signals at each time point were all
equal. Significant genes were selected using the P-value associated with the F-Statistic
in the linear regression model. This P-value was corrected for multiple comparisons by
applying the linear step-up false discovery rate (FDR) procedure (Reiner et al., 2003).
After identifying models with statistically significant genes, the regression coefficients
were used to identify the conditions for which genes showed statistically significant
changes during reprogramming. To do this, maSigPro fitted three-dimensional
polynomial equations to explain each gene expression patterns. Lastly, I extracted genes
19
value indicated how well a cubic equation was fitted to the gene expression patterns. By
using the R-squared value, I identified genes with expression patterns that were well
fitted by a cubic equation and discarded genes and outliers with irregular gene
expression profiles. Consequently, this filtration process yielded 3615 extracted genes
(Figure. 1b). When multiple probes annotated the same genes, the probe signals were
averaged.
2-4: Transcription factor activity inference
After extracting 3615 genes from all five cell types undergoing reprogramming, I
applied the CoRegNet package (Nicolle et al., 2015) to infer transcription factor (TF)
activity during the reprogramming process. The CoRegNet infers cooperative TF
networks and scores the influence of specific TFs with the h-LICORN (hybrid-learning
cooperative regulation networks) algorithm by using TF and target gene expression
profiles (Figure 1b) (Chebil et al., 2014; Elati et al., 2007).
Specifically, the temporal gene expression data included 5 samples and 100 genes.
CoRegNet categorized these genes into TFs and non-TFs using a list of 2020 human
transcription factors from the FANTOM consortium (Ravasi et al., 2010). Let us
20
levels to ternary values: −1 (under-expressed), 0 (no change) or 1 (over-expressed). For instance, the following table details example gene expression data, including genes
1-100 across 5 samples.
sample1 sample2 sample3 sample4 sample5
gene1 4.085179 2.502032 5.434952 6.783058 3.313376
gene2 3.453015 3.16476 2.911037 2.938859 3.027613
...
gene100 7.478364 8.680674 6.118773 6.257344 6.397665
Then, each gene expression signal is normalized (raw signal - average signal).
sample1 sample2 sample3 sample4 sample5
gene1 -0.33854 -1.92168737 1.0112323 2.359339 -1.11034368
gene2 0.3539582 0.06570359 -0.1880199 -0.160198 -0.07144386
...
gene100 0.4917998 1.69410985 -0.8677907 -0.7292201 -0.58889888
The standard deviation (SD) of all normalized signals is 1.087876. Then, discrete values
are obtained by defining the normalized values as 1 (if signal > SD), 1 (if signal <
21
sample1 sample2 sample3 sample4 sample5
gene1 0 -1 0 1 -1
gene2 -1 0 1 0 -1
...
gene100 0 1 0 0 0
After discretization, CoRegNet generates 2 tables based on discrete TF expression
values. Here is an example table that lists discretized TF expression values.
sample1 sample2 sample3
TF1 -1 0 0
TF2 0 1 1
TF3 -1 0 1
CoRegNet generates the following 2 tables. The left table contains the values 1 (discrete
values equal to 1) and 0 (all other values). The right table contains the values -1
(discrete values equal to -1) and 0 (all other values).
sample1 sample2 sample3
22
TF1 0 0 0 TF1 -1 0 0
TF2 0 1 1 TF2 0 0 0
TF3 0 0 1 TF3 -1 0 0
To identify the non-TF genes that could be regulated by TFs, CoRegNet uses
association analysis. For instance, when extracting samples where the expression value
of non-TF1 is not equal to 0, associations can be identified as follows.
sample1 sample2 sample3 sample4 sample5
non-TF1 1 1 0 -1 -1 TF1 -1 0 0 0 1 TF2 0 1 1 -1 0 TF3 -1 0 1 0 1 sample1 {TF1-TF3 (rep)} sample2 {TF2 (act)} sample4 {TF2 (act)} sample5 {TF1-TF3 (rep)}
{TF (act)} indicates that the discretized expression of TFs is the same as the expression
23
the expression of non-TFs. Support values are calculated as (number of rules)/(number
of samples), which indicates the frequency of the rules. When calculating each support,
{TF1 - TF3 (rep)} = 2(the numbers of rules)/4 (the numbers of samples) = 0.5 and {TF2
(act)} = 2/4 = 0.5. When the threshold of support is set to 0.33, both {TF1 - TF3 (rep)}
and {TF2 (act)} can be identified as the candidate TFs whose expression levels are
positively or negatively correlated with the expression of non-TF1.
Finally, CoRegNet scores the TF influence. The TF influence is defined as a t-statistic,
which indicates the ratio of the sum of the gene expression values of non-TFs in 2
groups (act and rep). For example, when the expression levels of TF1 through
non-TF5 and their TFs are positively (act) or negatively (rep) correlated, as displayed in the
following first table, the influence of each TF in each sample can be calculated as
shown in the following second and third tables.
expression of sample1 expression of sample2 act rep non-TF1 10 30 {TF2} {TF1-TF3} non-TF2 20 5 {TF1} {TF2} non-TF3 30 10 {TF2-TF3} {TF2} non-TF4 40 30 {TF1} {TF3}
24
non-TF5 50 70 {TF3} {TF1}
sample1 act sample1 rep sample1
t-statistics (influence) {TF1} 20 (non-TF2), 40 (non-TF4) 10 (non-TF1), 50 (non-TF5) 0 {TF2} 10 (non-TF1), 30 (non-TF3) 20 (non-TF2), 30 (non-TF3) -0.44721 {TF3} 30 (non-TF3), 50 (non-TF5) 10 (non-TF1), 40 (non-TF4) 0.83205
sample2 act sample2 rep sample2
t-statistics (influence) {TF1} 5 (non-TF2), 30 (non-TF4) 30 (non-TF1), 70 (non-TF5) -1.378 {TF2} 30 (non-TF1), 10 (non-TF3) 5 (non-TF2), 10 (non-TF3) 1.2127 {TF3} 10 (non-TF3), 70 (non-TF5) 30 (non-TF1), 30 (non-TF4) 0.33333
For instance, the example indicates that the expression of TF1 in sample1 is positively
correlated to non-TF2 and non-TF4 and that the gene expression levels of non-TF2 and
non-TF4 are 20 and 40, respectively. On the other hand, the expression of TF1 in
sample1 is negatively correlated with that of non-TF1 and non-TF5, and the gene
25
(Welch's t-test) of these 2 groups ({20, 40} and {10, 50}) reports that the t-statistic
equals 0. This suggests that TF1 in sample1 does not play a role in the expression of
non-TFs because the positively and negatively correlated genes have the almost same
expression values.
sample1 act sample1 rep sample1
t-statistics (influence) {TF1} 20 (non-TF2), 40 (non-TF4) 10 (non-TF1), 50 (non-TF5) 0
The influence of TF1 in sample2 is -1.378. This means that sample2 displays greater
expression of genes that are negatively correlated with TF1.
sample2 act sample2 rep sample2
t-statistics (influence) {TF1} 5 (non-TF2), 30 (non-TF4) 30 (non-TF1), 70 (non-TF5) -1.378
In addition, the significance of these pairs of TFs and non-TFs was tested using Fisher’s
exact test to examine whether these TFs, such as {TF1} and {TF1-TF3}, have more
possible target genes than expected by chance (false discovery rate < 0.01 using the
26
that undergo temporal changes in expression during reprogramming and have more
possible target genes than expected by chance.
2-5: Principal component analysis (PCA) and Hierarchical
Clustering Analysis (HCA)
Microarray data have various variables, namely the expression values of each gene in
each sample. For example, the GPL14550 microarray platform that I used in this study
contains 22062 genes, which means that each sample has 22062 variables. PCA is a
method that can be used to summarize 22062 variables using just 2 or 3 variables and
enables the visualization of similarities between samples in 2 dimensional plots. PCA
constructs new X1, X2 … X22062 axes (principal component 1; PC1 and principal
component 2; PC2 … principal component 22062; PC22062) that summarize the 22062 variables. The new X1 axis is the line that maximizes the variation across variables. The
new X2 axis is the line that intersects the X1 axis at a right angle. In PCA, the
information content is defined by the variance of the data. When setting the total sum of
variances of the data on the X1, X2 … X22062 axes equal to 100, the X1 axis (PC1) contains
the 'variance of X1/100' information content and the X2 axis (PC2) contains the 'variance
27
using the X1 and X2 axes. Finally, PCA enables the location of each sample to be
displayed as a 2 dimensional plot by using the X1 axis (PC1) and the X2 axis (PC2) and
the coordinate point of a 2 dimensional plot indicates the similarities between samples
(Ringnér, 2008; Yeung and Ruzzo, 2001).
HCA is another method used to illustrate the similarities between samples. HCA
generates a distance matrix by using all 22062 gene expression values and makes a
cluster by calculating the distance between each sample. In contrast to PCA, HCA uses
all gene information, thus it is better able to quantitatively compare each sample.
However, there are many methods that can be used to calculate a distance matrix,
including Euclidean distance, cosine similarity, Pearson's correlation and clustering
using the group average method, complete linkage method, and Ward's method.
Because the results of HCA are highly dependent on the methods, HCA is not a robust
clustering method (Sturn et al., 2002).
2-6: Pathway, Gene Ontology (GO), and Protein-protein
Interaction (PPI) Enrichment Analysis
For functional annotation of gene sets, I used Metascape (http://metascape.org) to
28
Processes (Tripathi et al., 2015) enriched terms. The PPI network was constructed using
the BioGRID database (Chatr-Aryamontri et al., 2017; Stark et al., 2006). BioGRID
contains over 200,000 unique PPI and is both well maintained and frequently updated.
29
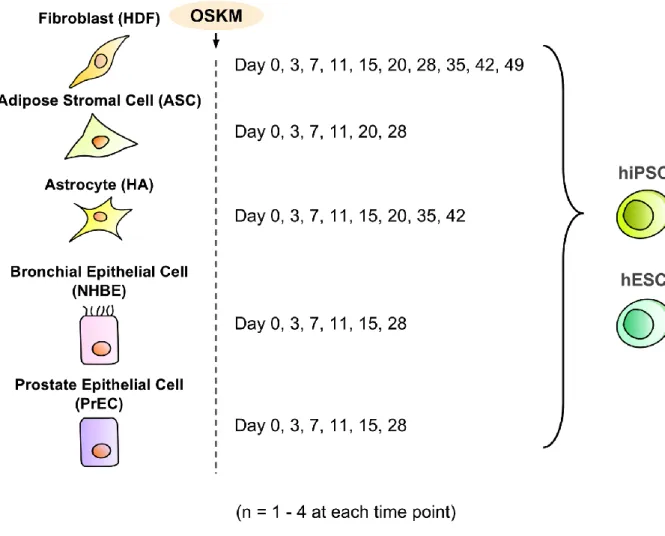
Figure 1a: Explanation of microarray samples
Microarray data used in this study were obtained from GSE50206 (Takahashi et al., 2014) and included reprogramming information from five human somatic cells and two stem cells. The majority of the data consists of 3 biological replicates, though ASC Day 20 and PrEC Day 28 have no replicates, PrEC Day 15 has 2 replicates, and HA Day 7 and NHBE Day 7 have 4 replicates.
30
Figure 1b: Experimental workflow.
(a) NANOG and GAPDH were typical examples of dynamically expressed and statically expressed genes, respectively, during reprogramming. The filtration method extracted NANOG and eliminated GAPDH. maSigPro, an R package, extracts genes that undergo temporal expression changes during reprogramming. (b) CoRegNet, an R package, identifies transcription factors that may regulate more genes than predicted by random selection. The main parameters are indicated in parentheses (See a detailed description in the Methods section).
31
Chapter 3: Results
3-1: Three distinct transcriptomic states exist during cellular
reprogramming in various cell types.
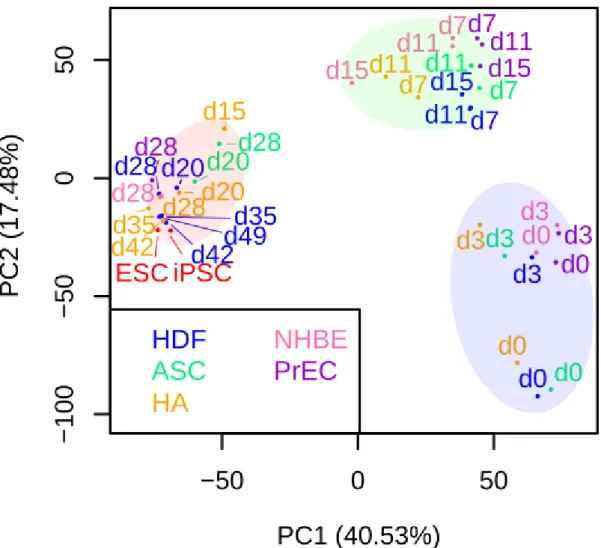
To analyze similarities among the cellular transcription profiles of each sample at each
time point during reprogramming, I performed principal component analysis (PCA) and
hierarchical clustering analysis (HCA) on 3615 genes. When I compared the extracted
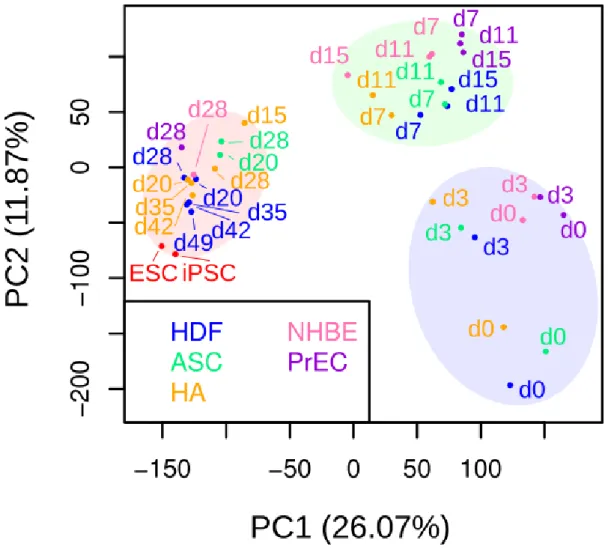
genes with all 22062 genes in the microarray, the reprogramming trajectory could be
easily traced by the extracted genes in the PCA (Figure 2a, c), supporting the technical
validation of gene extraction filtering methods. Furthermore, the gene filtering system
successfully increased the contribution ratio of principal component 1 (PC1) and
principal component 2 (PC2) from 26.07% and 11.87% to 40.53% and 17.48%,
respectively (Figure 2a, c).
According to the PCA and HCA results, the transcriptome evident during cellular
reprogramming could be broadly divided into three groups: an early phase between days
0 and 3, a mid phase between days 7 and 15, and a late phase beginning at day 20
(Figure 2a, b). Although human astrocytes at day 15 following OSKM induction (HA
32
human astrocytes can be induced into iPSCs in a highly efficient manner (Ruiz et al.,
2010). Notably, the results indicated that all reprogramming cell types exhibited
uniformly greater dissimilarities between the mid and late phases than between the early
33
Figure 2a: Principal component analysis of each sample using 3615 dynamically expressed genes indicated 3 distinct phases with a highly dissimilar late phase.
Each cell type was colored as follows: HDF (blue), ASC (green), HA (orange), NHBE (pink), PrEC (purple), hiPSC (red), and hESC (red). The numbers indicate the number of days between OSKM induction and RNA collection. The early, mid phase, and late phases are labeled in translucent blue, green, and red, respectively. PC stands for Principal Component and the numbers in parentheses indicate the percentage of information content. The information content of PCA is expressed as a variance. Thus, PC1 contains 40.53% of the total data variance. Considering that the PC1 axis has the largest amount of information, the coordinate points of each sample in the early and mid phasemid phases are located at almost the same position, however the points of samples in the late phase are clearly separated from the points in the early and mid phase. This suggested that samples in the late phase have the greatest transcriptomic dissimilarity.
34
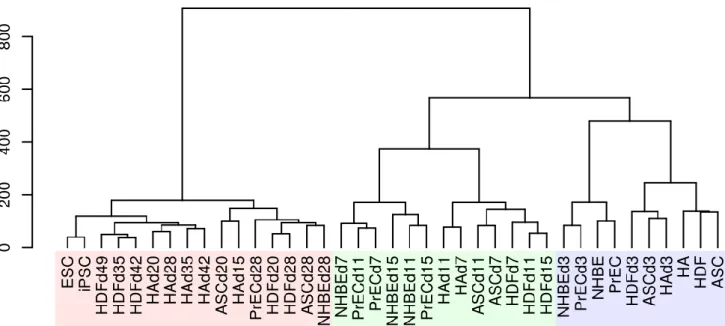
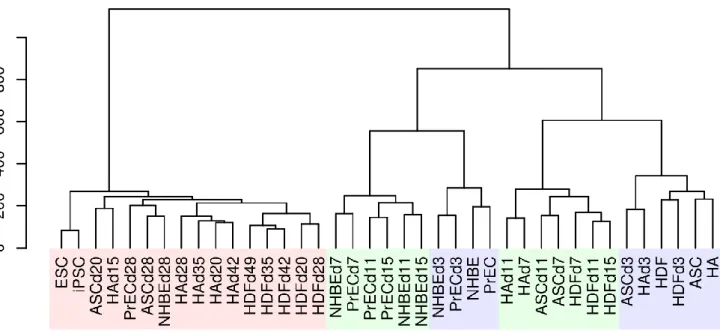
Figure 2b: Hierarchical cluster analysis of each sample using 3615 dynamically expressed genes also indicated 3 distinct phases and a highly dissimilar late phase.
The early, mid phase, and late phases are labeled in translucent blue, green, and red, respectively. The Y-axis indicates the degree of distance between each cluster.
35
Figure 2c: Principal component analysis of each sample using all 22062 genes in the GPL14550 microarray platform also showed 3 distinct phases and the dissimilarity of the late phase.
Each cell type was colored as follows: HDF (blue), ASC (green), HA (orange), NHBE (pink), PrEC (purple), hiPSC (red), and hESC (red). The numbers indicate the number of days between OSKM induction and RNA collection. The early, mid phase, and late phases are labeled in translucent blue, green, and red, respectively.
36
Figure 2d: Hierarchical cluster analysis of each sample using all 22062 genes in the GPL14550 microarray platform showed the dissimilarity of the late phase.
The early, mid phase, and late phases are labeled in translucent blue, green, and red, respectively. Because the set of 22062 genes contains cell-type specific genes, the HCA clustered the cell type-dependent genes in the early and mid phases.
37
3-2: Identification of common gene expression patterns with
distinct functions during reprogramming
I clustered 3615 genes into five groups based on their expression patterns and
performed functional annotations for each group.
The first cluster contained 816 genes that were more highly expressed in the early phase
and remained suppressed throughout the reprogramming process (Figure 3a). These
genes were mainly annotated as playing a role in extracellular matrix organization,
which could directly influence cell proliferation and differentiation (Hynes, 2009).
Specifically, the cluster included TGF-β family members (TGFB1, TGFB1I1, TGFB2,
TGFB3, TGFBI, TGFBR2, TGFBR3), and TGF-β-induced EMT markers (ZEB1,
SNAI2, and TWIST2). These genes have been reported to be negative regulators of
MET and are down-regulated by induction of exogenous Sox2, Oct4, and c-Myc during
MEF reprogramming (Li et al., 2010; Maherali and Hochedlinger, 2009). Thus, the
results suggest that reprogramming cells between days 0 and 3 are preparing for MET, a
prerequisite for the commencement of reprogramming and one of the hallmarks of
38
The second cluster included 536 genes that were highly expressed during the early and
mid phases but whose expression decreased in the late phase (Figure 3b). This cluster
was annotated as immune response-related genes, which might be caused by the
retroviral induction system used for exogenous OSKM expression. Because OSKM
transgenes were sustainably expressed by day 15 (Takahashi et al., 2014), and the
retroviral gene induction system is known to trigger an innate immune response (Jolly,
2011), maintained retrovirus might contribute to increased immune function in the early
and mid phases of reprogramming. Notably, suppression of the immune response by
supplementation with inhibitors of either B18R interferon or NFkB enhanced hiPSC
generation (Soria-Valles et al., 2015; Warren et al., 2010), indicating an inverse
correlation between the immune system and reprogramming efficiency. Therefore,
considering that the interferon-induced IFIT protein family was enriched in the early
phase from the first gene cluster analysis (Figure 3a), innate immune-related genes in
the first and second clusters may play an inhibitory role in cellular reprogramming,
especially when a retrovirus induction system is used.
The 394 genes in the third cluster had transiently up-regulated expression only in the
mid phase. These genes were enriched for hemidesmosome and epidermal
39
genes, such as SFN and KRT6A. A previous report demonstrated that these
epidermal-related genes were transiently up-regulated during the reprogramming of MEFs into
iPSCs (O’Malley et al., 2013). Given that the inhibition of these genes precedes the
activation of pluripotency genes in the late phase (O’Malley et al., 2013), the transitory
expression of epidermis-related genes could be an important feature of the mid phase in
both mice and humans.
The expression of the 929 genes in the fourth cluster was sharply up-regulated in the
late phase of reprogramming and these genes were annotated as trans-synaptic signaling
related genes (Figure. 3d). Interestingly, previous studies reported that human and
mouse neuronal stem cells (NSCs) could be reprogrammed by induction of OCT4 alone
because NSCs endogenously expresses Sox2, Klf4, and c-Myc (Kim et al., 2009a,
2009b), indicating a higher reprogramming efficiency in trans-synaptic enriched cell
types. Given that tissue-derived human neuronal progenitor cells were more closely
related to ESCs/iPSCs compared with other tissue-derived cells (Figure. 3g, f), it can be
speculated that NSCs would share similar gene profiles to the late phase of human
40
The genes in the fifth cluster gradually increased as reprogramming progressed (Figure
3e). They were highly enriched for cell cycle related genes, had especially dense
protein-protein interactions and contained members of the Cyclin (CCNA2, CCNB1,
CCNB2, CCND2, CCNE1, CCNI2) and CDK (CDK1, CDK18, CDKN3) families. This
is in agreement with a previous study that showed that hES/hiPS cells require high
proliferation rates for the acquisition and maintenance of pluripotency and self-renewal
(Ruiz et al., 2011). In addition, this result may indicate the possibility of selection
during reprogramming. In other words, a certain cell population that acquires high
proliferative ability might survive in the early and/or mid phase and might eventually
41
Figure. 3a: 816 genes with high expression in the early phase, including MET-related genes
The upper panel shows gene expression profiles in the cluster. The colors indicate different cell types. The middle panel is the result of gene enrichment analysis. GO and R-HSA indicate Gene Ontology and Reactome (Homo sapiens), respectively. The lower panel illustrates protein-protein interactions.
42
Figure. 3b: 536 genes with high expression in the early and mid phases, including innate immune response related genes.
The upper panel shows gene expression profiles in the cluster. The colors indicate different cell types. The middle panel is the result of gene enrichment analysis. GO and R-HSA indicate Gene Ontology and Reactome (Homo sapiens), respectively. The lower panel illustrates protein-protein interactions.
43
Figure. 3c: 394 genes with transient up-regulation in the mid phase were enriched for epidermis and hemidesmosome-related genes
The upper panel shows gene expression profiles in the cluster. The colors indicate different cell types. The middle panel is the result of gene enrichment analysis. GO, ko, and R-HSA indicate Gene Ontology, KEGG Pathway (Homo sapiens), and Reactome (Homo sapiens), respectively. The lower panel illustrates protein-protein interactions.
44
Figure. 3d: 929 genes with sharp up-regulation in the late phase, including trans-synaptic signaling related genes
The upper panel shows gene expression profiles in the cluster. The colors indicate different cell types. The middle panel is the result of gene enrichment analysis. GO indicates Gene Ontology. The lower panel illustrates protein-protein interactions.
45
Figure. 3e: 940 genes displaying a gradual increase in expression, including cell cycle related genes
The upper panel shows gene expression profiles in the cluster. The colors indicate different cell types. The middle panel is the result of gene enrichment analysis. GO, hsa, and R-HSA indicate Gene Ontology, KEGG Pathway (Homo sapiens), and Reactome (Homo sapiens), respectively. The lower panel illustrates protein-protein interactions.
46
Figure. 3f: Principal component analysis of 75 samples in 3615 genes indicated the transcriptional similarities between neural progenitor cells (NPC) and the late phase
PCA using 3615 dynamically expressed genes. Tissue-derived cells and ESC-derived cells are labeled in black and dark red, respectively.
47
Figure. 3g: Principal component analysis of 75 samples and all 22062 genes also indicated the transcriptional similarities between neural progenitor cells (NPC) and the late phase
PCA using all 22062 genes in the GPL14550 platform. Tissue-derived cells and ESC-derived cells are labeled in black and dark red, respectively.
48
3-3: TF influence drastically changes between the mid phase
and the late phase
Because TFs play a critical role in regulating cell fate by controlling downstream gene
expression, I investigated candidate TFs that could play important roles in each
reprogramming phase. For this purpose, I scored TF influences and constructed a TF
network. I extracted 71 TFs that could have a major influence and displayed their
influences in different colors. The heatmap of TF influences clearly showed two distinct
clusters. The pluripotency-related TFs, including NANOG, SALL4, endogenous
POU5F1 and endogenous SOX2, had a positive influence value in the late phase
(Figure. 4a). On the other hand, tissue morphogenesis-associated TFs, such as EHF,
MEF2C, and FOXE1, had positive influence values in the early phase (Figure. 4a).
Next, I visualized the co-regulatory network, including all 71 TFs for each time point in
the reprogramming process. The time-course TF network illustrated that the TFs with
positive influence values between days 0 and 15 had a sparse network compared to the
TFs with negative influence values, whereas the TFs with positive influence values
beginning at day 20 had a denser network than the TFs with negative influence values
beginning at day 20. This result reflects the heterogeneity in cell status across different
49
mid phase and the late phase (Figure. 4b). Thus, the transition in TF influence suggested
50
Figure. 4a: Heatmap of TF influences suggested a dynamic transition in TF influence between the mid and late phases
The X-axis shows each sample during reprogramming and the Y-axis indicates the 71 transcription factors that were inferred to have high influences on the overall gene expression patterns. The TF influence was defined as the t-statistic of gene expressions positively and negatively correlated with the TF and its score is indicated by color (red: positive, blue: negative).
51
Figure. 4b: No TF networks can be found between the mid and late phases, which indicates distinct TF activity in the late phase
Inferred co-regulatory TF networks during the reprogramming process at days 0, 15, and 20 after OSKM induction. The TF influence scores are indicated by color (red: positive, blue: negative). The gray line shows the edge of the co-operative TF network.
52
Chapter 4: Discussion
4-1: Maturation might be the roadblock in the
reprogramming of various somatic cell types into hiPSCs
In this study, I analyzed 3615 extracted genes from five human cell types with dynamic
expression during the reprogramming process (Figure 1a, b) to determine whether a
shared reprogramming route could be observed in human cellular reprogramming. The
results of the transcriptome analysis indicated that a common route of reprogramming in
human somatic cells could be divided into three conserved clusters: an early phase, a
mid phase and a late phase (Figure. 2a, b). The similarity of cellular states obtained
using transcriptomic data from the extracted dynamically expressed genes showed three
clusters. In particular, a major dissimilarity was observed between the mid phase and
the late phase (Figure. 2a, b). Moreover, I functionally annotated the groups of genes
clustered by their gene expression patterns (Figure. 3a-e). Finally, I studied TF activity
and reconstructed TF networks; this analysis revealed that the major difference in TF
activity occurred during the transition between the mid phase and the late phase (Figure.
53
Recent studies indicate that maturation, which is characterized as the phase when
pluripotency genes, including Nanog, Sall4, and Oct4, start to be expressed (David and
Polo, 2014; Samavarchi-Tehrani et al., 2010), is the major roadblock in the process of
reprogramming HDFs into hiPSCs (Tanabe et al., 2013). The study demonstrated that,
although approximately 20% of retrovirus-infected cells at day 7 of OSKM induction
express TRA-1-60, a pluripotent stem cell surface marker, only a small portion of the
TRA-1-60 positive cells become iPSCs. This may be because many intermediate cells
revert back to TRA-1-60 negative cells (Tanabe et al., 2013). In our study, NANOG
expression gradually increased and reached a plateau during the mid phase (Figure. 1b).
This indicated that the mid phase might correspond to the maturation phase. Therefore,
our results indicated that the maturation phase could be the major roadblock in various
human cell types (Figure. 2a, b and Figure. 4a, b).
Notably, the transcriptome and TF activity in epithelial cells exhibited distinct
differences between the mid phase (days 7 to 15) and the late phase (day 20 to hiPSC
establishment), corresponding to the maturation and stabilization phases (Figure. 2a, b
and Figure. 4a, b), even though epithelial cells do not require MET for initiation.
54
important and could lead to improved clinical availability of various human
tissue-derived cells.
4-2: Comparison of the results with previous studies
Our study indicated that the downregulation of TFs with positive influence values in the
early and mid phases might hold the key to overcoming the roadblock of the maturation
phase. For instance, a recent study reported that co-expression of FOSL2 with OSKM
had an inhibitory effect on the reprogramming of both of human corneal epithelial cells
(CECs) and HDFs (Kitazawa et al., 2016). Correspondingly, our study showed that the
expression and influence of FOSL2 remained up-regulated in the early and mid phases
in both mesenchymal cells and epithelial cells but was negatively regulated in the late
phase (Figure. 4a, b, and Figure. 5a). This supports the hypothesis that inhibition of
Fosl2 expression might drive reprogramming towards the maturation phase.
Interestingly, AP-1 complexes, such as c-Jun and c-Fos, were reported to reduce the
reprogramming efficiency in MEFs by impeding MET at initiation (Liu et al., 2015).
However, our results suggested that FOSL2 might also play a suppressive role in the
55
In addition, DNMT3L, a catalytically inactive DNA methyltransferase regulatory factor,
was reported to be highly expressed on day 20 of the reprogramming of HDFs into
iPSCs (Cacchiarelli et al., 2015). Moreover, DNMT3L-overexpressing HeLa cells
exhibited iPSC-like colonies and high SOX2 expression levels, even after over 20
passages (Gokul et al., 2009). However, to the best of our knowledge, the functional
role of DNMT3L has not yet been studied in the context of cellular reprogramming.
Surprisingly, in our study, DNMT3L expression was transiently up-regulated in the mid
phase (Figure. 4a, b, and Figure 5b), indicating that DNMT3L may play some biological
role in the facilitation of maturation during reprogramming. Moreover, AIRE had a
similar expression and influence profile to DNMT3L; its expression and influence value
were only positive in the mid phase (Figure. 4a, b, and Figure 5b). Given that the
genomic locations of DNMT3L and AIRE are closely coordinated on human
chromosome 21 and given that they share their 23.5 kb upstream region, it may be
speculated that DNMT3L and AIRE may be regulated by the same mechanisms, such as
by other TFs or by epigenetic modification.
4-3: Comparison of the reprogramming processes in mice and
humans
56
The previous studies illustrated the reprogramming of mouse cell lines from MEFs. In
these studies, first mesenchymal gene expression was lost, followed by transient
upregulation of epidermal genes, and finally the stable expression of
pluripotency-related genes (O’Malley et al., 2013; Ruetz and Kaji, 2014). Interestingly, our analysis
of human cellular reprogramming was partially consistent with the mouse
reprogramming gene expression patterns (Figure. 3a, c, e). Specifically, the TF network
suggested that epidermis-related TFs, such as KLF4 and EHF, had a cooperative
interaction and changed from positive to negative influence values in the late phase
(Figure 4b). Several studies reported the significance of Klf4 in reprogramming
efficiency; low Klf4 protein levels paused the reprogramming process in MEFs
regardless of high expression of the other reprogramming factors (Oct4, Sox2 and
c-Myc) (Nishimura et al., 2014); further, the length of Klf4 isoforms was critical for the
determination of reprogramming efficiency (Chantzoura et al., 2015; Kim et al., 2015).
Therefore, KLF4 and its co-operative genes may play important roles in the transition to
the late phase by overcoming the roadblock of reprogramming maturation. Furthermore,
the transient upregulation of epidermal-related genes in human cells supports the
possibility that the reprogramming process is not simply the opposite of normal
57
4-4: A possible population selection in maturation
Although transcriptome dynamics during reprogramming were justifiably represented
using a microarray dataset, the bulk nature of microarray measurements of cell
populations can mask the transcriptomic changes of small cell populations (Saliba et al.,
2014). Nevertheless, this study consistently revealed that the expression of cell
cycle-related genes gradually increased from the early phase to the late phase (Figure. 3e) and
that the TF influence drastically changed between the mid phase and the late phase
(Figure. 4a). In addition, the high density of TF networks displaying a shift in influence
from negative to positive suggested a homogenous co-operative TF activity (Figure.
4b), strengthening the possibility that a masked population could represent cellular
reprogramming. Given that the reprogramming cells acquire high proliferative ability at
the early phase (Ruiz et al., 2011), these results indicated that only a small subset of
cells that acquired pluripotency and high proliferative ability in the mid phase could
survive and continue to proliferate in self-replicative manner, eventually dominating the
late phase population. To address this issue accurately, single-cell RNA sequence at the
58
As far as I know, our report is the first study to show that the human reprogramming
process is partially shared across multiple different human somatic cell types and that
maturation could be a common barrier in the reprogramming of various human cell
types. This strategy could be applied not only to transcriptomic but also to epigenetic or
proteomic studies and would provide further insights into the fundamental mechanisms
of cellular reprogramming.
In conclusion, I demonstrated that the reprogramming process is shared across five
human somatic cell types by applying genome-wide analyses of time-course microarray
data. From the results of functional annotations of gene expression patterns and
reconstruction of transcription factor activity, I suggest that the maturation phase could
be the common roadblock in the reprogramming of various cell types into hiPSCs.
Identification of a reprogramming route that is shared across cell types would provide
59
Figure. 5a: Expression pattern of FOSL2
60
Figure. 5b: Expression patterns of DNMT3L and AIRE during reprogramming
'A_23_P17673' and 'A_23_P68740' indicate Probe IDs in the GPL14550 microarray platform.
61
Acknowledgements
I deeply appreciate Professor Satoru Takahashi. It has been an honor to be his student
and a member of his laboratory. His constructive advice and supportive and respectful
attitude made my Ph.D. enjoyable and productive. Under his guidance, I was able to
overcome many difficulties during my Ph.D.
I also thank Associate Professor Ken Nishimura, Laboratory of Gene Regulation, and
Associate Professor Masafumi Muratani, Department of Genome Biology. They
provided many comments, both critical and supportive, regarding my research. Thanks
to their advice, my research is well-aligned and discussable.
I would also like to thank my former advisor Professor Hiroki Ueda, Department of
Systems Pharmacology at the University of Tokyo. He accepted me as a visiting student
in his laboratory for two years. During this time, I was strongly influenced by his
passion for science and I learned how to make scientific papers more logical.
For this dissertation, I would like to thank my Ph.D. committee for their supportive
advice and instructive comments.
I am sincerely grateful for all the support from the Ph.D. Program in Human Biology,
62
University of Tsukuba. I could not have completed my Ph.D. research without their
support.
I want to thank all members of the Takahashi laboratory for their friendship and
support. I will never forget the excellent times we had at meetings, parties, BBQs, and
so on.
Finally, I would like to express my heartfelt gratitude to my father, mother, and sister
for all their encouragement. In particular, Dr. Haruka Kuno shares all joy and sorrow
with me. She has motivated me to keep studying and also taught me that it is important
to stop studying and enjoy life in some difficult situations. Thanks to her, I kept
63
References
Aasen, T., Raya, A., Barrero, M.J., Garreta, E., Consiglio, A., Gonzalez, F., Vassena, R., Bilić, J., Pekarik, V., Tiscornia, G., et al. (2008). Efficient and rapid generation of induced pluripotent stem cells from human keratinocytes. Nat. Biotechnol. 26, 1276–1284.
Aoki, T., Ohnishi, H., Oda, Y., Tadokoro, M., Sasao, M., Kato, H., Hattori, K., and Ohgushi, H. (2010). Generation of Induced Pluripotent Stem Cells from Human Adipose-Derived Stem Cells Withoutc-MYC. Tissue Eng. Part A 16, 2197–2206.
Bianconi, E., Piovesan, A., Facchin, F., Beraudi, A., Casadei, R., Frabetti, F., Vitale, L., Pelleri, M.C., Tassani, S., Piva, F., et al. (2013). An estimation of the number of cells in the human body. Ann. Hum. Biol. 40, 463–471.
Brambrink, T., Foreman, R., Welstead, G.G., Lengner, C.J., Wernig, M., Suh, H., and Jaenisch, R. (2008). Sequential expression of pluripotency markers during direct reprogramming of mouse somatic cells. Cell Stem Cell 2, 151–159.
Buganim, Y., Faddah, D.A., Cheng, A.W., Itskovich, E., Markoulaki, S., Ganz, K., Klemm, S.L., van Oudenaarden, A., and Jaenisch, R. (2012). Single-cell expression analyses during cellular reprogramming reveal an early stochastic and a late hierarchic phase. Cell 150, 1209– 1222.
Cacchiarelli, D., Trapnell, C., Ziller, M.J., Soumillon, M., Cesana, M., Karnik, R., Donaghey, J., Smith, Z.D., Ratanasirintrawoot, S., Zhang, X., et al. (2015). Integrative Analyses of Human Reprogramming Reveal Dynamic Nature of Induced Pluripotency. Cell 162, 412–424.
Chantzoura, E., Skylaki, S., Menendez, S., Kim, S.-I., Johnsson, A., Linnarsson, S., Woltjen, K., Chambers, I., and Kaji, K. (2015). Reprogramming Roadblocks Are System Dependent. Stem Cell Reports 5, 350–364.
Chatr-Aryamontri, A., Oughtred, R., Boucher, L., Rust, J., Chang, C., Kolas, N.K., O’Donnell, L., Oster, S., Theesfeld, C., Sellam, A., et al. (2017). The BioGRID interaction database: 2017 update. Nucleic Acids Res. 45, D369–D379.
Chebil, I., Nicolle, R., Santini, G., Rouveirol, C., and Elati, M. (2014). Hybrid method inference for the construction of cooperative regulatory network in human. IEEE Trans. Nanobioscience
64
Chia, N.-Y., Chan, Y.-S., Feng, B., Lu, X., Orlov, Y.L., Moreau, D., Kumar, P., Yang, L., Jiang, J., Lau, M.-S., et al. (2010). A genome-wide RNAi screen reveals determinants of human embryonic stem cell identity. Nature 468, 316–320.
Conesa, A., Nueda, M.J., Ferrer, A., and Talón, M. (2006). maSigPro: a method to identify significantly differential expression profiles in time-course microarray experiments. Bioinformatics 22, 1096–1102.
Cowan, C.A., Atienza, J., Melton, D.A., and Eggan, K. (2005). Nuclear reprogramming of somatic cells after fusion with human embryonic stem cells. Science 309, 1369–1373. David, L., and Polo, J.M. (2014). Phases of reprogramming. Stem Cell Res. 12, 754–761. Di Stefano, B., Sardina, J.L., van Oevelen, C., Collombet, S., Kallin, E.M., Vicent, G.P., Lu, J., Thieffry, D., Beato, M., and Graf, T. (2014). C/EBPα poises B cells for rapid reprogramming into induced pluripotent stem cells. Nature 506, 235–239.
Elati, M., Neuvial, P., Bolotin-Fukuhara, M., Barillot, E., Radvanyi, F., and Rouveirol, C. (2007). LICORN: learning cooperative regulation networks from gene expression data. Bioinformatics 23, 2407–2414.
Evans, M.J., and Kaufman, M.H. (1981). Establishment in culture of pluripotential cells from mouse embryos. Nature 292, 154–156.
Gokul, G., Ramakrishna, G., and Khosla, S. (2009). Reprogramming of HeLa cells upon DNMT3L overexpression mimics carcinogenesis. Epigenetics 4, 322–329.
Golipour, A., David, L., Liu, Y., Jayakumaran, G., Hirsch, C.L., Trcka, D., and Wrana, J.L. (2012). A late transition in somatic cell reprogramming requires regulators distinct from the pluripotency network. Cell Stem Cell 11, 769–782.
Hanna, J., Cheng, A.W., Saha, K., Kim, J., Lengner, C.J., Soldner, F., Cassady, J.P., Muffat, J., Carey, B.W., and Jaenisch, R. (2010). Human embryonic stem cells with biological and epigenetic characteristics similar to those of mouse ESCs. Proc. Natl. Acad. Sci. U. S. A. 107, 9222–9227.
Hou, P., Li, Y., Zhang, X., Liu, C., Guan, J., Li, H., Zhao, T., Ye, J., Yang, W., Liu, K., et al. (2013). Pluripotent stem cells induced from mouse somatic cells by small-molecule compounds. Science 341, 651–654.
65
Hynes, R.O. (2009). The Extracellular Matrix: Not Just Pretty Fibrils. Science 326, 1216–1219. Ichise, H., Nagano, S., Maeda, T., Miyazaki, M., Miyazaki, Y., Kojima, H., Yawata, N., Yawata, M., Tanaka, H., Saji, H., et al. (2017). NK Cell Alloreactivity against KIR-Ligand-Mismatched HLA-Haploidentical Tissue Derived from HLA Haplotype-Homozygous iPSCs. Stem Cell Reports 9, 853–867.
Jolly, C. (2011). Cell-to-cell transmission of retroviruses: Innate immunity and interferon-induced restriction factors. Virology 411, 251–259.
Kim, J.B., Sebastiano, V., Wu, G., Araúzo-Bravo, M.J., Sasse, P., Gentile, L., Ko, K., Ruau, D., Ehrich, M., van den Boom, D., et al. (2009a). Oct4-induced pluripotency in adult neural stem cells. Cell 136, 411–419.
Kim, J.B., Greber, B., Araúzo-Bravo, M.J., Meyer, J., Park, K.I., Zaehres, H., and Schöler, H.R. (2009b). Direct reprogramming of human neural stem cells by OCT4. Nature 461, 649–643. Kim, S.-I., Oceguera-Yanez, F., Hirohata, R., Linker, S., Okita, K., Yamada, Y., Yamamoto, T., Yamanaka, S., and Woltjen, K. (2015). KLF4 N-terminal variance modulates induced
reprogramming to pluripotency. Stem Cell Reports 4, 727–743.
Kitazawa, K., Hikichi, T., Nakamura, T., Mitsunaga, K., Tanaka, A., Nakamura, M.,
Yamakawa, T., Furukawa, S., Takasaka, M., Goshima, N., et al. (2016). OVOL2 Maintains the Transcriptional Program of Human Corneal Epithelium by Suppressing
Epithelial-to-Mesenchymal Transition. Cell Rep. 15, 1359–1368.
Li, R., Liang, J., Ni, S., Zhou, T., Qing, X., Li, H., He, W., Chen, J., Li, F., Zhuang, Q., et al. (2010). A mesenchymal-to-epithelial transition initiates and is required for the nuclear reprogramming of mouse fibroblasts. Cell Stem Cell 7, 51–63.
Lin, T., Ambasudhan, R., Yuan, X., Li, W., Hilcove, S., Abujarour, R., Lin, X., Hahm, H.S., Hao, E., Hayek, A., et al. (2009). A chemical platform for improved induction of human iPSCs. Nat. Methods 6, 805–808.
Liu, J., Han, Q., Peng, T., Peng, M., Wei, B., Li, D., Wang, X., Yu, S., Yang, J., Cao, S., et al. (2015). The oncogene c-Jun impedes somatic cell reprogramming. Nat. Cell Biol. 17, 856–867. Liu, X., Sun, H., Qi, J., Wang, L., He, S., Liu, J., Feng, C., Chen, C., Li, W., Guo, Y., et al. (2013). Sequential introduction of reprogramming factors reveals a time-sensitive requirement
66
for individual factors and a sequential EMT–MET mechanism for optimal reprogramming. Nat. Cell Biol. 15, 829–838.
Loh, Y.-H., Agarwal, S., Park, I.-H., Urbach, A., Huo, H., Heffner, G.C., Kim, K., Miller, J.D., Ng, K., and Daley, G.Q. (2009). Generation of induced pluripotent stem cells from human blood. Blood 113, 5476–5479.
Lowry, W.E., Richter, L., Yachechko, R., Pyle, A.D., Tchieu, J., Sridharan, R., Clark, A.T., and Plath, K. (2008). Generation of human induced pluripotent stem cells from dermal fibroblasts. Proc. Natl. Acad. Sci. U. S. A. 105, 2883–2888.
Maekawa, M., Yamaguchi, K., Nakamura, T., Shibukawa, R., Kodanaka, I., Ichisaka, T., Kawamura, Y., Mochizuki, H., Goshima, N., and Yamanaka, S. (2011). Direct reprogramming of somatic cells is promoted by maternal transcription factor Glis1. Nature 474, 225–229. Maherali, N., and Hochedlinger, K. (2009). Tgfbeta signal inhibition cooperates in the induction of iPSCs and replaces Sox2 and cMyc. Curr. Biol. 19, 1718–1723.
Martin, G.R. (1981). Isolation of a pluripotent cell line from early mouse embryos cultured in medium conditioned by teratocarcinoma stem cells. Proc. Natl. Acad. Sci. U. S. A. 78, 7634– 7638.
Matsumura, H., Tada, M., Otsuji, T., Yasuchika, K., Nakatsuji, N., Surani, A., and Tada, T. (2007). Targeted chromosome elimination from ES-somatic hybrid cells. Nat. Methods 4, 23– 25.
McKernan, R., and Watt, F.M. (2013). What is the point of large-scale collections of human induced pluripotent stem cells? Nat. Biotechnol. 31, 875–877.
Nichols, J., and Smith, A. (2009). Naive and Primed Pluripotent States. Cell Stem Cell 4, 487– 492.
Nicolle, R., Radvanyi, F., and Elati, M. (2015). CoRegNet: reconstruction and integrated analysis of co-regulatory networks. Bioinformatics 31, 3066–3068.
Nishimura, K., Kato, T., Chen, C., Oinam, L., Shiomitsu, E., Ayakawa, D., Ohtaka, M., Fukuda, A., Nakanishi, M., and Hisatake, K. (2014). Manipulation of KLF4 expression generates iPSCs paused at successive stages of reprogramming. Stem Cell Reports 3, 915–929.