Geographical and Gender Differences in the Impacts
of Education, Occupation and Psychological Factors
on M ortality Risk in a M iddle-aged Japanese Cohort
Hisaka Iijima,
Tetsuo Sakamaki,
Minato Nakazawa,
Hiroshi Koyama
and Shosuke Suzuki
Background & Aims: This study examined the effects of education, occupation, social networks and psychological factors on all-cause mortality in a middle-aged Japanese cohort. M ethods: The cohort study (n : 11,565) was conducted from 1993 until 2011. The subjects were middle-aged males and females living in rural (n : 4,501; deaths: 669) and urban (n : 7,064; deaths: 1,190) areas in Gunma, Japan. Cox proportional hazards model was applied to investigate how various factors affect mortality risk. Results: In the age-adjusted model, higher educated rural males had significantly lower risks (junior high school: 1.00; high school: 0.76; junior college: 0.57), though rural females had a U-shaped risk pattern with the lowest significant risk (0.63)in the high school group. Also,males who were non-married or non-participated or heavily drinking or never exercised or BMI less than 18.5 or having chronic diseases or depression had significantly higher mortality risks. Current smoking was only one universal factor that was still significantly affected increased risk of mortality across both areas and genders. Conclusions: In the rural area, educational levels were related to mortality risk, but the risk patterns were different from genders. Males of poorer social networks had higher mortality risks.
(Kitakanto Med J 2013;63:21∼32)
Key words: occupation, education, mortality risk, rural-urban differences, gender differences
Introduction
Several epidemiologists were concerned about clarifying the relations between social factors and health. Some of them have focused on social net-works and health. Berkman et al. examined the relationships between four social networks (marriage, contacts with close friends and relatives, church mem-bership,and group associations)and mortality control-ling for self-reported data of physical health, socio-economic status,smoking,alcohol consumption,physi-cal exercise, obesity. These results show that social networks are closely related to mortality risk. The Tecumseh Community Health Study and the Evans County Cardiovascular Epidemiologic Study
foll-owed and extended Berkman s work.
Suzuki et al. conducted a community based pro-spective study modeled after Berkman s work. This study recruited 12,630 subjects who were living in two areas, Komochi Village and Isesaki City, in Gunma Prefecture, Japan in 1993. This study was named the Komo-Ise Study,and the first follow-up round was set between 1993 and 2000. Iwasaki et al. investigated rural-urban differences in all-cause mortality among males having various occupation, education, social networks,and psychological factors using the database of the first round of the Komo-Ise Study.
The all-cause deaths in the first follow-up subjects were followed up secondly from 2001 to 2011 in this study. The aim of the present study was to assess the
Kitakanto Med J 2013;63:21∼32
1 Department of Medical Informatics, Gunma University Graduate School of Medicine, 3-39-15 Showa-machi, Maebashi, Gunma 371-8511, Japan 2 Department of Medical Informatics and Decision Science, Gunma University Hospital, 3-39-15 Showa-machi, Maebashi, Gunma 371-8511, Japan 3 Department of International Health, Kobe University Graduate School of Health Sciences, 7-10-2 Tomogaoka,Suma-ku,Kobe,Hyogo 654-0142,Japan 4 Department of Public Health,Gunma University Graduate School of Medicine, 3-39-22 Showa-machi, Maebashi, Gunma 371-8511, Japan 5 The NPO of International Eco-Health Research Group, 133-4 Horiguchi-machi, Isesaki, Gunma 372-0834, Japan
Received : November 26, 2012 Accepted : December 26, 2012
Address: HISAKA IIJIMA Department of Medical Informatics, Gunma University Graduate School of Medicine, 3-39-15 Showa-machi, Maebashi, Gunma 371-8511, Japan
impacts of occupation,education,social network,and psychological factors on mortality risk, stratified by living areas and genders.
M aterials and M ethods
Study population
The Komo-Ise Study includes two research areas of Komochi Village and Isesaki City, Gunma, Japan. According to the 1995 census, the village had a population of 12,141 with 3,284 households, and the city had a population of 120,236 with 40,335 house-holds. All male and female residents(12,630)aged 40 to 69 years―4,875 from Komochi Village and 7,755 from the downtown district of Isesaki City―were selected from registration records of the local govern-ments, identified in Komochi Village as of September 1992, and in Isesaki City as of August 1993. A self-administered questionnaire was distributed through the municipal government officers to all eligible sub-jects of Komochi Village in January 1993 and to those of the downtown district of Isesaki City in October 1993. Completed questionnaires were collected in sealed envelopes via the official community organiza-tion route. The 11,565 subjects in both areas respond-ed to the questionnaires(response rate: 91.6%)during the baseline survey. Ohta et al. have discussed aspects of biases related to response rates for the baseline study.
The 11,565 subjects enrolled into the baseline study. Participants were composed of 4,501 subjects (2,295 males and 2,206 females)from Komochi Village (the rural group) and 7,064 subjects (3,335 males and 3,729 females) from the downtown district of Isesaki City(the urban group).
Follow-up procedures
Information on deaths and migrations in the co-hort study was obtained from the municipal resident registration file, Jumin-Kihon-Daicho, at first from 1993 to 2000,and secondly from 2001 to 2011,in both of the areas. A mail inquiry was added as a means of reaching subjects who had migrated out of the survey area. Subjects who did not respond to the mail inquiry,or who had not been reached,were regarded as censored cases.
In order to reduce the possible effect on mortality due to unreported or unrecognized conditions at baseline,the subjects who had died and been censored within one year following the baseline survey were excluded from the analyses. The remaining 11,481 participants including 4,484 subjects from the rural group (2,284 males and 2,200 females) and 6,997 sub-jects from the urban group (3,304 males and 3,693 females) were identified as the final candidates for the
study.
This prospective study was approved by the Research Ethics Committee for Epidemiologic Research of Gunma University Graduate School of Medicine (Approval Number: 16-5).
Study variables
The questionnaire consisted of items assessing social characteristics, social network, lifestyle, health status, and a symptoms checklist known as the Todai Health Index (THI) in order to assess the depres-sion.
Social characteristics included gender, age, occu-pation, and educational background. The longest-held occupations were grouped into the following four categories: salaried worker,self-employed,agriculture and forestry, and no occupation. Educational back-ground was divided into three categories (1. junior high school, 2. high school, 3. junior college and college or higher, including vocational school or spe-cial school) according to the recent recommenda-tions.
Social network items included seven factors in the present study: 1) marriage (marriage), 2) household members (household), 3) relatives, frequency to meet with (relatives),4) friends,helpful to you (friends),5) participation in social activities(sociality),6)religious activities (religion), and 7) neighborhood to help you (neighborhood). These seven items were coded into dichotomous categories, except for household. Mar-riage was categorized into married and except above . Household was assessed by the risk reduction of per each additional person. Relatives were categor-ized into the meeting chances of often, sometimes and a few, never such that a few times a year or rarely or never. Friends, participation, religion, and neighborhood were divided into yes or no . Soci-ality responses were combined such that very often, often, and sometimes fell into yes .
Lifestyle and health status items included smoking habit, alcohol consumption, physical exercise, BMI (body mass index), chronic diseases. Smoking habit was coded as never smoked, former smokers, and current smokers. Alcohol consumption was coded as never, light versus heavy . Physical exercise was coded as often, sometimes versus never . BMI, calculated from self-reported data (weight (kg)/ height (m) ), was coded into three categories: 18.5≦ and<25.0; <18.5; and 25.0≦. Chronic diseases were coded as no and yes . The depression was presented by per each additional score of the depres-sion scale of the THI.
Statistical methods
Cox proportional hazards model was used to estimate hazard ratios (HRs) with 95% confidence intervals (CIs). Age-adjusted hazard ratios were cal-culated by each variable for each area and gender. Multivariate hazard ratios were calculated for each area and gender, adjusting simultaneously for all the variables.
Analyses were conducted using statistical software R version 2.14.1 with survival package.
Results
The results are shown in Table 1 to Table 8. Tables 1 and 2 show the baseline characteristics of male and female participants,respectively. In the year of baseline assessment in 1993, the mean ages of rural and urban participants,respectively,were 52.6 and 54.9 in males, and 53.1 and 55.3 in females. In the rural female group, percentages of salaried worker, self-employed, agriculture and forestry worker, and no occupation were almost identically distributed between 19 and 29%. In the urban female group, there were few agriculture and forestry worker, and most of them belonged to the other three works.
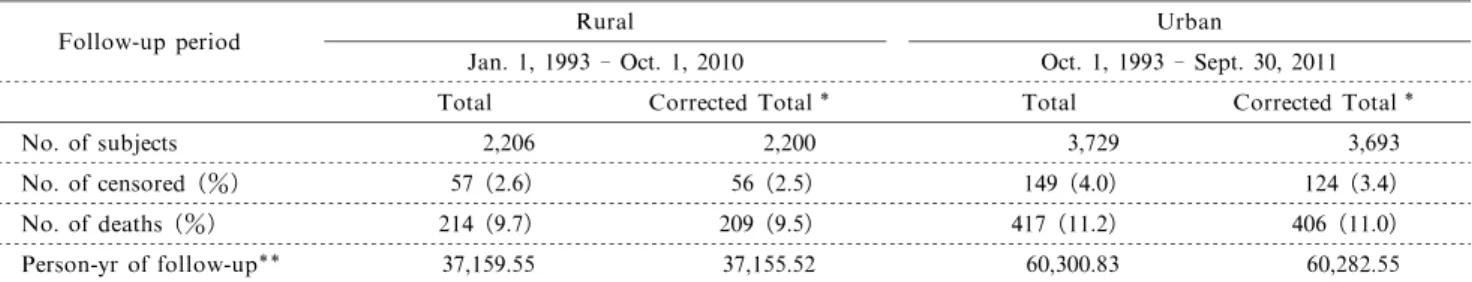
Tables 3 and 4 show the numbers of participants, censored cases,deaths,stratified by the rural and urban cohorts in male and female participants, respectively. The corrected total number means the number of cases excluding participants dead and censored within one year following the registration.
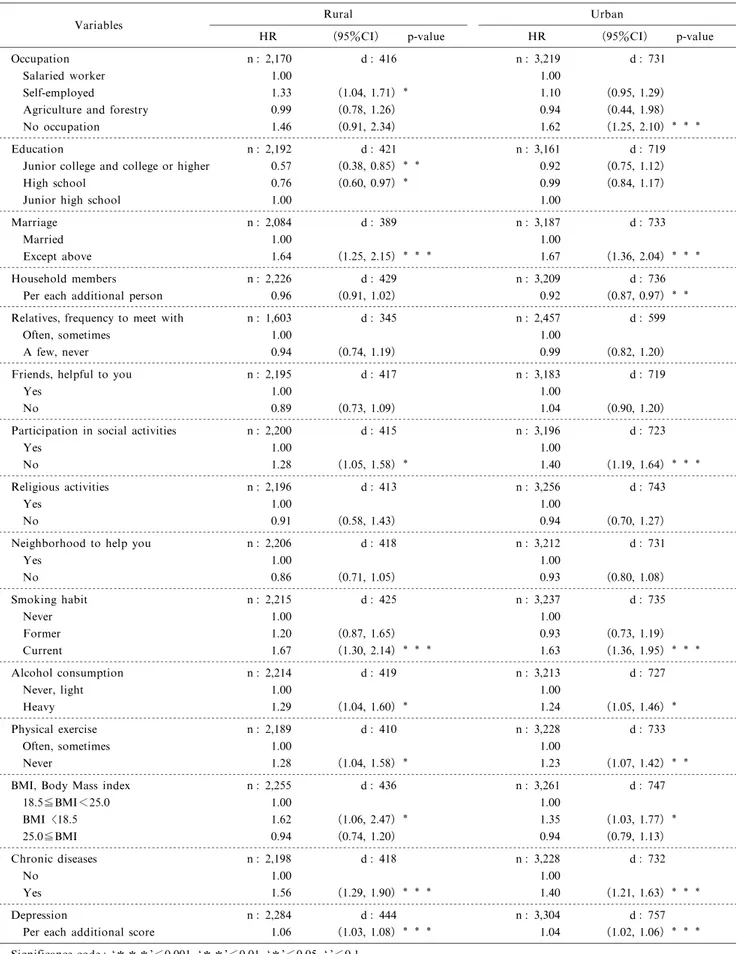
Tables 5 and 6 show the age-adjusted hazard ratios of each variable, stratified by regions and gen-ders. In the rural male group, self-employed subjects had a significantly higher mortality risk and higher educated subjects had a significantly lower risk. In the urban male group,subjects without any occupation had the highest significant mortality risk, but there were no significant relationship between mortality risk and educational levels. In the rural female group, subjects without any occupation had a significantly higher mortality risk and high school group had the lowest significant mortality risk. This U-shaped risk pattern shown in the rural female group was different from rural male group, and also urban participants.
In concern with social network variables, mar-riage and sociality were significantly associated with mortality both in males living in rural and urban areas. Males who were not married or did not participate in social activities had significantly higher risks of mor-tality. Among females,unmarried status significant-ly affected higher mortality risk onsignificant-ly in the rural group, and the subjects who did not participate in social activities had significantly higher mortality risk only in the urban group. The females living in the
rural area and also without any close friends had significantly higher mortality risk. Household size tended to reduce the risk of mortality as the number of additional persons living with increased,but the trend was significant only in males living in the urban area. Relatives,Religion,and Neighborhood were not signifi-cantly associated with age-adjusted hazard ratios. All lifestyle and health status variables (except physical exercise among females) were significantly associated with age-adjusted hazard ratios across both areas and genders. Lack of exercise did not significantly affect the mortality risk for females, but that was nearly significant among females living in urban area.
Tables 7 and 8 show the multivariate hazard ratios that were calculated adjusting simultaneously for all variables to assess the effect of the other variables. The subjects corresponding to a variable may not be corresponding to some of the other variables, so the subjects corresponding to all variables decreased from the subjects corresponding to a variable. In tables 7 and 8,the pattern of hazard ratios of variables adjusted multivariately was similar but less significant than the age-adjusted hazard ratios. Current smoking was only one universal factor that significantly increased risk of mortality across both areas and genders. The presence of chronic diseases was significantly associat-ed with higher mortality risk in all regional and gender groups excluding females living in the rural area. The multivariate hazard ratios in lower educated subjects tended to have higher mortality risk than higher edu-cated subjects,but this trend was not significant across areas and genders. Occupational issues significantly affected mortality risk in urban males and rural females.
Discussion
The variables loosing significance in the multivar-iate model may be considered as indirect factors. Torssander et al. assumed the causal order that educa-tion precedes occupaeduca-tion, and occupaeduca-tion precedes income. Then, they found in Sweden that the higher educated have the lower risk,especially in age-adjusted model for both sexes who were employed and married. From the current results of the multivariate model, education also precedes occupation and that lifestyle and health status variables show strong effects on mortality because those were depending on occupa-tion, and then social network variables show weaker effects than those.
The educational levels were significantly related to age-adjusted mortality risks in the rural males and females but not in the urban males and females. Among rural males, those who were higher educated had a significantly lower age-adjusted mortality risk,
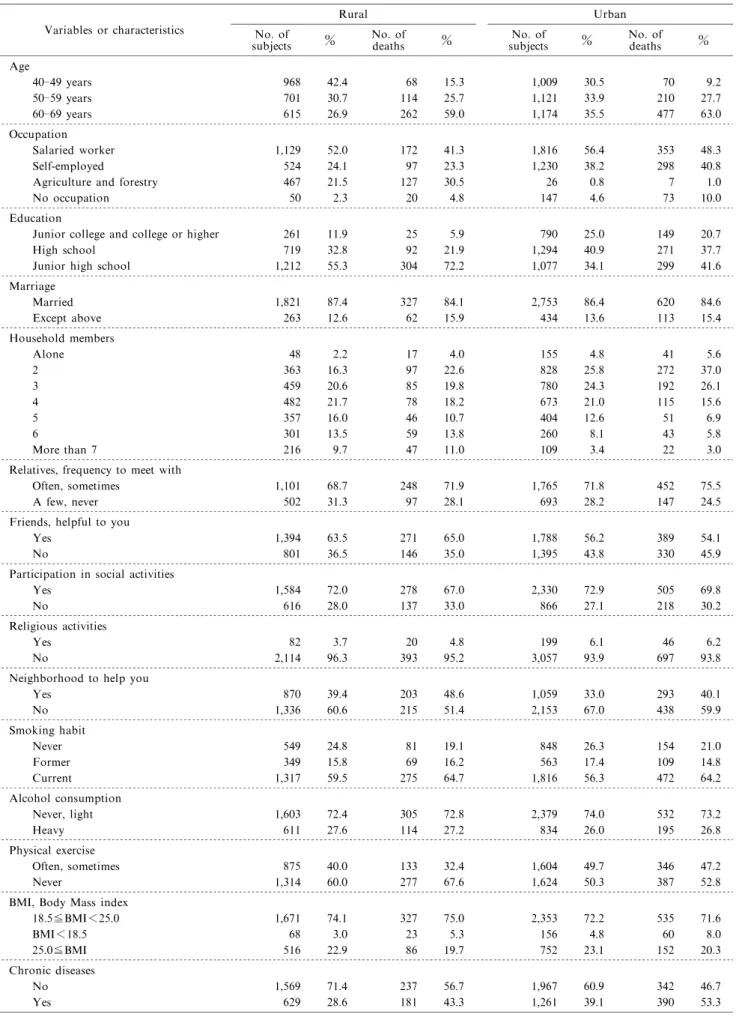
Table 1 Baseline sociodemographic, social network, lifestyle, and chronic disease characteristics in males living in Komochi Village (rural) and the downtown of Isesaki City(urban).
Variables or characteristics
Rural No. of
subjects % No. ofdeaths %
Urban No. of
subjects % No. ofdeaths % Age 40-49 years 968 42.4 68 15.3 1,009 30.5 70 9.2 50-59 years 701 30.7 114 25.7 1,121 33.9 210 27.7 60-69 years 615 26.9 262 59.0 1,174 35.5 477 63.0 Occupation Salaried worker 1,129 52.0 172 41.3 1,816 56.4 353 48.3 Self-employed 524 24.1 97 23.3 1,230 38.2 298 40.8 Agriculture and forestry 467 21.5 127 30.5 26 0.8 7 1.0
No occupation 50 2.3 20 4.8 147 4.6 73 10.0
Education
Junior college and college or higher 261 11.9 25 5.9 790 25.0 149 20.7 High school 719 32.8 92 21.9 1,294 40.9 271 37.7 Junior high school 1,212 55.3 304 72.2 1,077 34.1 299 41.6 Marriage Married 1,821 87.4 327 84.1 2,753 86.4 620 84.6 Except above 263 12.6 62 15.9 434 13.6 113 15.4 Household members Alone 48 2.2 17 4.0 155 4.8 41 5.6 2 363 16.3 97 22.6 828 25.8 272 37.0 3 459 20.6 85 19.8 780 24.3 192 26.1 4 482 21.7 78 18.2 673 21.0 115 15.6 5 357 16.0 46 10.7 404 12.6 51 6.9 6 301 13.5 59 13.8 260 8.1 43 5.8 More than 7 216 9.7 47 11.0 109 3.4 22 3.0
Relatives, frequency to meet with
Often, sometimes 1,101 68.7 248 71.9 1,765 71.8 452 75.5 A few, never 502 31.3 97 28.1 693 28.2 147 24.5 Friends, helpful to you
Yes 1,394 63.5 271 65.0 1,788 56.2 389 54.1
No 801 36.5 146 35.0 1,395 43.8 330 45.9
Participation in social activities
Yes 1,584 72.0 278 67.0 2,330 72.9 505 69.8
No 616 28.0 137 33.0 866 27.1 218 30.2
Religious activities
Yes 82 3.7 20 4.8 199 6.1 46 6.2
No 2,114 96.3 393 95.2 3,057 93.9 697 93.8
Neighborhood to help you
Yes 870 39.4 203 48.6 1,059 33.0 293 40.1 No 1,336 60.6 215 51.4 2,153 67.0 438 59.9 Smoking habit Never 549 24.8 81 19.1 848 26.3 154 21.0 Former 349 15.8 69 16.2 563 17.4 109 14.8 Current 1,317 59.5 275 64.7 1,816 56.3 472 64.2 Alcohol consumption Never, light 1,603 72.4 305 72.8 2,379 74.0 532 73.2 Heavy 611 27.6 114 27.2 834 26.0 195 26.8 Physical exercise Often, sometimes 875 40.0 133 32.4 1,604 49.7 346 47.2 Never 1,314 60.0 277 67.6 1,624 50.3 387 52.8
BMI, Body Mass index
18.5≦BMI<25.0 1,671 74.1 327 75.0 2,353 72.2 535 71.6 BMI<18.5 68 3.0 23 5.3 156 4.8 60 8.0 25.0≦BMI 516 22.9 86 19.7 752 23.1 152 20.3 Chronic diseases No 1,569 71.4 237 56.7 1,967 60.9 342 46.7 Yes 629 28.6 181 43.3 1,261 39.1 390 53.3
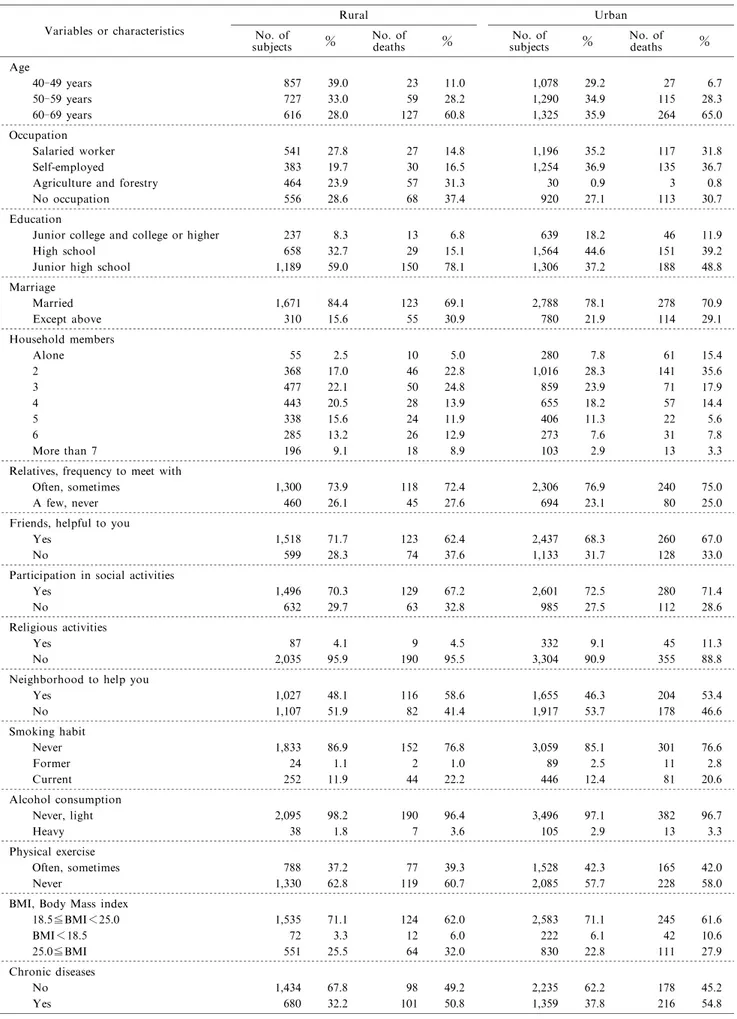
Table 2 Baseline sociodemographic, social network, lifestyle, and chronic disease characteristics in females living in Komochi Village (rural) and the downtown of Isesaki City(urban).
Variables or characteristics
Rural No. of
subjects % No. ofdeaths %
Urban No. of
subjects % No. ofdeaths % Age 40-49 years 857 39.0 23 11.0 1,078 29.2 27 6.7 50-59 years 727 33.0 59 28.2 1,290 34.9 115 28.3 60-69 years 616 28.0 127 60.8 1,325 35.9 264 65.0 Occupation Salaried worker 541 27.8 27 14.8 1,196 35.2 117 31.8 Self-employed 383 19.7 30 16.5 1,254 36.9 135 36.7 Agriculture and forestry 464 23.9 57 31.3 30 0.9 3 0.8 No occupation 556 28.6 68 37.4 920 27.1 113 30.7 Education
Junior college and college or higher 237 8.3 13 6.8 639 18.2 46 11.9 High school 658 32.7 29 15.1 1,564 44.6 151 39.2 Junior high school 1,189 59.0 150 78.1 1,306 37.2 188 48.8 Marriage Married 1,671 84.4 123 69.1 2,788 78.1 278 70.9 Except above 310 15.6 55 30.9 780 21.9 114 29.1 Household members Alone 55 2.5 10 5.0 280 7.8 61 15.4 2 368 17.0 46 22.8 1,016 28.3 141 35.6 3 477 22.1 50 24.8 859 23.9 71 17.9 4 443 20.5 28 13.9 655 18.2 57 14.4 5 338 15.6 24 11.9 406 11.3 22 5.6 6 285 13.2 26 12.9 273 7.6 31 7.8 More than 7 196 9.1 18 8.9 103 2.9 13 3.3
Relatives, frequency to meet with
Often, sometimes 1,300 73.9 118 72.4 2,306 76.9 240 75.0 A few, never 460 26.1 45 27.6 694 23.1 80 25.0 Friends, helpful to you
Yes 1,518 71.7 123 62.4 2,437 68.3 260 67.0
No 599 28.3 74 37.6 1,133 31.7 128 33.0
Participation in social activities
Yes 1,496 70.3 129 67.2 2,601 72.5 280 71.4
No 632 29.7 63 32.8 985 27.5 112 28.6
Religious activities
Yes 87 4.1 9 4.5 332 9.1 45 11.3
No 2,035 95.9 190 95.5 3,304 90.9 355 88.8
Neighborhood to help you
Yes 1,027 48.1 116 58.6 1,655 46.3 204 53.4 No 1,107 51.9 82 41.4 1,917 53.7 178 46.6 Smoking habit Never 1,833 86.9 152 76.8 3,059 85.1 301 76.6 Former 24 1.1 2 1.0 89 2.5 11 2.8 Current 252 11.9 44 22.2 446 12.4 81 20.6 Alcohol consumption Never, light 2,095 98.2 190 96.4 3,496 97.1 382 96.7 Heavy 38 1.8 7 3.6 105 2.9 13 3.3 Physical exercise Often, sometimes 788 37.2 77 39.3 1,528 42.3 165 42.0 Never 1,330 62.8 119 60.7 2,085 57.7 228 58.0
BMI, Body Mass index
18.5≦BMI<25.0 1,535 71.1 124 62.0 2,583 71.1 245 61.6 BMI<18.5 72 3.3 12 6.0 222 6.1 42 10.6 25.0≦BMI 551 25.5 64 32.0 830 22.8 111 27.9 Chronic diseases No 1,434 67.8 98 49.2 2,235 62.2 178 45.2 Yes 680 32.2 101 50.8 1,359 37.8 216 54.8
as previously reported by Iwasaki et al. . Smith et al. reported that rural males are exposed to a greater mortality risk than that of urban males in association with lower educational level,low income,and lack of a spouse, due to marriage difficulty or the divorce.
Among rural females,the middle educational level had the lowest age-adjusted mortality risk,following a U-shaped risk pattern. Torssander et al. found that the higher educated had the lower risk for both sexes. In Japan,Ito et al. recently reported that less than 10 years of education, as compared with more than 12 years of education, was associated with significantly higher all-cause mortality risk among males and females in the JPHC Cohort I Study. These reports might help to explain the higher mortality risk among lower-educated rural males and females. However, the reason for the U-shaped risk pattern―that the middle educational level conferred the lowest risk among rural females―remains unclear. Honjo et al. also reported the U-shaped association of educational levels with the age and area-adjusted hazard ratios for total stroke incidence among Japanese females from the JPHC Cohort I Study. This risk pattern might also relate to the highest age-adjusted death rate of professional occupations among working females. The mortality risk factors of Japanese females might differ from those of males.
Self-employed urban males and rural females working in agriculture and forestry had higher hazard ratios in the multivariate model. Cavelaars et al. showed in seven European countries that self-employed males are generally healthier than the
aver-age population with respect to morbidity indicators, including perceived health, chronic conditions, and any long-standing health problems. Ohta et al. re-ported that self-employed Japanese males had higher job satisfaction but felt that their job was hard, and also had slightly more physical and mental complaints. Our present findings may indicate the effects of these complaints among Japanese self-employed workers on their mortality risks.
Among rural females, high mortality risk shifted from the category of no occupation in the age-adjusted model to the category of agriculture and forestry in the multivariate model. On the other hand,rural males of agriculture and forestry had a lower but insignificant multivariate mortality risk. Among urban females, salaried workers had the highest multivariate risk,and the other three groups had almost the same mortality risk different from the urban males, but the difference was not significant. Hart reported that the main explanation for occupational mortality differences should be considered potentially resulting from socio-economic factors, such as wealth, income, housing, education, employment opportunities, and behavioral characteristics. The reasons for these results are un-clear in our study.
Urban males without any occupation had a higher mortality risk in both models. Rural females without occupation had a higher but not significant age-adjusted mortality risk. The reasons for these results are unclear. However,urban males and rural females without any occupation might have different condi-tions for being at a higher mortality risk.28.6% of the
Table 3 The number of participants, censored cases and deaths in male participants living in the rural and urban areas.
Follow-up period Rural
Jan. 1, 1993 -Oct. 1, 2010
Urban
Oct. 1, 1993 -Sept. 30, 2011 Total Corrected Total Total Corrected Total
No. of subjects 2,295 2,284 3,335 3,304
No. of censored (%) 63 (2.7) 63 (2.8) 133 (4.0) 118 (3.6) No. of deaths (%) 455 (19.8) 444 (19.4) 773 (23.2) 757 (22.9) Person-yr of follow-up 36,737.98 36,732.33 50,772.32 50,754.91 * Without early one-year-death and censored cases
** Person-yr of follow-up=total follow-up days of each subjects/365.24
Table 4 The number of participants, censored cases and deaths in female participants living in the rural and urban areas.
Follow-up period Rural
Jan. 1, 1993 -Oct. 1, 2010
Urban
Oct. 1, 1993 -Sept. 30, 2011 Total Corrected Total Total Corrected Total
No. of subjects 2,206 2,200 3,729 3,693
No. of censored (%) 57 (2.6) 56 (2.5) 149 (4.0) 124 (3.4) No. of deaths (%) 214 (9.7) 209 (9.5) 417 (11.2) 406 (11.0) Person-yr of follow-up 37,159.55 37,155.52 60,300.83 60,282.55 * Without early one-year-death and censored cases
Table 5 Cox proportional hazards model on age-adjusted hazard ratios (HRs)with 95% confidence interval (CI)for all-cause of death in male participants stratified by regions.
Variables Rural HR (95%CI) p-value Urban HR (95%CI) p-value Occupation n : 2,170 d : 416 n : 3,219 d : 731 Salaried worker 1.00 1.00 Self-employed 1.33 (1.04, 1.71) 1.10 (0.95, 1.29)
Agriculture and forestry 0.99 (0.78, 1.26) 0.94 (0.44, 1.98)
No occupation 1.46 (0.91, 2.34) 1.62 (1.25, 2.10)
Education n : 2,192 d : 421 n : 3,161 d : 719
Junior college and college or higher 0.57 (0.38, 0.85) 0.92 (0.75, 1.12)
High school 0.76 (0.60, 0.97) 0.99 (0.84, 1.17)
Junior high school 1.00 1.00
Marriage n : 2,084 d : 389 n : 3,187 d : 733
Married 1.00 1.00
Except above 1.64 (1.25, 2.15) 1.67 (1.36, 2.04)
Household members n : 2,226 d : 429 n : 3,209 d : 736 Per each additional person 0.96 (0.91, 1.02) 0.92 (0.87, 0.97) Relatives, frequency to meet with n : 1,603 d : 345 n : 2,457 d : 599
Often, sometimes 1.00 1.00
A few, never 0.94 (0.74, 1.19) 0.99 (0.82, 1.20)
Friends, helpful to you n : 2,195 d : 417 n : 3,183 d : 719
Yes 1.00 1.00
No 0.89 (0.73, 1.09) 1.04 (0.90, 1.20)
Participation in social activities n : 2,200 d : 415 n : 3,196 d : 723
Yes 1.00 1.00
No 1.28 (1.05, 1.58) 1.40 (1.19, 1.64)
Religious activities n : 2,196 d : 413 n : 3,256 d : 743
Yes 1.00 1.00
No 0.91 (0.58, 1.43) 0.94 (0.70, 1.27)
Neighborhood to help you n : 2,206 d : 418 n : 3,212 d : 731
Yes 1.00 1.00 No 0.86 (0.71, 1.05) 0.93 (0.80, 1.08) Smoking habit n : 2,215 d : 425 n : 3,237 d : 735 Never 1.00 1.00 Former 1.20 (0.87, 1.65) 0.93 (0.73, 1.19) Current 1.67 (1.30, 2.14) 1.63 (1.36, 1.95) Alcohol consumption n : 2,214 d : 419 n : 3,213 d : 727 Never, light 1.00 1.00 Heavy 1.29 (1.04, 1.60) 1.24 (1.05, 1.46) Physical exercise n : 2,189 d : 410 n : 3,228 d : 733 Often, sometimes 1.00 1.00 Never 1.28 (1.04, 1.58) 1.23 (1.07, 1.42)
BMI, Body Mass index n : 2,255 d : 436 n : 3,261 d : 747
18.5≦BMI<25.0 1.00 1.00 BMI 18.5 1.62 (1.06, 2.47) 1.35 (1.03, 1.77) 25.0≦BMI 0.94 (0.74, 1.20) 0.94 (0.79, 1.13) Chronic diseases n : 2,198 d : 418 n : 3,228 d : 732 No 1.00 1.00 Yes 1.56 (1.29, 1.90) 1.40 (1.21, 1.63) Depression n : 2,284 d : 444 n : 3,304 d : 757
Per each additional score 1.06 (1.03, 1.08) 1.04 (1.02, 1.06) Significance code: *** <0.001, ** <0.01, * <0.05, .<0.1
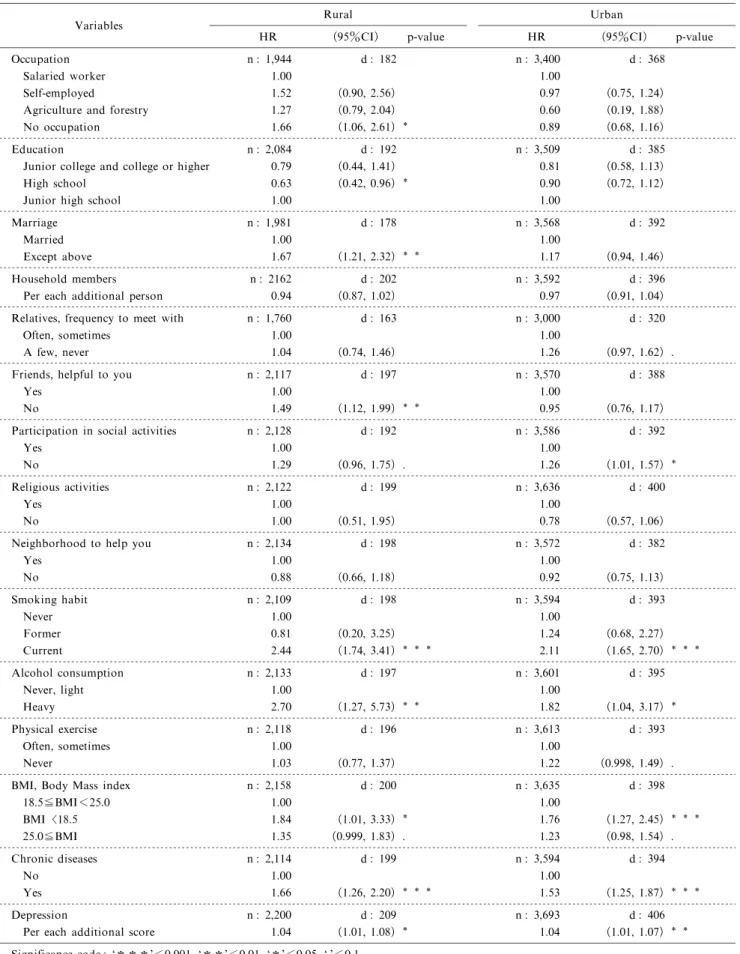
Table 6 Cox proportional hazards model on age-adjusted hazard ratios (HRs)with 95% confidence interval (CI)for all-cause of death in female participants stratified by regions.
Variables Rural HR (95%CI) p-value Urban HR (95%CI) p-value Occupation n : 1,944 d : 182 n : 3,400 d : 368 Salaried worker 1.00 1.00 Self-employed 1.52 (0.90, 2.56) 0.97 (0.75, 1.24)
Agriculture and forestry 1.27 (0.79, 2.04) 0.60 (0.19, 1.88)
No occupation 1.66 (1.06, 2.61) 0.89 (0.68, 1.16)
Education n : 2,084 d : 192 n : 3,509 d : 385
Junior college and college or higher 0.79 (0.44, 1.41) 0.81 (0.58, 1.13)
High school 0.63 (0.42, 0.96) 0.90 (0.72, 1.12)
Junior high school 1.00 1.00
Marriage n : 1,981 d : 178 n : 3,568 d : 392
Married 1.00 1.00
Except above 1.67 (1.21, 2.32) 1.17 (0.94, 1.46)
Household members n : 2162 d : 202 n : 3,592 d : 396 Per each additional person 0.94 (0.87, 1.02) 0.97 (0.91, 1.04) Relatives, frequency to meet with n : 1,760 d : 163 n : 3,000 d : 320
Often, sometimes 1.00 1.00
A few, never 1.04 (0.74, 1.46) 1.26 (0.97, 1.62) .
Friends, helpful to you n : 2,117 d : 197 n : 3,570 d : 388
Yes 1.00 1.00
No 1.49 (1.12, 1.99) 0.95 (0.76, 1.17)
Participation in social activities n : 2,128 d : 192 n : 3,586 d : 392
Yes 1.00 1.00
No 1.29 (0.96, 1.75) . 1.26 (1.01, 1.57)
Religious activities n : 2,122 d : 199 n : 3,636 d : 400
Yes 1.00 1.00
No 1.00 (0.51, 1.95) 0.78 (0.57, 1.06)
Neighborhood to help you n : 2,134 d : 198 n : 3,572 d : 382
Yes 1.00 1.00 No 0.88 (0.66, 1.18) 0.92 (0.75, 1.13) Smoking habit n : 2,109 d : 198 n : 3,594 d : 393 Never 1.00 1.00 Former 0.81 (0.20, 3.25) 1.24 (0.68, 2.27) Current 2.44 (1.74, 3.41) 2.11 (1.65, 2.70) Alcohol consumption n : 2,133 d : 197 n : 3,601 d : 395 Never, light 1.00 1.00 Heavy 2.70 (1.27, 5.73) 1.82 (1.04, 3.17) Physical exercise n : 2,118 d : 196 n : 3,613 d : 393 Often, sometimes 1.00 1.00 Never 1.03 (0.77, 1.37) 1.22 (0.998, 1.49) .
BMI, Body Mass index n : 2,158 d : 200 n : 3,635 d : 398
18.5≦BMI<25.0 1.00 1.00 BMI 18.5 1.84 (1.01, 3.33) 1.76 (1.27, 2.45) 25.0≦BMI 1.35 (0.999, 1.83) . 1.23 (0.98, 1.54) . Chronic diseases n : 2,114 d : 199 n : 3,594 d : 394 No 1.00 1.00 Yes 1.66 (1.26, 2.20) 1.53 (1.25, 1.87) Depression n : 2,200 d : 209 n : 3,693 d : 406
Per each additional score 1.04 (1.01, 1.08) 1.04 (1.01, 1.07) Significance code: *** <0.001, ** <0.01, * <0.05, .<0.1
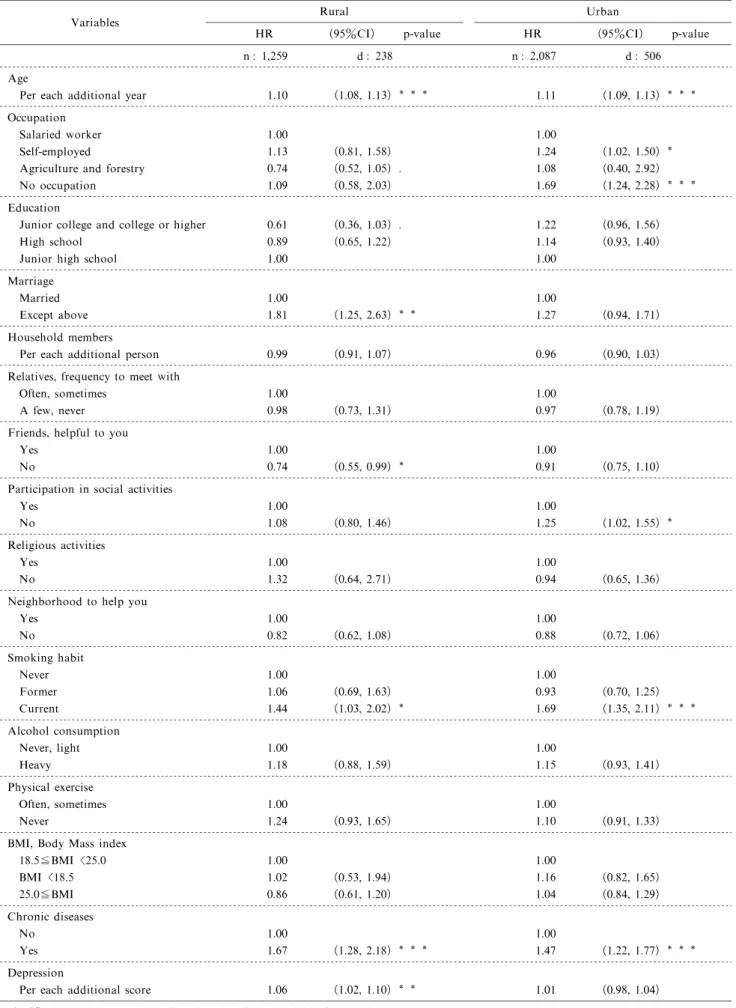
Table 7 Cox proportional hazards model on multivariate hazard ratios (HRs)with 95% confidence interval (CI)for all-cause of death in male participants stratified by regions.
Variables Rural HR (95%CI) p-value Urban HR (95%CI) p-value n : 1,259 d : 238 n : 2,087 d : 506 Age
Per each additional year 1.10 (1.08, 1.13) 1.11 (1.09, 1.13) Occupation
Salaried worker 1.00 1.00
Self-employed 1.13 (0.81, 1.58) 1.24 (1.02, 1.50)
Agriculture and forestry 0.74 (0.52, 1.05) . 1.08 (0.40, 2.92)
No occupation 1.09 (0.58, 2.03) 1.69 (1.24, 2.28)
Education
Junior college and college or higher 0.61 (0.36, 1.03) . 1.22 (0.96, 1.56)
High school 0.89 (0.65, 1.22) 1.14 (0.93, 1.40)
Junior high school 1.00 1.00
Marriage
Married 1.00 1.00
Except above 1.81 (1.25, 2.63) 1.27 (0.94, 1.71)
Household members
Per each additional person 0.99 (0.91, 1.07) 0.96 (0.90, 1.03) Relatives, frequency to meet with
Often, sometimes 1.00 1.00
A few, never 0.98 (0.73, 1.31) 0.97 (0.78, 1.19)
Friends, helpful to you
Yes 1.00 1.00
No 0.74 (0.55, 0.99) 0.91 (0.75, 1.10)
Participation in social activities
Yes 1.00 1.00
No 1.08 (0.80, 1.46) 1.25 (1.02, 1.55)
Religious activities
Yes 1.00 1.00
No 1.32 (0.64, 2.71) 0.94 (0.65, 1.36)
Neighborhood to help you
Yes 1.00 1.00 No 0.82 (0.62, 1.08) 0.88 (0.72, 1.06) Smoking habit Never 1.00 1.00 Former 1.06 (0.69, 1.63) 0.93 (0.70, 1.25) Current 1.44 (1.03, 2.02) 1.69 (1.35, 2.11) Alcohol consumption Never, light 1.00 1.00 Heavy 1.18 (0.88, 1.59) 1.15 (0.93, 1.41) Physical exercise Often, sometimes 1.00 1.00 Never 1.24 (0.93, 1.65) 1.10 (0.91, 1.33)
BMI, Body Mass index
18.5≦BMI 25.0 1.00 1.00 BMI 18.5 1.02 (0.53, 1.94) 1.16 (0.82, 1.65) 25.0≦BMI 0.86 (0.61, 1.20) 1.04 (0.84, 1.29) Chronic diseases No 1.00 1.00 Yes 1.67 (1.28, 2.18) 1.47 (1.22, 1.77) Depression
Per each additional score 1.06 (1.02, 1.10) 1.01 (0.98, 1.04) Significance code: *** <0.001, ** <0.01, * <0.05, .<0.1
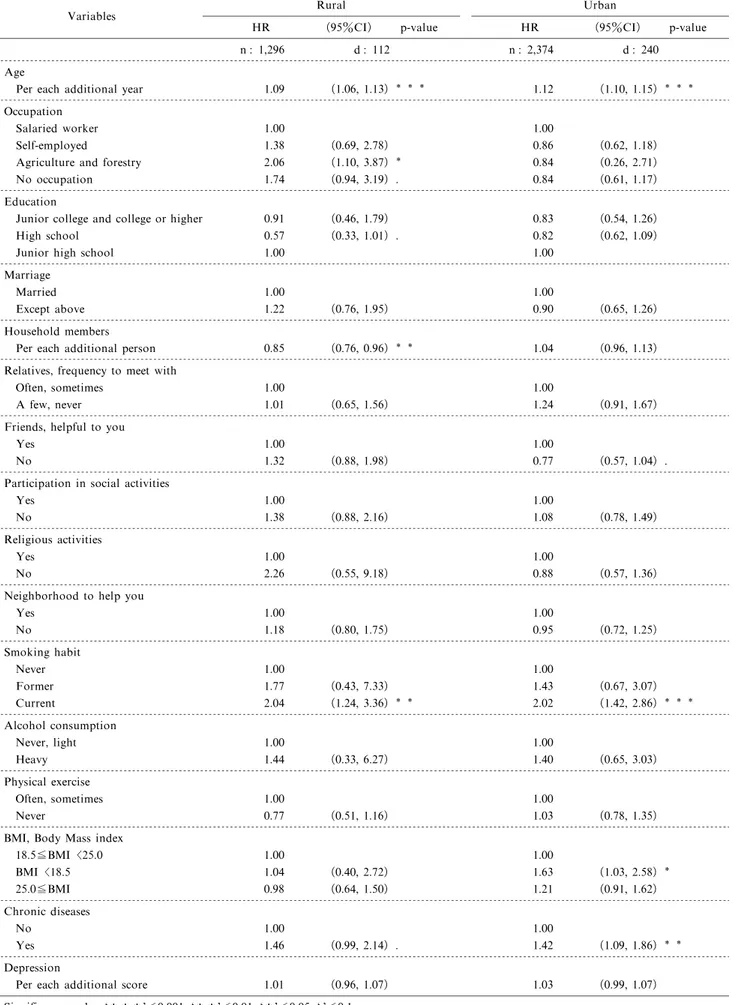
Table 8 Cox proportional hazards model on multivariate hazard ratios (HRs)with 95% confidence interval (CI)for all-cause of death in female participants stratified by regions.
Variables Rural HR (95%CI) p-value Urban HR (95%CI) p-value n : 1,296 d : 112 n : 2,374 d : 240 Age
Per each additional year 1.09 (1.06, 1.13) 1.12 (1.10, 1.15) Occupation
Salaried worker 1.00 1.00
Self-employed 1.38 (0.69, 2.78) 0.86 (0.62, 1.18)
Agriculture and forestry 2.06 (1.10, 3.87) 0.84 (0.26, 2.71) No occupation 1.74 (0.94, 3.19) . 0.84 (0.61, 1.17) Education
Junior college and college or higher 0.91 (0.46, 1.79) 0.83 (0.54, 1.26)
High school 0.57 (0.33, 1.01) . 0.82 (0.62, 1.09)
Junior high school 1.00 1.00
Marriage
Married 1.00 1.00
Except above 1.22 (0.76, 1.95) 0.90 (0.65, 1.26)
Household members
Per each additional person 0.85 (0.76, 0.96) 1.04 (0.96, 1.13) Relatives, frequency to meet with
Often, sometimes 1.00 1.00
A few, never 1.01 (0.65, 1.56) 1.24 (0.91, 1.67)
Friends, helpful to you
Yes 1.00 1.00
No 1.32 (0.88, 1.98) 0.77 (0.57, 1.04) .
Participation in social activities
Yes 1.00 1.00
No 1.38 (0.88, 2.16) 1.08 (0.78, 1.49)
Religious activities
Yes 1.00 1.00
No 2.26 (0.55, 9.18) 0.88 (0.57, 1.36)
Neighborhood to help you
Yes 1.00 1.00 No 1.18 (0.80, 1.75) 0.95 (0.72, 1.25) Smoking habit Never 1.00 1.00 Former 1.77 (0.43, 7.33) 1.43 (0.67, 3.07) Current 2.04 (1.24, 3.36) 2.02 (1.42, 2.86) Alcohol consumption Never, light 1.00 1.00 Heavy 1.44 (0.33, 6.27) 1.40 (0.65, 3.03) Physical exercise Often, sometimes 1.00 1.00 Never 0.77 (0.51, 1.16) 1.03 (0.78, 1.35)
BMI, Body Mass index
18.5≦BMI 25.0 1.00 1.00 BMI 18.5 1.04 (0.40, 2.72) 1.63 (1.03, 2.58) 25.0≦BMI 0.98 (0.64, 1.50) 1.21 (0.91, 1.62) Chronic diseases No 1.00 1.00 Yes 1.46 (0.99, 2.14) . 1.42 (1.09, 1.86) Depression
Per each additional score 1.01 (0.96, 1.07) 1.03 (0.99, 1.07) Significance code: *** <0.001, ** <0.01, * <0.05, .<0.1
rural females had no occupation,as compared to 4.6% of the urban males.
As reported by Iwasaki et al., rural males with-out a spouse had a significantly higher mortality risk in multivariate model. Smith et al. suggested that the detrimental effect of divorce and separation among rural residents might be explained by divorce or sepa-ration being more psychologically and socially damag-ing, given that rural communities regard durable marriages as meeting a desired standard of social behavior. This might not be as important to an urban community, where marriage failure is more common. House et al. suggested that becoming widowed is more detrimental for males than for females.
Iwasaki et al. reported that one notable finding was the negative relationship between neighborhood and mortality in the rural males. This finding matches with the finding by recent social epidemiologic studies that social capital can prevent disease and/or mortality. However, in our results, there was no significantly decreased risk between neighborhood and the age-adjusted mortality,although rural males not having helpful friends had a signifi-cantly decreased risk in the multivariate model. Beggs et al. reported the following features of personal networks in the rural area: greater intensive ties,based more on kinship, and smaller and denser than the personal networks in the urban area. Shimada et al. found that Japanese rural communities had strong neighborhood relationships in which all members are required to help others, take part in their duties, and play their roles regardless of their personal preferences. According to Katsura et al., Japanese middle-aged rural residents recognized daily trivial relationships with neighbors as stressful. Stress with inadequate social relations has a harmful effect on health and welfare. The plausible explanation for the controver-sial relationships between neighborhood and mortality in rural males can be that among rural males, the absence of good fellowship with neighbors may become less stress-free,but the absence of close friends might become more stress-free after all variables are adjusted.
Conclusions
The authors found that the middle educational level among rural females had the lowest age-adjusted mortality risk, following a U-shaped risk pattern. This U-shaped risk pattern was observed in the inci-dence of total stroke among Japanese females from the JPHC Cohort I Study. This risk pattern might relate to the highest age-adjusted death rate of profes-sional occupations among working females.
The rural female workers in agriculture and for-estry had a significantly higher risk while rural males had a lower risk in the same occupation in the multivariate model. The mortality risk factors of Japanese females might differ from those of males. The reasons for these results are unclear in our study. More research might be needed in the other cohorts.
Males who were not married or did not participate in social activities had significantly higher risks of mortality. Among females, unmarried subjects had significantly higher risks but only in the rural group, and the subjects who did not participate in social activities had significantly higher risks only in the urban group. The subjects without close friends had significantly higher risks in the rural females. House-hold size tended to reduce the risk of mortality as the number of additional persons living with increased, but this trend was significant only in males living in the urban area. Numbers of contacts with relatives, going to any religious activities, and good fellowship with neighbors were not significantly associated with age-adjusted relative risks. All lifestyle and health status variables (except physical exercise among females) were significantly associated with age-adjusted relative risks across both areas and genders. Lack of physical exercise was not a significant risk for females.
Acknowledgments
This research was supported by a grant from the NPO of International Eco-Health Research Group, Isesaki City, Gunma, Japan. We thank the mayors and the staff of Shibukawa City and Isesaki City for their supports.
References
1. Cassel J. The contribution of the social environment to host resistance: the Fourth Wade Hampton Frost Lecture. Am J Epidemiol 1976; 104: 107-123.
2. Cobb S. Social support as a moderator of life stress. Psychosomatic Med 1976; 38: 300-314.
3. Broadhead WE, Kaplan BH, James SA, et al. The epidemiologic evidence for a relationship between social support and health. Am J Epidemiol 1983; 117: 521-537.
4. House JS, Landis KR, Umberson D. Social relationships and health. Science 1988; 241: 540-545.
5. Berkman LF, Syme SL. Social networks, host resistance, and mortality: a nine-year follow-up study of Alameda county residents. Am J Epidemiol 1979 ; 109 : 186-204. 6. Berkman LF, Breslow L. Health and ways of living :
Alameda County Study. New York : Oxford University Press, 1983.
7. House JS, Robbins C, Metzner HL. The association of social relationships and activities with mortality: prospec-tive evidence from the Tecumseh Community Health Study. Am J Epidemiol 1982; 116: 123-140.
8. Schoenbach VJ,Kaplan BH,Fredman L,et al. Social ties and mortality in Evans County,Georgia. Am J Epidemiol 1986; 123: 577-591.
9. Suzuki S. Rojin no QOL o kitei suru shinri-shakai yoin no nichi-bei hikaku (Psychosocial factors of QOL of the Aged in Japan and USA 1999-2001). Report of the Grant-in-Aid for Scientific Research (No 11694243),by the Minis-try of Education and Science, Japan, 2001 (Abstract in English).
10. Iwasaki M, Otani T, Ohta A, et al. Rural-urban differ-ences in sociodemographic, social network and lifestyle factors related to mortality of middle-aged Japanese men from the Komo-Ise Cohort Study. J Epidemiol 2002; 12: 93-104.
11. Statistics Bureau,Ministry of Internal Affairs and Commu-nications,the Government of Japan. Population Census of Japan 1995, Vol. 2-2-10, Gunma-Ken. Tokyo, 1996. 12. Ohta A, Aoki S, Takeuchi K, et al. Lifestyle and
sociodemographic risk factors for death among middle-aged and elderly residents in Japan from a five-year follow-up cohort study. J Epidemiol 2001; 11: 134-143.
13. Suzuki S, Aoki S, Yanai H(eds). THI handobukku : Todai-shiki ji-ki shitsumon-shi kenko chosa no susume-kata (THI handbook : How to use the THI, the Todai Health Index). Tokyo : Shinohara Shuppan, 1989 (in Japanese). 14. Suzuki S, Roberts RE(eds). Methods and applications in mental health surveys: The Todai Health Index. Tokyo : University of Tokyo Press, 1991.
15. Kawada T, Kubota F, Ohnishi N, et al. Yokuutu jotai hyoka no tame no kan-i sukuriningu tesuto no yukosei (Validity of screening test for the evaluation of depressive state). Sangyo Igaku (Jpn J Ind Health) 1992; 34: 576-577 (in Japanese).
16. Kawada T, Suzuki S,Kubota F,et al. Content and cross validity of the Todai Health Index Depression Scale in relation to the Center for Epidemiologic Studies Depression Scale and the Zung Self-rating Depression Scale. J Occup Health 1999 ; 41: 154-159.
17. Ito S,Takachi R,Inoue M,et al. Education in relation to incidence of and mortality from cancer and cardiovascular disease in Japan. Eur J Public Health 2008; 18: 466-472. 18. Honjo K, Iso H, Inoue M, et al. Education, social roles, and the risk of cardiovascular disease among middle-aged
Japanese women,the JPHC Study Cohort I. Stroke 2008; 39 : 2886-2890.
19. Torssander J, Erikson R. Marital partner and mortality: the effects of the social positions of both spouses. J Epidemiol Community Health 2009 ; 63: 992-998. 20. Liu SY, Kawachi I, Glymour MM. Education and
in-equalities in risk scores for coronary heart disease and body mass index: Evidence for a population strategy. Epidemiol. 2012; 23: 657-664.
21. R Development Core Team (2011). R : A language and environment for statistical computing. R Foundation for Statistical Computing, Vienna, Austria. ISBN 3-900051-07-0, URL http ://www.R-project.org/.
22. Smith MH,Anderson RT,Bradham DD,et al. Rural and urban differences in mortality among Americans 55years and older: analysis of the national longitudinal mortality study. J Rural Health 1995; 11: 274-285.
23. Kosei Rodo Tokei Kyokai(ed). Kokumin eisei no doko 2012/2013: Tokeihyo, Dai 17 hyo Jinko dotai syokugyo-betu soran (Occupational vital statistics). Tokyo : Kosei Rodo Tokei Kyokai, 2012: 410 (in Japanese).
24. Cavelaars AEJM, Kunst AE, Geurts JJ, et al. Morbidity differences by occupational class among men in seven European countries: an application of the Erikson-Goldthorpe social class scheme. Int J Epidemiol 1998; 27: 222-230.
25. Ohta A, Takeuchi K, Sasazawa Y, et al. Differences in lifestyle and perceived health in different occupations in a community. J Occup Health 1998; 40: 325-333. 26. Hart N. Inequalities in health : the individual versus the
environment. J R Statist Soc A 1986; 149 : 228-246. 27. Beggs JJ, Haines VA, Hurlbert JS. Revisiting the
rural-urban contrast: personal networks in nonmetropolitan and metropolitan settings. Rural Sociology 1996; 61; 306-325.
28. Shimada K(ed). Kinrin shakai no ningen kankei (Human relationship in neighborhood). Tokyo : Buren Shuppan, 1988 (in Japanese).
29. Katsura T,Nojiri M,Nakano M. A basic study on aging and stress: Stress appraisal in rural inhabitants of middle and advanced age. Nippon Noson Igakukai Zasshi (J Japanese Association of Rural Medicine) 1996; 45: 483-492 (Abstract in English).