journal or
publication title
International review of business
number
18
page range
103-121
year
2018-03
1. Introduction
The calculation of defined benefit obligations and defined benefit liability include a number of forecasts, such as mortality rates, discount rates, and the average life time of employees. The changes in these assumptions increase or decrease the amount of defined benefit obligations and defined benefit liability. Therefore, the calculation of defined benefit obligations and defined benefit liability introduces both uncertainty and volatility to firms’ financial statements. In addition, the effect of defined benefit obligations on financial statements is quite significant. On average, for Japanese listed firms, the ratio of defined benefit obligations to total liabilities is about 20% or above, and the ratio of defined benefit liability to total liabilities is about 10%.
The Relationship between a Reduction in Defined Benefit Obligations
and the Financial Condition of the Firm
Eriko KASAOKA*
Abstract
One of the most important issues for firms with defined benefit plans is how to reduce the risks on pension asset management. The effect of defined benefit obligations on financial statements is quite significant. On average, for Japanese listed firms, the ratio of defined benefit obligations to total liabilities is about 20% or above; for defined benefit liability to total liabilities, it is about 10%. There are several ways to decrease the amount of defined benefit obligations: (1) termination of the defined benefit plan, (2) a change of the defined benefit plan to a defined contribution plan, (3) return of a substitutional part of Employees’ Pension Fund to the government, (4) curtailments and plan amendments, and (5) changes in actuarial assumptions. This paper investigates if firms with higher leverage and liquidity, and lower profitability, cash flows and pension funding status, and other financial measures tend to decrease the amount of defined benefit obligations to reduce the negative effect of defined benefit plans on financial statements from fiscal 2009 to 2015. The result shows that firms with higher liquidity, lower profitability, sales growth and retained earnings, and a higher proportion of pension components to financial statements, tend to decrease their amounts of defined benefit obligations.
Keywords: defined benefit obligations, defined benefit liability, defined benefit cost, pension funding status, actuarial assumptions
To reduce the effect of defined benefit plans on financial statements, firms attempt to reduce the amount of defined benefit obligations. There are several ways to decrease the amount of defined benefit obligations: (1) termination of the defined benefit plan, (2) a change of the defined benefit plan to a defined contribution plan, (3) return of a substitutional part of Employees’ Pension Fund to the government, (4) curtailments and plan amendments, and (5) changes in actuarial assumptions. This paper investigates if firms’ financial factors ― including leverage, liquidity, profitability, cash flows, pension funding status, pension components, and others ― affect the reduction in defined benefit obligations. We hypothesize that firms with higher leverage and liquidity, and lower profitability, cash flows and pension funding status, and other financial ratios tend to decrease the amount of defined benefit obligations to reduce the negative effect of defined benefit plans on financial statements.
2. Reduction in Defined Benefit Obligations
A defined benefit plan is a retirement plan which guarantees a certain amount of pension payment for pensioners at their retirement. Firms face various risks in managing their pension funds for their employees. To reduce the risks on pension fund management, firms can curtail, amend, or terminate their defined benefit plans, change their defined benefit plans to defined contribution plans, or return a substitutional part of employees’ pension fund to the government. A change in actuarial assumptions for the calculation of defined benefit obligations can also decrease the amount of defined benefit obligations.
2.1 Termination of the Defined Benefit Plan
There were two types of defined benefit plans, employees’ pension fund and the tax-qualified pension plan, before the defined-benefit corporate pension was introduced in 2002. The tax-qualified pension plan was based on the Order for Enforcement of the Corporation
Tax Act, and firms would enjoy tax benefits when adopting that plan. However, this plan was abolished in fiscal 2011, because employees’ grants of vesting were not defined clearly, and the plan did not provide for the protection of their pension assets. Firms with this plan transferred their pension assets to one of the other pension plans or terminated their plans by fiscal 2011. Less than 1% of the plans were transferred to employees’ pension fund; about 50 % went to defined-benefit corporate pension; 9% to defined-contribution pension; and 20% to the smaller enterprise retirement allowance mutual aid system. About 20% were terminated1. Therefore, there were firms that terminated their defined benefit plans and had 1 Ministry of Health, Labour and Welfare, “Trend of Tax-Qualified Pension Plan,” http://www.mhlw.go.jp
no retirement benefit plan for their employees.
Data from the National Personnel Authority shows that 7.2% of firms have no corporate retirement benefit plan for their employees based on the questionnaire results of 41,314 Japanese firms in 2016. The fewer the number of employees the firm has, the more likely it is to have no corporate retirement plan2. With regard to employees’ pension fund, between 1 and 92 funds dissolved their plans each year in the fiscal 1997 to 2014 period. The revision of the Employees’ Pension Insurance Act in 2013 induced firms to dissolve their plans or transfer the substitutional part of the employees’ pension fund to the government. The number of firms dissolving their plans rose to 175 in fiscal 20153. To avoid the risks entailed by pension fund management, there is a possibility that these firms decided they would not provide any pension plans to their employees after the dissolution of the employees’ pension fund.
2.2 A Change of the Defined Benefit Plan to a Defined Contribution Plan
Firms with defined benefit plans have to measure and recognize defined benefit obligations, plan assets, defined benefit liability, unrecognized obligations, and defined benefit cost on their financial statements. They incur risk in managing their pension funds, and the funding status of the plans are recognized on the balance sheet. On the other hand, a defined contribution plan is a retirement plan where a firm pays a certain amount of money to its employees, and they bear the responsibility of managing their plan assets. Firms recognize only their contribution to their employees as defined benefit cost on their financial statements. Pension fund management has no impact on the balance sheet of firms with defined contribution plans.
As explained above, by fiscal 2011, some 9% of tax-qualified pension plans were transferred to defined-contribution pension, and 20% to the smaller enterprise retirement allowance mutual aid system. Figure 1 shows that the numbers of contracts and pensioners in defined-contribution pension plans increase every year after this plan type was introduced in 2001. Firms adopt defined contribution plans to reduce the risks of pension asset management.
2 National Personnel Authority, “Table 7 Current Status of Corporate Pension Plans and Retirement
Lump Sum Grants in Private Firms,” http://www.e-stat.go.jp/SG1/estat/GL08020103.do?_toGL08020103_ &tclass ID=000001090742&cycleCode=0&requestSender=search.
6,000 5,000 4,000 3,000 2,000 1,000 0 Contracts Year Pensioners (thousands) 2001 2002 2003 2004 2005 2006 2007 2008 2009 2010 2011 2012 2013 2014 2015
2.3 Return of a Substitutional Part of Employees’ Pension Fund to the Government
There are currently two defined benefit plans that corporate employees can have: employees’ pension fund and defined-benefit corporate pension. The employees’ pension fund is a specific defined benefit plan in Japan. The fund is a corporation approved under the Employees’ Pension Insurance Act, which is administered by the Ministry of Health, Labour and Welfare. Firms having this fund manage a part of the government pension fund as their employees’ pension fund. Figure 2 shows the structure of the employees’ pension system (government pension fund) and employees’ pension fund.
The pension asset amount belonging to the fund consists of the substitutional part and the firm-specific part. The substitutional part is a part of the old-age employees’ pension system provided by the Japanese government. Firms manage this portion instead of the government. The Defined-Benefit Corporate Pension Act was passed in June 2001, and effective from April 2002. With the introduction of the act, firms are allowed to transfer the substitutional part of their employees’ pension fund to the government, and the firm-specific part to defined-benefit corporate pension.
In addition, the Employees’ Pension Insurance Act was revised in 2013, and Act No.63 of 2013: the Revision of Employees’ Pension Insurance Act for the Securement of Health
and Reliability in Public Pension System (Act No.63) was issued. The act states that firms are not allowed to establish any new employees’ pension funds after April 2014, and unsound funds have to be dissolved or transferred to other corporate pension plans (Act No.63, pars.1, 33). Many firms have dissolved their funds or changed to other corporate
Source: Ministry of Health, Labour and Welfare, “The Number of Contracts in Defined-Contribution Pension Plans,” http://www.mhlw.go.jp/stf/seisakunitsuite/bunya/nenkin/nenkin/kyoshutsu/ kiyakusu.html.
Employees with Employees’ Pension Fund) Substitutional Part Paid by Japanese Government
The Old-Age Employees’ Pension System (Wage Indexation and Price
Indexation) The National Pension Scheme
(the Old-Age Basic Pension)
Employees without Employees’ Pension Fund)
Paid by the Fund The Employees’ Pension System
(the Old-Age Employees’ Pension System)
Paid by Japanese Government The National Pension Scheme
(the Old-Age Basic Pension)
Firm-Specific Part
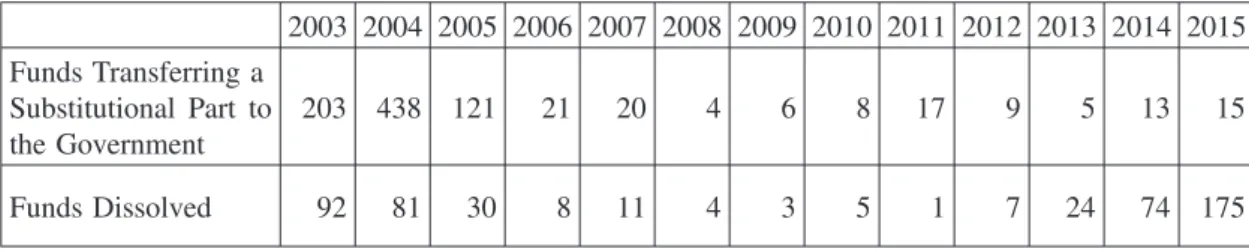
Table 1. The Number of Funds Dissolved or Transferring a Substitutional Part to the Government
2003 2004 2005 2006 2007 2008 2009 2010 2011 2012 2013 2014 2015 Funds Transferring a Substitutional Part to the Government 203 438 121 21 20 4 6 8 17 9 5 13 15 Funds Dissolved 92 81 30 8 11 4 3 5 1 7 24 74 175
Source: Pension Fund Association (2017). Basic Data on Corporate Pension, p.96.
pension plans, and returned their substitutional part to the government. Table 1 shows the number of funds dissolved or transferring a substitutional part to the government from fiscal 2003 to 2015.
There were 1,883 funds in fiscal 1996. The number of funds decreases every year, and
there are only 256 funds in fiscal 20154. Firms that are dissolved or transfer the
substitutional part to the government attempt to diminish their pension asset management risks coincident with the reduction of defined benefit obligations.
2.4 Curtailments and Plan Amendments
International Accounting Standard No.19: Employee Benefits (IAS19) states that a plan 4 Ibid., p.96
Source: Ministry of Health, Labour and Welfare, “Overview of the Corporate Pension,”http://www. mhlw.go.jp/english/org/policy/dl/p36-37p4.pdf, p.5.
curtailment occurs when a firm significantly reduces the number of employees covered by a plan (IAS19, par.105). Therefore, the firm’s defined benefit obligations are reduced.
A plan amendment occurs when a firm amends the terms of the defined benefit plan.
Enforcement Regulation on Defined-Benefit Corporate Pension Act states that, in principle, a firm shall not lower the level of retirement benefits when it changes the benefit design; however, a firm is allowed to reduce the benefits payable for the employees under certain conditions. The following conditions are included (Enforcement Regulation on
Defined-Benefit Corporate Pension Act, par.5):
(a) a firm changes the labor contract or regulations on retirement benefits, and redesigns the benefits;
(b) a firm’s financial condition becomes significantly worse;
(c) the contribution to the pension fund would significantly increase; or
(d) it is necessary for a firm to redesign the benefits payable due to the merger of funds, and continuation of rights and obligations.
The regulation also states that when a firm reduces the amount of benefits payable, it has to obtain agreement from (a) a labor union organized by more than a third of participants in the defined benefit plan, and (b) at least two-thirds of all participants or the labor union organized by more than two-thirds of participants (Enforcement Regulation on
Defined-Benefit Corporate Pension Act, par.6.1). A firm also has to follow a certain procedure to reduce the amount of benefits for beneficiaries. Therefore, a firm can reduce the amount of defined benefit obligations through plan amendment when they satisfy these requirements.
2.5 Changes in Actuarial Assumptions
To calculate defined benefit obligations, firms make many assumptions, because the accounting standards for retirement benefits require firms to estimate how much they have to make payments in the future of employee benefits for their employees. These assumptions include mortality, rates of employees’ turnover, discount rates, rates of future salary increase, or expected rates of return on plan assets. Japanese accounting standards for retirement benefits require firms to disclose discount rates and expected rates of return on plan assets on their financial statements. An increase or decrease in the discount rate or the expected rate of return on plan assets has significant effects on a firm’s financial statements. As for the discount rate, an increase in the rate decreases the amounts of defined benefit obligations and defined benefit cost.
IAS19 requires firms to disclose sensitivity analysis on actuarial assumptions. The sensitivity analysis shows how much the amount of defined benefit obligations or defined benefit cost would be changed by a decrease or increase in the discount rate by the firm. In fiscal 2015, 85 firms have adopted International Financial Reporting Standards (IFRS) in
Japan. Twenty-one of them which adopt a defined contribution plan, a multi-employer plan, or no pension plan do not disclose any actuarial assumptions on their financial statements. Excepting these firms, most firms disclose the sensitivity analysis on the effect of changes in discount rates on the amount of defined benefit obligations. Their financial statements show that firms decrease the amount of defined benefit obligations by 5.9% on average when firms increase their discount rates by 0.5%. In contrast, they increase the amount of defined benefit obligations by 6.3% when they decrease their rates by 0.5%. Therefore, changing actuarial assumptions has a significant effect on the amount of defined benefit obligations.
The underfunded pension status of firms is a serious problem in Japan, i.e., firms do not allot sufficient funds for employees after their retirement. Retirement benefits have an important role in the financial security of employees after retirement. Most firms with defined benefit plans have underfunded status. Their status is disclosed as a defined benefit liability on the balance sheet, and has a negative impact on a firm’s valuation. The aim of this paper is to reveal whether those firms which have worse leverage, liquidity, profitability, pension funding status, and a higher proportion of pension components to financial statements tend to decrease the amount of defined benefit obligations owing to the significant effect of pension items on financial statements, and the uncertainty and volatility in the calculation of defined benefit obligations.
3. Related Research
There are several researches suggesting pension components including defined benefit obligations, plan assets, defined benefit liability, or defined benefit cost disclosed on firms’ financial statements have an effect on stock prices (Barth (1991), Barth, et al. (1993), Okumura (2005), Picconi (2006), Hann, et al. (2007), and Yu (2013)). Pension components are important factors for shareholders to evaluate firms. Therefore, firms might attempt to decrease the amounts of these pension components to reduce the impact on their valuations.
As explained in Section 2, there are several ways to reduce the amount of pension components, especially defined benefit obligations. With regard to the termination of defined benefit plans, there is research which discusses the relationship between a firm’s pension plan termination and the stock price (Alderson and Chen (1986), VanDerhei (1987), Haw, et al. (1988), Mitchell and Mulherin (1989), Mittelstaedt and Regier (1993), and Hsieh and Ferris (1994)). These research studies indicate that the market reacts positively when a firm announces to terminate or actually does terminate the defined benefit plan. Their sample firms have overfunded status in their defined benefit plans, and it is expected that the defined benefit plan termination leads to a wealth transfer from plan participants to shareholders. In addition, Mittelstaedt and Regier (1993) mention that the market shows a
positive reaction when defined-benefit coverage is ended, and not when it is continued. Hsieh, et al. (1990) use firms with both overfunded and underfunded status on their defined benefit plans as their samples, and examine the relationship between a firm’s pension plan termination and the reaction of securities markets. They find that significant positive abnormal returns are observed for firms with both overfunded and underfunded status owing to their pension plan termination. However, with consideration of a firm’s financial condition, significant abnormal returns are observed only for firms financially distressed.
Stone (1987), Mittelstaedt (1989), Thomas (1989), Haw, et al. (1991), and Alderson and VanDerhei (1992) examine if a firm’s financial stress affects the termination of a firm’s defined benefit plan with overfunded status. All conclude that a firm’s financial weakening has an effect on the determination of the pension plan termination. Thomas (1989) indicates that declining cash flows from operating activities motivate firms to terminate their defined benefit plans rather than other factors, including tax, accounting, or wealth transfer. The large, unexpected declines in cash flows are observed prior to the year of termination. The study also reveals that terminating firms with no control change have lower profitability, higher leverage, and lower cash flows from operating activities than the nonterminating firms.
As for changing from defined benefit plans to defined contribution plans, Stone (1991) investigates whether firms changing their pension plans to defined contribution plans after asset recaptures are more financially stressed than firms continuously adopting defined benefit plans after recaptures. This study uses three indicators for financial stress: (1) dividend paying ability, (2) financial stress score, and (3) firm-specific news. More of the firms switching to defined contribution plans are not able to pay dividends, are financially stressed, and engage in difficult debt restructuring.
There is also a relationship between transferring a substitutional part of employees’ pension fund to the government and a firm’s financial stress. ASBJ Guidance No.25:
Guidance on Accounting Standard for Retirement Benefits (ASBJ Guidance 25) states that when a firm returns the substitutional part to the government, the difference between the amount of the substitutional part and the minimum actuarial reserve is recognized as extraordinary income (ASBJ Guidance 25, par.46). In addition, the reduction of defined benefit obligations for the substitutional part leads to a decrease of defined benefit cost. Ueno (2007) mentions that there are two reasons a firm transfers a substitutional part to the government: (1) when a firm’s corporate performance becomes worse, and (2) when a firm’s defined benefit cost amount impairs corporate performance. The study concludes that firms transferring a substitutional part to the government have, compared with other firms, a higher proportion of current service cost to sales, and of unrecognized actuarial gain or loss to sales. This conclusion indicates that firms transferring a substitutional part to the
government return it to reduce the negative effect on their corporate performance.
With regard to curtailments, Klumpes, et al. (2009) examine if firms with lower pension funding status and higher defined benefit cost tend to curtail their defined benefit plans more than those with higher funding status and lower defined benefit cost. They also include leverage in their model. Their results show that firms decide to curtail their defined benefit plans owing to the strategic corporate risk management considerations.
Finally, changes in several actuarial assumptions, especially discount rates, decrease or increase the amount of defined benefit obligations. Adopting a higher discount rate leads to firms’ decreasing the amount of defined benefit obligations. Bauman and Shaw (2014) show that 40 firms disclosing their sensitivity analysis on discount rates cut the amount of defined benefit obligations by 4.4% on average when they increase their discount rates by 1.0%. Gopalakrishnan and Sugrue (1995), Newell, et al. (2002), Okumura (2005), and Lew (2009) suggest that firms whose pension funding status is lower tend to choose higher discount rates. Gopalakrishnan and Sugrue (1995) and Okumura (2005) also include leverage for their models, and they conclude that firms with higher leverage choose higher discount rates. Godwin, et al. (1996) explain that managers use their actuarial assumptions for earnings management, and their dividend restrictions, profitability, leverage, and tax benefits of pension plans have an impact on the determination of actuarial assumptions. Okumura (2005) also indicates that pension components disclosed on financial statements increase the value relevance of disclosed information.
Prior research indicates that a reduction in defined benefit obligations has a positive effect on firms’ financial statements, and their valuations as a result. Therefore, managers are motivated to curtail, amend, or terminate their defined benefit plans, change to other pension plans, or change their actuarial assumptions. Therefore, this paper will investigate if firms reducing their defined benefit obligations have worse financial conditions, financial results, pension funding status, and other financial indicators.
4. Research Methodology
Prior research studies explained in Section 3 include leverage, liquidity, profitability, cash flows, pension funding status, pension components, and some other items in their models. A decline in defined benefit obligations also decreases defined benefit cost. It would improve a firm’s financial condition and results.
Leverage (LEV) is an important factor for examining a firm’s capital structure and capital risk. In this study, the debt to equity ratio is employed for this purpose. Stone (1987), Mittelstaedt (1989), Thomas (1989), Gopalakrishnan and Sugrue (1995), Godwin, et al. (1996), Okumura (2005), Hann, et al. (2007), and Ueno (2007) include leverage in their models. With the exception of Ueno (2007), they conclude that leverage has an effect on a
firm’s stock price or the termination of its defined benefit plan. Gopalakrishnan and Sugrue (1995) and Godwin, et al. (1996) show that firms with higher leverage tend to adopt higher discount rates to decrease the amount of defined benefit obligations. We also employ liquidity (LIQ) which is calculated by current liabilities divided by current assets. The ratio expresses a firm’s ability to pay its short-term obligations. Stone (1991) indicates firms switching their defined benefit plans to defined contribution plans have been less solvent than those continuing defined benefit plans. Liquidity is added as an independent variable to determine if a firm has financial stress and decide whether to decrease the amount of defined benefit obligations.
ROA is adopted for profitability (PROF). The defined benefit cost is recognized in operating expense; therefore, operating income is used to calculate ROA. Firms with less profitability might decrease the amount of defined benefit obligations and defined benefit cost to increase the ratio. Thomas (1989), Mittelstaedt (1989), Barth, et al. (1993), Gopalakrishnan and Sugrue (1995), Godwin, et al. (1996), Okumura (2005), Hann, et al. (2007), and Yu (2013) show the effect of profitability on a firm’s stock price, the termination of defined benefit plans, or the change in discount rate. They all recognize the impact of profitability on one of these.
Reducing defined benefit obligations lowers defined benefit cost and the cash contribution to the plan. The amount of cash flows from operating activities (CASH) would increase after the reduction of defined benefit obligations. Firms with less cash flows might decrease the amount of defined benefit obligations to increase cash flows in the future. VanDerhei (1987) demonstrates that firms terminating their defined benefit plans have a lower ratio of cash flows to total debt. However, Godwin, et al. (1996) show there is no relationship between change in cash flows and the per-share income effect of a change in actuarial assumption.
Pension components including pension funding status (FUND), the ratio of defined benefit obligations to total liabilities (DBO), defined benefit cost to sales (DBC), and unrecognized obligations to net assets (UO) are considered in this study. Pension components― including defined benefit obligations, defined benefit cost, and unrecognized obligations ― have a significant effect on financial statements. As explained above, for Japanese listed firms, the ratio of defined benefit obligations to total liabilities is about 20% or above; for defined benefit liability to total liabilities, it’s about 10%. Barth, et al. (1993), Gopalakrishnan and Sugrue (1995), Okumura (2005), Hann, et al. (2007), Ueno (2007), and Yu (2013) indicate the relationship between the firm’s pension components and its stock price, the termination of defined benefit plans, or the change in discount rate. Firms would decrease the amount of defined benefit obligations to reduce the impact of these components on financial statements.
Therefore, the following hypotheses are employed in this research:
H1: Firms with higher leverage and liquidity, and lower profitability, cash flows and pension funding status are more likely to decrease the amount of defined benefit obligations. H2: Firms with larger effects of pension components on their financial statements are more
likely to decrease the amount of defined benefit obligations.
Other factors including sales growth (SALES), working capital (WC), retained earnings (RE), tax paying status (TAX), earnings per share (EPS), and firm size (SIZE) are also employed as control variables. These factors are included in several prior research studies (Mittelstaedt (1989), Thomas (1989), Stone (1991), Godwin, et al. (1996), Okumura (2005), and Yu (2013)).
To examine if firms with higher leverage and liquidity, and lower profitability, cash flows and pension funding status, and other financial ratios, as well as a higher proportion of pension components on financial statements, tend to decrease the amount of defined benefit obligations, we employ a logistic regression model. The dependent variable equals 1 if the firm decreases the amount of defined benefit obligations from the previous year, and 0 otherwise. The regression model is shown as follows:
Reduction in Defined Benefit Obligationst=
β0+ β1LEVt−1 + β2LIQt−1 + β3PROFt−1+ β4CASHt−1 + β5FUNDt−1 + β6DBOt−1
+ β7DBCt−1 + β8UOt−1 + β9SALESt−1 + β10WCt−1 + β11REt−1 + β12TAXt−1 + β13EPSt−1 + β14SIZEt−1 + Year Dummy + Industry Dummy + ε
When firms curtail, amend, or terminate their defined benefit plans, change them to defined contribution plans, or transfer a substitutional part to the government, it takes time to make the decision. Therefore, the data for independent variables used are one year before the year when firms reduce their defined benefit obligations.
5. Sample Selection and Descriptive Statistics
This empirical research uses seven years of data from annual reports. The time period of this study is from fiscal 2009, when the accounting standards for retirement benefits stated that firms could change their discount rates every year, through the latest year (i.e., fiscal 2015), for which data are available.
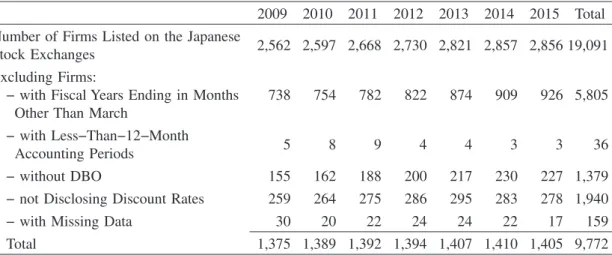
Table 2 shows the number of firms which are treated in our empirical analysis. Firms (excluding banks and insurance firms) listed on the Japanese stock exchanges and adopting Japanese accounting standards are selected in this sample. Firms with fiscal years ending in months other than March, less-than-12-month accounting periods, not disclosing defined benefit obligations and discount rates are eliminated from the sample, and 9,772 firms
Table 2. Sample Selection
2009 2010 2011 2012 2013 2014 2015 Total Number of Firms Listed on the Japanese
Stock Exchanges 2,562 2,597 2,668 2,730 2,821 2,857 2,856 19,091
Excluding Firms:
− with Fiscal Years Ending in Months Other Than March
738 754 782 822 874 909 926 5,805
− with Less−Than−12−Month
Accounting Periods 5 8 9 4 4 3 3 36
− without DBO 155 162 188 200 217 230 227 1,379
− not Disclosing Discount Rates 259 264 275 286 295 283 278 1,940
− with Missing Data 30 20 22 24 24 22 17 159
Total 1,375 1,389 1,392 1,394 1,407 1,410 1,405 9,772
Table 3. Descriptive Statistics
Reduction
in DBO LEV LIQ PROF CASH FUND DBO DBC UO SALES WC RE TAX EPS SIZE Mean 0.383 1.763 0.685 0.054 0.137 0.519 0.266 0.010 0.031 1.015 0.186 0.299 0.285 0.161 4.890 Median 0.000 1.223 0.617 0.049 0.120 0.539 0.182 0.009 0.011 1.014 0.186 0.284 0.270 0.145 4.798 Std. Dev. 0.486 1.878 0.426 0.044 0.167 0.338 0.272 0.009 0.068 0.154 0.118 0.214 2.875 0.171 0.629 Min 0.000 0.038 0.034 −0.392 −1.764 0.000 0.001 −0.242 −0.335 0.293 −0.366 −3.327 −70.600 −1.338 2.751 Max 1.000 45.553 6.910 0.447 2.661 2.695 2.887 0.133 1.097 3.479 0.766 1.110 77.733 3.881 7.232 LEV = (total liabilitiest−1− defined benefit liabilityt−1)/(net assetst−1+ unrecognized obligationst−1)
LIQ = current liabilityt−1/current assetst−1
PROF = (operating incomet−1+ defined benefit costt−1)/(total assetst−1− defined benefit assetst−1)
CASH = (cash flows from operating activitiest−1− increase (decrease) in provision for retirement beneitst−1)/(net assetst−1+ unrecognized obligationst−1)
FUND = plan assetst−1/defined benefit obligationst−1
DBO = defined benefit obligationst−1/(total liabilitiest−1− defined benefit liabilityt−1) DBC = defined benefit costt−1/(operating incomet−1+ definec benefit costt−1) UO = unrecognized obligatiosnt−1/(net assetst−1+ unrecognized obligationst−1) SALES = (salest−1− salest−2)/salest−2
WC= (accounts receivablet−1 + notes receivablet−1 + inventoryt−1 + other current assetst−1) − (accounts payablet−1 + notes payablet−1+ other current liabilitiest−1)/(total assetst−1− defined benefit assetst−1)
RE = retained earningst−1/(total assetst−1− defined benefit assetst−1)
TAX = (income taxest−1+ defined benefit costt−1*40% − changes in deferred taxest−1)/(cash flows from operating activitiest−1− increase(decrease) in provision for retirement benefitst−1)
EPS = primary earnings per share excluding extraordinary itemst−1/stock price in the beginning of the periodt−1 SIZE = natural logarithm of total assetst−1
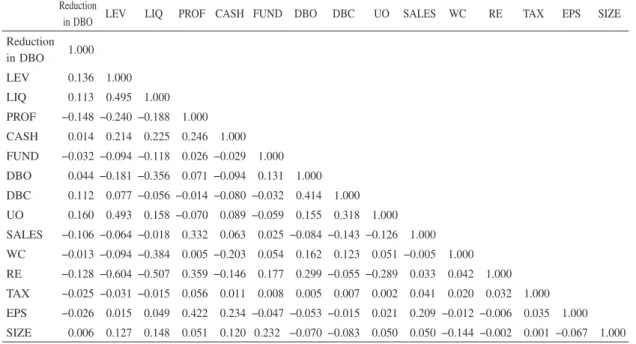
Table 4. Correlation for the Effect of a Firm’s Financial Condition on the Reduction in DBO
Reduction
in DBO LEV LIQ PROF CASH FUND DBO DBC UO SALES WC RE TAX EPS SIZE Reduction in DBO 1.000 LEV 0.136 1.000 LIQ 0.113 0.495 1.000 PROF −0.148 −0.240 −0.188 1.000 CASH 0.014 0.214 0.225 0.246 1.000 FUND −0.032 −0.094 −0.118 0.026 −0.029 1.000 DBO 0.044 −0.181 −0.356 0.071 −0.094 0.131 1.000 DBC 0.112 0.077 −0.056 −0.014 −0.080 −0.032 0.414 1.000 UO 0.160 0.493 0.158 −0.070 0.089 −0.059 0.155 0.318 1.000 SALES −0.106 −0.064 −0.018 0.332 0.063 0.025 −0.084 −0.143 −0.126 1.000 WC −0.013 −0.094 −0.384 0.005 −0.203 0.054 0.162 0.123 0.051 −0.005 1.000 RE −0.128 −0.604 −0.507 0.359 −0.146 0.177 0.299 −0.055 −0.289 0.033 0.042 1.000 TAX −0.025 −0.031 −0.015 0.056 0.011 0.008 0.005 0.007 0.002 0.041 0.020 0.032 1.000 EPS −0.026 0.015 0.049 0.422 0.234 −0.047 −0.053 −0.015 0.021 0.209 −0.012 −0.006 0.035 1.000 SIZE 0.006 0.127 0.148 0.051 0.120 0.232 −0.070 −0.083 0.050 0.050 −0.144 −0.002 0.001 −0.067 1.000
remain. Financial data used in this study were collected from Nikkei Economics Electronic Database System (2016), which is provided by the Nikkei Digital Media, Inc., and stock prices were obtained from Stock Chart CD-ROM (2017) which is provided by the Toyo Keizai Inc.
Table 3 indicates the descriptive statistics on sample firms. With regard to the amounts of non-pension components, the effect of pension components on those are considered, and calculated excluding the effect.
6. Empirical Results
Table 4 shows the correlation between a firm’s financial factors and the reduction in defined benefit obligations. There is no strong relationship in any of these variables. Only the correlation between leverage and liquidity is relatively high at 0.495, which indicates that when a firm has higher ratio of total liabilities to equity, it also has a higher ratio of current liabilities to current assets. However, the correlation is not that strong as to affect the multicollinearity.
Table 5 shows the result of the logistic regression model for the effect of a firm’s financial condition and the reduction in defined benefit obligations. It shows that the
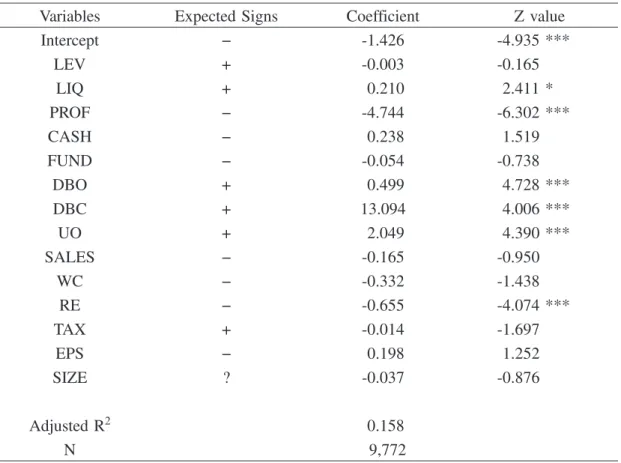
Table 5. The Effect of a Firm’s Financial Condition on the Reduction in DBO
Variables Expected Signs Coefficient Z value
Intercept − -1.426 -4.935 *** LEV + -0.003 -0.165 LIQ + 0.210 2.411 * PROF − -4.744 -6.302 *** CASH − 0.238 1.519 FUND − -0.054 -0.738 DBO + 0.499 4.728 *** DBC + 13.094 4.006 *** UO + 2.049 4.390 *** SALES − -0.165 -0.950 WC − -0.332 -1.438 RE − -0.655 -4.074 *** TAX + -0.014 -1.697 EPS − 0.198 1.252 SIZE ? -0.037 -0.876 Adjusted R2 0.158 N 9,772
Note:***, **, *, † indicate statistical significance at 0.1, 1, 5, 10% levels respectively.
coefficients on profitability and retained earnings are negative and significant. This would indicate that firms with lower profitability and retained earnings tend to reduce the amount of defined benefit obligations. The table also shows that the coefficients on pension components including defined benefit obligations, defined benefit cost, and unrecognized obligations are all positive and significant. Firms with a higher proportion of pension components in financial statements tend to decrease the amount of defined benefit obligations. With regard to liquidity, if firms have lower solvency for short-term obligations, they decrease the amount of defined benefit obligations. In contrast, the coefficients on leverage and other financial factors have no effect on the reduction in defined benefit obligations.
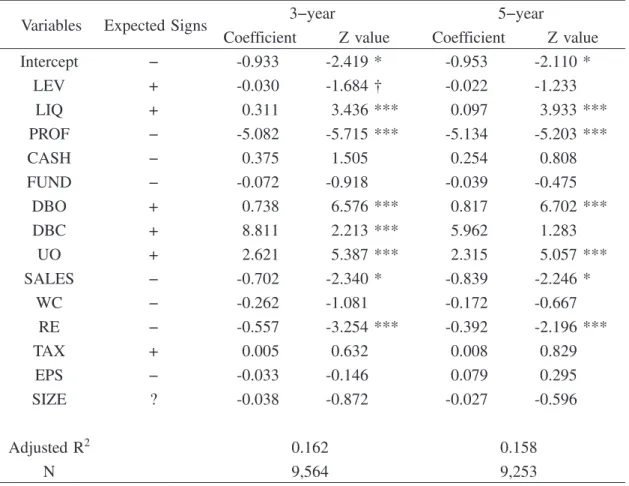
Based on the idea that firms might consider their financial condition and results for the past several years to determine whether to take action for the reduction in defined benefit
Table 6. The Effect of a Firm’s Financial Condition for last 3 or 5 years on the Reduction in DBO
Variables Expected Signs 3−year 5−year
Coefficient Z value Coefficient Z value
Intercept − -0.933 -2.419 * -0.953 -2.110 * LEV + -0.030 -1.684 † -0.022 -1.233 LIQ + 0.311 3.436 *** 0.097 3.933 *** PROF − -5.082 -5.715 *** -5.134 -5.203 *** CASH − 0.375 1.505 0.254 0.808 FUND − -0.072 -0.918 -0.039 -0.475 DBO + 0.738 6.576 *** 0.817 6.702 *** DBC + 8.811 2.213 *** 5.962 1.283 UO + 2.621 5.387 *** 2.315 5.057 *** SALES − -0.702 -2.340 * -0.839 -2.246 * WC − -0.262 -1.081 -0.172 -0.667 RE − -0.557 -3.254 *** -0.392 -2.196 *** TAX + 0.005 0.632 0.008 0.829 EPS − -0.033 -0.146 0.079 0.295 SIZE ? -0.038 -0.872 -0.027 -0.596 Adjusted R2 0.162 0.158 N 9,564 9,253
Note:***, **, *, † indicate statistical significance at 0.1, 1, 5, 10% levels respectively.
obligations, the relationship between average ratios of a firm’s financial factors for the past several years and the reduction in defined benefit obligations is examined. The data for independent variables in table 6 are average ratios for the last three or five years.
The table shows the results that they are similar to those in Table 5. However, the coefficient on sales growth becomes negative and significant. Overall, these results in Tables 5 and 6 reveal that firms consider their income statement items rather than balance sheet items to decide the deduction in defined benefit obligations, because a decrease of defined benefit obligations also leads to a decrease in defined benefit cost.
7. Summary and Conclusion
significant effect of pension components on financial statements. They curtail, amend, or terminate their defined benefit plans, return the substitutional part of employees’ pension fund to the government, and change their defined benefit plans to defined contribution plans. These are the ways to reduce the impact of pension components on financial statements.
This paper examined if a firm’s financial factors affect the determination of reduction in defined benefit obligations. The results showed that firms with lower profitability and retained earnings tended to reduce the amount of defined benefit obligations. From a long-term perspective, there was a relationship between sales growth and the reduction in defined benefit obligations. The reduction in defined benefit obligations decreases the amount of defined benefit cost. Therefore, firms consider profitability and sales growth for the determination of the reduction in defined benefit obligations.
Firms with a higher proportion of pension components ― including defined benefit
obligations, defined benefit cost, and unrecognized obligations ― in financial statements also tended to decrease the amount of defined benefit obligations. In this paper, about 94% of firms have underfunded status in their defined benefit plans. In addition, the pension components have a significant effect on both income statement and balance sheet. Therefore, these components are considered to determine the reduction in defined benefit obligations.
This paper revealed that there was a relationship between a firm’s financial factors, including liquidity, profitability, sales growth, retained earnings and pension components, and the reduction in defined benefit obligations. As explained in Sections 2.1 and 2.3, 20% of firms adopting tax-qualified pension plans terminated the defined benefit plan, and many firms adopting employees’ pension fund also have transferred their substitutional part to the government or dissolved their funds. This paper doesn’t show the actual effects of fund termination, the return of substitutional part to the government, or fund dissolution in detail. For our further research, the actual effects of these firm behaviors on the reduction in defined benefit obligations on financial statements will be studied, and the research also will examine if the reduction in defined benefit obligations has a positive effect on stock prices.
References
Accounting Standards Board of Japan (2012). ASBJ Guidance No.25: Guidance on Accounting Standard
for Retirement Benefits, Tokyo: ASBJ.
Accounting Standards Board of Japan (2012). ASBJ Statement No.26: Accounting Standard for Retirement
Benefits, Tokyo: ASBJ.
Alderson, M. J. and J. L. VanDerhei (1992). “Additional Evidence on the Reaction of Shareholders to the Reversion of Surplus Pension Assets,” The Journal of Risk and Insurance, Vol.59, No.2, pp.262-274.
Alderson, M. J. and K. C. Chen (1986). “Excess Asset Reversions and Shareholder Wealth,” The Journal
of Finance, Vol.41, No.1, pp.225-241.
Barth, M. E, (1991). “Relative Measurement Errors among Alternative Pension Asset and Liability Measures,” The Accounting Review, Vol.66. No.3, pp.433-463.
Barth, M. E., W. H. Beaver, and W. R. Landsman (1993). “A Structural Analysis of Pension Disclosures under SFAS 87 and Their Relation to Share Prices,” Financial Analysts Journal, Vol.49, No.1, pp.18-26.
Bauman, M. P. and K. W. Shaw (2014). “An Analysis of Critical Accounting Estimate Disclosures of Pension Assumptions,” Accounting Horizons, Vol.28, No.4, pp.819-845.
Godwin, J. H., S. R. Goldberg, and J. E. Duchac (1996). “An Empirical Analysis of Factors Associated with Changes in Pension-Plan Interest-Rate Assumptions,” Journal of Accounting, Auditing and
Finance, Vol.11, No.2, pp.305-322.
Gopalakrishnan, V. and T. F. Sugrue (1995). “The Determinants of Actuarial Assumptions under Pension Accounting Disclosures,” Journal of Financial and Strategic Decisions, Vol.8, No.1, pp.35-41.
Hann, R. N., Y. Y. Lu, and K. R. Subramanyam (2007). “Uniformity versus Flexibility: Evidence from Pricing of the Pension Obligation,” The Accounting Review, Vol.82, No.1, pp.107-137.
Haw, I-H., K. Jung, and S. B. Lilien (1991). “Overfunded Defined Benefit Pension Plan Settlements without Asset Reversions,” Journal of Accounting and Economics, Vol.14, No.3, pp.295-320.
Haw, I-M., W. Ruland, and A. Hamdallah (1988). “Investor Evaluation of Overfunded Pension Plan Terminations,” The Journal of Financial Research, Vol.11, No.1, pp.81-88.
Hsieh, S-J. and K. R. Ferris (1994). “An Investigation of the Market Effects of Overfunded Pension Plan Termination,” Journal of Accounting, Auditing & Finance, Vol. 9. No.1, pp.61-90.
Hsieh, S-J., and K. R. Ferris, and A. H. Chen (1990). “Securities Market Response to Pension Fund Termination,” Contemporary Accounting Research, Vol.6, No.2-I, pp.550-572.
International Accounting Standards Board (2011). International Accounting Standard No.19: Employee
Benefits, London: IASB.
Kasaoka, E. (2015), The Effect of Defined Benefit Lability on Firms’ Valuations in Japan: Comparison of
Japanese GAAP for Retirement Benefits with IAS19, K.G. University Press.
Klumpes, P. J. M., M. Whittington, and Y. Li (2009). “Determinants of the Pension Curtailment Decisions of UK Firms,” Journal of Business Finance & Accounting, Vol.36, No.7&8, pp.899-924.
Lew, J-F. (2009). “Pension Actuarial Incentives for Earnings Management,” Asia Pacific Management
Review, Vo.14, No.3, pp.313-334.
Ministry of Finance (2011). Order for Enforcement of the Corporation Tax Act, Tokyo: MOF.
Ministry of Health, Labour and Welfare (2013). Act No.63 of 2013: the Revision of Employees’ Pension
Ministry of Health, Labour and Welfare (2016). Defined-Benefit Corporate Pension Act, Tokyo: MHLW. Ministry of Health, Labour and Welfare (2017). Employees’ Pension Insurance Act, Tokyo: MHLW. Ministry of Health, Labour and Welfare (2017). Enforcement Regulation on Defined-Benefit Corporate
Pension Plan Act, Tokyo: MHLW.
Ministry of Health, Labour and Welfare, “Overview of the Corporate Pension,” http://www.mhlw.go.jp/ english/org/policy/dl/p36-37p4.pdf (accessed 12-15-2017).
Ministry of Health, Labour and Welfare, “The Number of Contracts in Defined-Contribution Pension Plans,” http : / / www. mhlw. go. jp / stf / seisakunitsuite / bunya / nenkin / nenkin / kyoshutsu / kiyakusu. html (accessed 12-15-2017).
Ministry of Health, Labour and Welfare, “Trend of Tax-Qualified Pension Plan,” http://www.mhlw.go.jp/ topics/bukyoku/nenkin/nenkin/tekikaku_e.html (accessed 12-15-2017).
Mitchell, M. L. and J. H. Mulherin (1989). “The Stock Price Response to Pension Terminations and the Relation of Terminations with Corporate Takeovers,” Financial Management, Vol.18, No.3, pp.41-56. Mittelstaedt, H. F. (1989). “An Empirical Analysis of the Factors Underlying the Decision to Remove
Excess Assets from Overfunded Pension Plans,” Journal of Accounting and Economics, Vol.11, No.4, pp.399-418.
Mittelstaedt, H. F. and P. R. Regier (1993). “The Market Response to Pension Plan Terminations,” The
Accounting Review, Vol.68, No.1, pp.1-27.
National Personnel Authority, “Table 7 Current Status of Corporate Pension Plans and Retirement Lump Sum Grants in Private Firms,” http://www.e-stat.go.jp/SG1/estat/GL08020103.do?_toGL08020103_& tclass ID=000001090742&cycleCode=0&requestSender=search (accessed 12-15-2017).
Newell, G. E., J. G. Kreuze, and D. Hurtt (2002). “Corporate Pension Plans: How Consistent are the Assumptions in Determining Pension Funding Status?,” American Journal of Business, Vol.17, No.2, pp.23-30.
Okumura, M. (2005). “Discretion in the Choice of Pension Discount Rate, Projected Benefit Obligation and Stock Price,” The Waseda Commercial Review, No.404, pp.27-49.
Pension Fund Association (2017), Basic Data on Corporate Pension.
Picconi, M. (2006). “The Perils of Pensions: Does Pension Accounting Lead Investors and Analysts Astray?,” The Accounting Review, Vol.81, No.4, pp.925-955.
Stone, M. (1987). “A Financing Explanation for Overfunded Pension Plan Terminations,” Journal of
Accounting Research, Vo.25, No.2, pp.317-326.
Stone, M. (1991). “Firm Financial Stress and Pension Plan Continuation/Replacement Decisions,” Journal
of Accounting and Public Policy, Vol.10, No.3, pp.175-206.
Thomas, J. K. (1989). “Why Do Firms Terminate Their Overfunded Pension Plans?,” Journal of
Ueno, T. (2007). “An Empirical Analysis on Financial Considerations of Daikou Henjou,” The Journal of
Business Analysis, No.23, pp.69-76.
VanDerhei, J. L. (1987). “The Effect of Voluntary Termination of Overfunded Pension Plans on Shareholder Wealth,” The Journal of Risk and Insurance, Vol.54, No.1, pp.131-156.
Yu, K. (2013), “Does Recognition versus Disclosure Affect Value Relevance? Evidence from Pension Accounting,” The Accounting Review, Vol.88, No.3, pp.1095-1127.