Nagoya City University Academic Repository
学 位 の 種 類 博士 (薬科学) 報 告 番 号 甲第1601号 学 位 記 番 号 第327号 氏 名 橋崎 将典 授 与 年 月 日 平成 29 年 3 月 31 日 学位論文の題名 非接触睡眠計を用いた大規模データ分析による日本人の睡眠に関する疫学 的研究 論文審査担当者 主査: 青山 峰芳 副査: 粂 和彦, 服部 光治, 山村 壽男
名古屋市立大学学位論文
非接触睡眠計を用いた大規模データ分析による
日本人の睡眠に関する疫学的研究
2017 年 3 月
薬学研究科博士後期課程 創薬生命科学専攻
氏名:橋崎 将典
本論文は、2017 年 3 月名古屋市立大学大学院薬学研究科において審査されたものである。 主査 青山 峰芳 教授 副査 粂 和彦 教授 服部 光治 教授 山村 壽男 准教授 本論文は、学術情報雑誌に収載された次の報文を基礎とするものである。
1. M. Hashizaki, H. Nakajima and K. Kume : Monitoring of weekly sleep pattern variations at home with a contactless biomotion Sensor
Sensors 15 (8), 18950-18964, 2015
2. M. Hashizaki, H. Nakajima, T. Shiga, M. Tsutsumi and K. Kume : A longitudinal large-scale objective sleep data analysis revealed a seasonal sleep variation in the Japanese population.
Chronobiology International 35 (7), 933-945, 2018
本論文の基礎となる研究は、粂 和彦教授の指導の下に名古屋市立大学大学院薬学研究科に おいて行われた。
1
Contents
1. Introduction
1.1 Background
1.2 Contactless biomotion sensor 1.3 Social factors and external factors 1.4 Purpose
2. Materials and Methods
2.1 System
2.2 Weekly sleep pattern 2.3 Seasonal change of sleep
3. Results & Discussion
3.1 Weekly sleep pattern 3.2 Seasonal change of sleep
4. Limitation
5. Conclusion
6. References
2
Abbreviation
DLMO dim light melatonin onset
MCTQ munich chronotype questionnaire
MS mid-sleep
MSFsc sleep-corrected mid-sleep on freedays
NREM non-rapid eye movement sleep
PSG polysomnography
REM rapid eye movement sleep
SE sleep efficiency
TIB times in bed
TST total sleep time
3
1. Introduction
1.1 Background
Homeostasis and circadian rhythm are fundamental functions to understand regulatory mechanisms of sleep-wake cycles affected by various internal and external factors, including changes of the environment and social needs. In contemporary, developed societies, daily life schedules are mainly dependent on social activities, such as the starting time and ending time of work and class, and by individual preference, such as TV programs or outdoor activities. The wide spread use of air-conditioning and artificial light has created artificial environments that are opposed to the natural climate. Due to these influences, habitual sleep schedules have changed gradually, and, as a result, the average sleep duration has become shorter by more than one hour in Japan and many other countries over the past 30 years1,2.
It is well known that sleep disorders and poor sleep quality have a negative impact on human physical and psychological conditions, and consequently the importance of sleep health is now gaining much more attention3. To understand and improve sleep patterns to enhance
the quality of life, a device that can easily monitor long-term sleep patterns in the home environment is needed. In the medical field, polysomnography (PSG) is the gold standard method for accurate and objective sleep measurement. PSG measures various physiological parameters and is employed for diagnosing and treating sleep disorders. During PSG, subjects are required to visit and sleep in a hospital or a sleep laboratory overnight with multiple electrodes pasted onto their head and body. In addition, experienced sleep technologists are needed to collect, analyze and interpret data. PSG has several limitations. First, PSG restricts the subject’s movement and posture because of the diverse range of attached electrodes. Second, to conduct PSG over a long period is difficult because of the laboratory setting, examination monetary and human cost, and comfort issues.
In the sleep research field, wrist actigraphy is widely accepted to be a useful method to estimate sleep at home. In this method, subjects wear a monitor on the non-dominant wrist to estimate whether the subject is asleep or awake by monitoring their movements using an acceleration monitor. The American Academy of Sleep Medicine Practice Guidelines accepts that actigraphy is a useful method to estimate sleep in healthy adult populations4. However,
actigraphy has not become a common method to monitor sleep by oneself because of economic and practical concerns.
In epidemiological studies, questionnaires are often used to collect subjects’ sleep related data, and there have been a variety of questionnaires developed. Therefore, researchers must choose questionnaires to suit their specific purpose. One limitation is that subjective evaluation depends on the subjects’ memory.
4 1.2 Contactless biomotion sensor
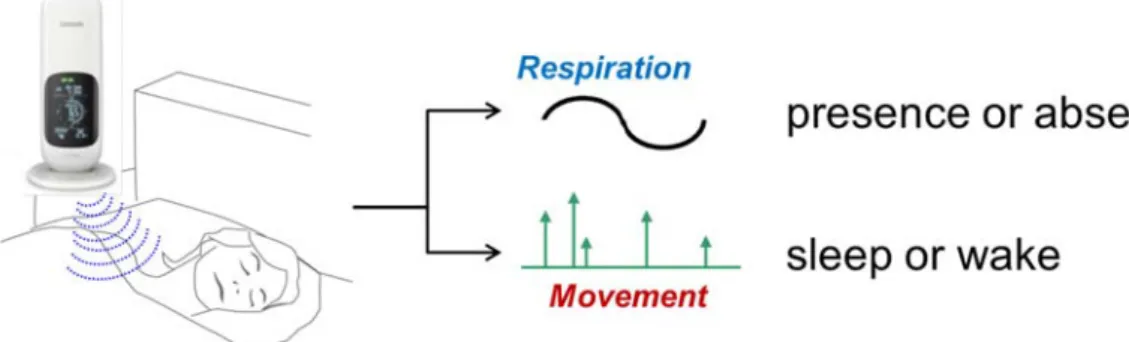
To overcome the limitations of PSG and actigraphy, a contactless biomotion sensor was developed. It employs radiofrequency waves (10.525 GHz) to detect body and respiratory movements of sleeping human subjects (see Fig1). The sensor can detect movements, limited to a 45° angle and 50-200 cm distance, looking from the front of the sensor, and is designed for indoor use. It automatically assigns one of four labels (sleep/wake/absent/unknown) to each 30-s epoch. The “unknown” and “absent” labels signify that the subject was outside the range of the monitor, and the difference of two labels is that “absent” is assigned when the subject is outside of the range of the monitor for over 20 min. For body movements, the monitor detects significant movements to assess activity based on the magnitude and duration of each movement. After calculating the activity of each 30-s epoch, an algorithm identifies whether the subject is asleep or awake. For respiratory movements, it detects whether a person is present according to the existence of respiratory band frequencies. This study employed a 10.525 GHz radiofrequency in order to comply with the Japanese Radio Law; however, the algorithms related to the process of identifying the four conditions is the same as in a previous study, which used 5.8 GHz5. To validate the
accuracy of the 10.525 GHz contactless biomotion sensor, an examination was conducted simultaneously with polysomnography at two institutions (Ota Memorial Sleep Center and Kuwamizu Hospital). In total, 211 adult subjects participated in the study, and 148 (99 subjects with an apnea-hypopnea index score >15) were used for the analysis. In the comparison of each 30-s epoch, the overall accuracy of the 10.525 GHz contactless biomotion sensor was 84.1%, and its sensitivity and specificity were 91.8% and 37.6%, respectively. For the sleep parameters, the algorithm slightly overestimated total sleep time (bias: +13 min) and sleep efficiency (bias: +3%) compared with polysomnography. As for sleep onset latency and wake time after sleep onset, these were slightly underestimated. These results show that the contactless biomotion sensor showed an equivalent sleep estimate potency as actigraphy6.
5 1.3 Social factors and external factors
Although humans have their own chronotype, which is the characteristic of biological time, it is difficult to spend individual sleep preferences because of social schedules. The distributions of mid-sleep (MS) (MS = bedtime + (wake-up time − bedtime)/2) and sleep duration differed between work days and free days in a previous study, which used the Munich Chronotype Questionnaire (MCTQ)7, and the concept of social jet lag; i.e., the
discrepancy between biological time and social time leading to adverse effects, were advocated8. A recent study found that the discrepancy of MS between work days and free
days decrease with age in both men and women9.
As a result of sleep debt during work days, sleeping for longer on free days can delay an individual’s circadian rhythms and lead to adverse effects on subsequent sleep and activities. In a previous study, individuals who delayed their sleep schedules on weekends had less sleepiness and required a longer sleep onset latency on Sunday nights, but showed lower cognitive performance and overall mood ratings on Monday mornings compared with those who maintained weekday sleep schedules on weekends10. Even subjects who went to bed
at their usual bedtimes on weekends, waking up later can cause similar effects11. In another
study, the administration of melatonin counteracted the phase delay of endogenous melatonin onset, increased the severity of daytime sleepiness, and decreased sleep onset latency on Sundays12.
Many biological indices and behaviors indicate seasonal rhythms in human daily life13. In
laboratory environments using PSG, seasonal variations including later bedtime, later wake-up time, increased time of rapid eye movement (REM) sleep, and decreased time of the stage 4 of non-REM (NREM) sleep were found to occur more in winter compared with summer14. In addition to sleep parameters, markers of circadian rhythms such as rectal
temperature and melatonin show a delay in winter compared to summer15,16.
In some large-scale population studies that use questionnaires, however, it is difficult to interpret the reported results of subjective assessments for the seasonality of sleep. For example, people in Norway have more trouble sleeping in December than in June17, but
another study reported that the quality of sleep is worse during the summer in Finland18.
Furthermore, there are no significant differences in the data collected between April through September and October through March19. Finally, another study reported the possibility that
previous results of seasonal variations in sleep might have been caused by publication biases and problems of study design20.
6 1.4 Purpose
The contactless biomotion sensor was commercialized in 2012, and more than 7,000 sensors have been sold and are now in use by Japanese consumers. Their sleep data are gathered in a data server via the internet, which enables the objective, large-scale study of sleep patterns. The aim of the present study is to analyze weekly and seasonal changes in sleep patterns using large-scale, real world data, and to clarify the relationship between social factors and environmental changes.
7
2. Materials and Methods
2.1 System
The contactless biomotion sensor can upload the data to a web-based healthcare application through a USB or near-field communication connection. Informed consent was obtained from all subjects when they started to use the web-based application for the first time. Data confidentiality and handling procedures regarding this study was explained to the subjects before their consent was obtained.
The contactless biomotion sensor used in this study employs two methods for determining the start and end of the measurement period. First, to obtain automatic measurements, the subject sets the start time of the measurement period in advance, and measurements begin being taken when the sensor detects the subject. The sensor stops obtaining measurements when the subject has been out of range for a fixed amount of time. Second, to obtain manual measurements, the subject pushes a button when going to and getting out of bed. In this study, we used both types of data for analysis; however, data obtained on nights were excluded if more than one “absent” label existed at any period in the data. We used this preprocessing to avoid two types of errors: (1) the sensor detects the subject in range and starts measuring in automatic mode before they actually wanted to go to sleep; and (2) subject forgot to push the stop button when the sensor was in manual mode. Figure 2 and Table 1 show the demographic information in databases from May 2012 to November 2016. In the seasonal variations analysis, outside temperature and sun time (sunrise time, sunset time) data was used as environmental parameters. Hourly temperature data in all Japan prefectures was provided by the Japan Weather Forecast Association. The daily sun time data in all prefectures was collected by the National Astronomical Observatory of Japan.
No. Participants 7,086
No. Nights 2,131,615
Male / Female 5,663 / 1,423
Median Age 50
Median times in bed 7h 5min
Median total sleep time 5h 58min Table 1. Subjects’ characteristics
8 2.2 Weekly sleep pattern (data analysis)
Data extracted from complete sets of 7-day periods (starting on Sundays) were used in the analysis. Table 2 shows the demographic information in this analysis. Data gathered from each subject were from differing numbers of weeks (minimum: 1 week, maximum: 73 weeks). Six sleep parameters were examined in this study: bedtime, wake-up time, time spent in bed (TIB), total sleep time (TST), sleep efficiency (SE), and initial sleep index. TST is the sum of all sleep epochs between sleep onset and waking-up. SE is the ratio of the TST to the time spent in bed multiplied by 100. Initial sleep index is employed to measure the difficulty in falling asleep. It is defined as the minutes lapsed from bedtime to the first 10-min period where all labels are “sleep” and activity is equal to 0. We defined this index since sleep onset latency using an activity based algorithm is underestimated compared with PSG. Furthermore, to assess the intra-weekday variation, the difference between the maximum MS and median MS (MSmax - MSmed) values on weekdays is employed. Some weeks (maximum 10 weeks; if a subject has only 3 weeks of valid data, all 3 weeks are used) were
9
randomly selected for each subject and then the average of (MSmax – MSmed) was used. After averaging each subject, mean values were calculated for all subjects. This process was employed because of the differences in the amount of weeks available for each participant. One-way ANOVA was used to test for differences in sleep parameters between days or age decades, and Welch’s t-test was used to test for differences between the weekdays and weekends and gender in each age decade.
2.3 Seasonal change of sleep (data analysis)
Each subject recorded data for different numbers of days (minimum, 1 night; maximum, 815 nights; median, 53 nights). Table 3 shows the demographic information in this analysis. Five sleep parameters were examined in this study: (a) sleep onset time, (b) sleep offset time, (c) mid-sleep time, (d) SE, and (e) wake after sleep onset (WASO). Sleep onset time is the first epoch attached to the “sleep” label after beginning measurement. Sleep offset time is the next epoch to the last epoch labeled as sleep. WASO is defined as the sum of all wake epochs between sleep onset and the last epoch labeled as sleep. All sleep parameters were adjusted for age according to the following procedures:
1) Averages of all five sleep parameters for each age (20 to 79) were calculated. 2) Average of age plots were subjected to smoothing with spline interpolation.
3) The base line value at 50 years-old (median age) was calculated from the above plot. 4) The difference from base line value for each age was calculated.
5) All sleep parameters for each night were adjusted by age using the above calculated differences in the subjects’ ages.
This approach was employed because the distribution of subjects’ ages increased with time. For phase analysis between sleep parameters and environmental parameters, spline interpolation was conducted to resample from time series weekly averaged data to daily data, and local maximum and minimum values were calculated. Intermediate points were calculated using these values.
The temperature data used for each night was the average of 10 hourly temperature data between 23:00 to the next 8:00 from each prefecture. When one prefecture had more than one observatory, all observatory data were included. This averaged temperature data of each prefecture was linked to each daily sleep data using the date and the subject’s residential information. Sunrise and sunset time data for each prefectural capital was also connected to each daily sleep data in the same way. Pearson’s correlation coefficient (r) was used to quantify the strength of the relationship between the sleep parameters and environmental parameters. Welch’s t-test was used to test for differences in sleep offset time between conditions (summer solstice to winter solstice, winter solstice to summer solstice).
10
All data processing and statistical analyses were conducted using the statistical software R, version 3 (https://www.r-project.org/). Number of Subjects 2,914 Male / Female 2446 / 468 Average Age 47.9 ± 11.6 Number of Weeks 24,899 Number of Subjects 5,685 Male / Female 4664 / 1021 Average Age 50.5 ± 11.4 Number of Night 840,903
Table 2. Participants’ characteristics in weekly sleep pattern analysis (Data are expressed as absolute or mean and SD values)
Table 3. Participants’ characteristics in seasonal sleep pattern analysis (Data are expressed as absolute or mean and SD values)
11
3. Results & Discussion
3.1 Weekly sleep pattern 3.1.1 All subjects
On weekend (Friday and Saturday) nights, the subjects’ mean bedtime, wake-up time, and MS were delayed by 26, 53, and 40 min, respectively, compared with those seen on weekday (Sunday to Thursday) nights (Table 4). Since wake-up time was delayed more than bedtime, TIB and TST values were increased by 27 and 22 min, respectively. Welch’s t-test detected significant differences in the bedtime, wake-up time, TIB, and TST between weekdays and weekends. In the comparison of data collected for each sleep parameter each day (Table 5), on Sunday nights, the initial sleep index was increased compared with that seen on Tuesday to Friday (Sunday: 42.8 min, Tuesday to Friday: 36.0–37.5 min). One-way ANOVA detected significant differences in the initial sleep index between the day groups (p < 0.01).
Index Weekdays Weekend p
Bedtime (HH:MM) 11:46 p.m. ± 87.2 00:12 a.m. ± 102.0 <0.001 Wake-up Time (HH:MM) 06:32 a.m. ± 80.6 07:26 a.m. ± 105.0 <0.001 Sleep Midpoint (HH:MM) 03:09 a.m. ± 77.2 03:49 a.m. ± 96.4 <0.001
Time in Bed (min) 406 ± 65.9 434 ± 75.4 <0.001
Total Sleep Time (min) 354 ± 60.1 376 ± 70.2 <0.001
Sleep Efficiency (%) 87.4 ± 8.2 87.1 ± 8.8 0.089
Initial Sleep Index (min) 38.8 ± 29.5 38.4 ± 33.7 0.613 Table 4. Comparison of sleep parameters between weekdays and weekends (Data are expressed as mean ± SD values. Weekdays, from Sunday to Thursday nights;
Weekend, Friday, and Saturday nights, significant difference between weekdays and weekends assessed by Welch’s t-test).
12
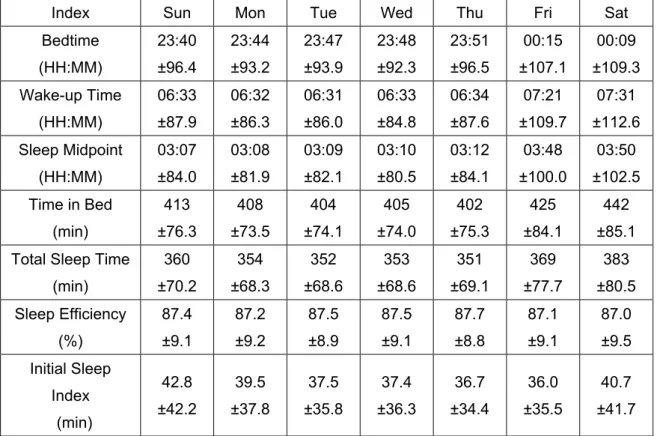
Index Sun Mon Tue Wed Thu Fri Sat
Bedtime (HH:MM) 23:40 ±96.4 23:44 ±93.2 23:47 ±93.9 23:48 ±92.3 23:51 ±96.5 00:15 ±107.1 00:09 ±109.3 Wake-up Time (HH:MM) 06:33 ±87.9 06:32 ±86.3 06:31 ±86.0 06:33 ±84.8 06:34 ±87.6 07:21 ±109.7 07:31 ±112.6 Sleep Midpoint (HH:MM) 03:07 ±84.0 03:08 ±81.9 03:09 ±82.1 03:10 ±80.5 03:12 ±84.1 03:48 ±100.0 03:50 ±102.5 Time in Bed (min) 413 ±76.3 408 ±73.5 404 ±74.1 405 ±74.0 402 ±75.3 425 ±84.1 442 ±85.1 Total Sleep Time
(min) 360 ±70.2 354 ±68.3 352 ±68.6 353 ±68.6 351 ±69.1 369 ±77.7 383 ±80.5 Sleep Efficiency (%) 87.4 ±9.1 87.2 ±9.2 87.5 ±8.9 87.5 ±9.1 87.7 ±8.8 87.1 ±9.1 87.0 ±9.5 Initial Sleep Index (min) 42.8 ±42.2 39.5 ±37.8 37.5 ±35.8 37.4 ±36.3 36.7 ±34.4 36.0 ±35.5 40.7 ±41.7
3.1.2 Differences between the genders and age decades
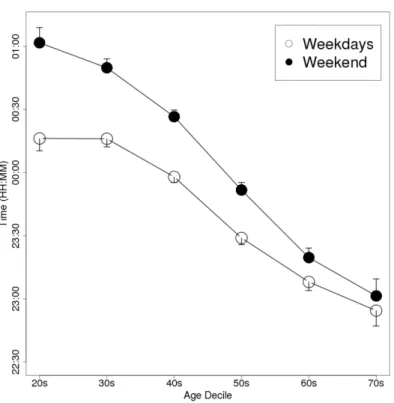
The weekend delay in the MS was greatest in the individuals in their 20s, in both men and women. Men had prolonged TIB and TST values by 39 and 36 min, respectively, since their bedtime, wake-up time, and MS were delayed by 44, 84, and 64 min, respectively, on weekends compared with weekdays. Similarly, women increased their TIB and TST values by 37 and 32 min, respectively, since their bedtime, wake-up time, and MS were delayed by 46, 82, and 64 min, respectively, on weekends. One-way ANOVA detected significant differences in MSweekend – MSweekday between the age groups (p < 0.01); however, Welch’s t-test did not detect any significant differences in this parameter between the genders. Figures 3, 4, and 5 show the changes in bedtimes, wake-up times, and TIB values, respectively, for each age decade on weekdays and weekends. Figure 6 shows the changes in MSweekend − MSweekday among the genders and age decades.
Table 5. Comparison of sleep parameters among day (Data are expressed as mean ± SD values).
13
Figure 3. A plot of the subjects’ weekday and weekend bedtimes according to age decade (Data are shown as mean and SEM values).
Figure 4. A plot of the subjects’ weekday and weekend wake-up times according to age decade (Data are shown as mean and SEM values).
14
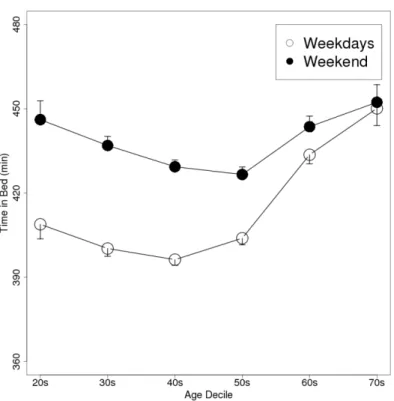
Figure 5. A plot of the subjects’ weekday and weekend TIB values according to age decade (Data are shown as mean and SEM values. TIB, time spent in bed).
Figure 6. A plot of the subjects’ MSweekend − MSweekday values according to gender and age decade (Data are shown as mean and SEM values).
15 3.1.3 Differences among weekdays
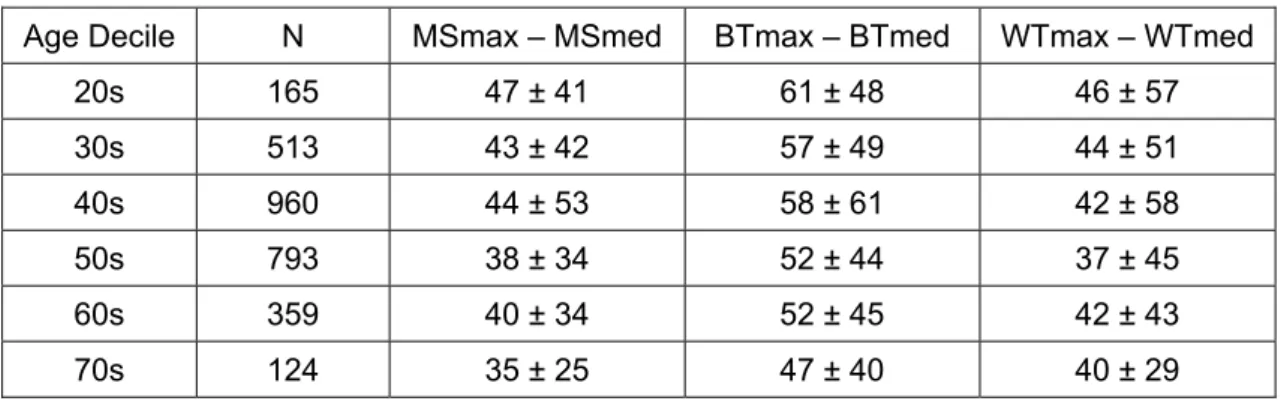
Assessment of intra-weekday (from Sunday to Thursday) variations showed that the difference between MSmax and MSmed was greatest among the subjects in their 20s (47 min) and smallest among those in their 70s (35 min). One-way ANOVA detected a
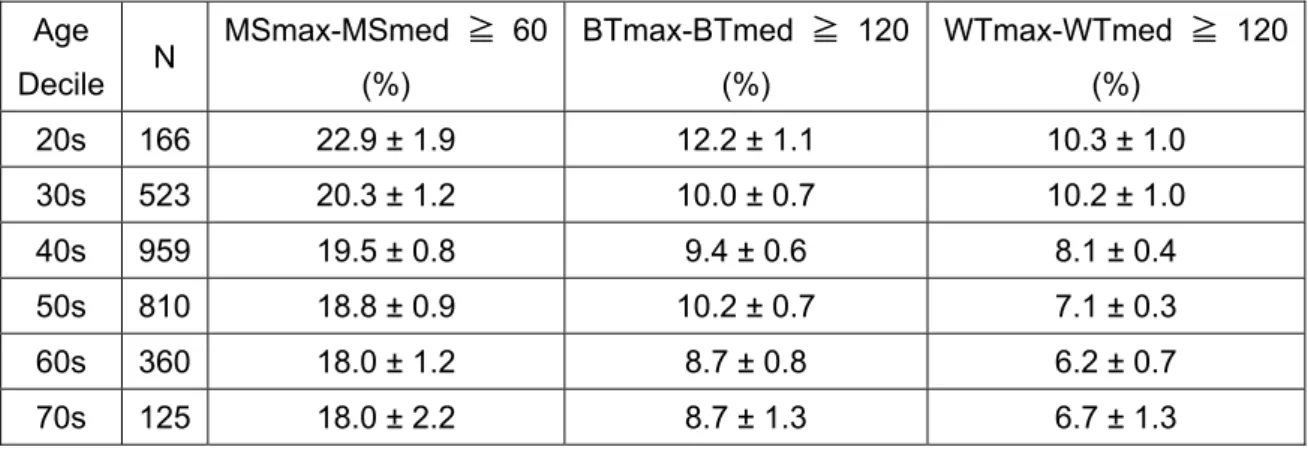
significant relationship between MSmax − MSmed and age (p < 0.05); however, Welch’s t-test did not detect significant differences in the MSmax − MSmed values between the genders, except for those in their 60s (p < 0.01). Of the subjects in their 20s, MSmax – MSmed values of more than 1 h was 22.9%, bedtime delays of more than 2 h was 12.2%, and wake-up time delays of more than 2 h was 10.3%. These percentages tended to decrease as the age decades increased. Table 6 shows the differences between the subjects’ maximum and median bedtimes, wake-up times, and MS values according to age decade. Table 7 shows the percentage difference between the subjects’ maximum and median values over the threshold according to age decade.
Age Decile N MSmax – MSmed BTmax – BTmed WTmax – WTmed
20s 165 47 ± 41 61 ± 48 46 ± 57 30s 513 43 ± 42 57 ± 49 44 ± 51 40s 960 44 ± 53 58 ± 61 42 ± 58 50s 793 38 ± 34 52 ± 44 37 ± 45 60s 359 40 ± 34 52 ± 45 42 ± 43 70s 124 35 ± 25 47 ± 40 40 ± 29
Table 6. Difference between the maximum and median values of various sleep parameters according to age decade (Data are expressed as mean ± SD values. N, number of participants; MS, mid-sleep; max, maximum value of the parameter on weekdays; med, median value of the parameter on weekdays; BIT, bed in time; BOT, bed out time).
16 3.1.4 Discussion of weekly sleep pattern
In this study, we found that subjects tended to go to bed and wake-up later on weekends than on weekdays. Since they delayed their wake-up times to a greater extent than their bedtimes, their TIB and TST values were increased. Furthermore, initial sleep index increased on Sundays. The difference between the subjects’ weekday and weekend TIB values was greatest among individuals in their 20s and decreased with age, however the difference between male and female could not be seen. We assume that this trend indicates lifestyle changes. Our results show that people in their 60s and 70s have greater weekday TIB values than those in their 20s–50s. People generally retire around the age of 60. As a result, they are released from social obligations and accumulate less sleep debt on weekdays, and therefore do not need to change their sleep patterns on weekends. Previous studies have reported that weekend sleep delays cause disturbances in circadian rhythms. Waking-up later on both weekend mornings caused the delay of dim light melatonin onset (DLMO), increased sleep onset latency on Sunday nights, and greater daytime fatigue and sleepiness during the following week11. Interestingly, exposure to light on weekend mornings was not
effective at stabilizing circadian rhythms in younger subjects21, which indicates the difficulty
of recovering from circadian rhythm delays in the short term. Such circadian disturbances are also associated with reward-related brain functions in healthy adolescents and worse academic performance among adolescents with behaviorally-induced insufficient sleep syndrome22,23. Regarding difference between the genders, we assume that since
employment situation (full-time job, part-time job, homemaker) have important role in lifestyle Age Decile N MSmax-MSmed ≧ 60 (%) BTmax-BTmed ≧ 120 (%) WTmax-WTmed ≧ 120 (%) 20s 166 22.9 ± 1.9 12.2 ± 1.1 10.3 ± 1.0 30s 523 20.3 ± 1.2 10.0 ± 0.7 10.2 ± 1.0 40s 959 19.5 ± 0.8 9.4 ± 0.6 8.1 ± 0.4 50s 810 18.8 ± 0.9 10.2 ± 0.7 7.1 ± 0.3 60s 360 18.0 ± 1.2 8.7 ± 0.8 6.2 ± 0.7 70s 125 18.0 ± 2.2 8.7 ± 1.3 6.7 ± 1.3
Table 7. Percentage difference between the maximum and median values of various sleep parameters according to age decade (Data are expressed as mean ± SD values. N, number of participants; MS, mid-sleep; max, maximum value of the parameter on weekdays; med, median value of the parameter on weekdays; BIT, bed in time; BOT, bed out time).
17
schedule, the social characteristic (especially in employment situation) of subjects both male and female might be similar in our database. Investigation by Ministry of Internal Affairs and Communications in Japan reported female tend to have short sleep duration compared with male in weekdays, however the weekly variation was smaller than male (about 10 min). In this study, MSweekend − MSweekday (which is similar to ΔMS) was used as an index of sleep pattern delays (about 1 h and 30 min in their 20s and 50s) (see Fig. 6). A previous study using the MCTQ to examine the sleep patterns of more than 65,000 subjects (primarily central Europeans) reported that the ΔMS values in the subjects in their 20s and 50s was about 2 h and 1 h, respectively9. Another questionnaire study examined the sleep patterns
of subjects with a mean age of 36 and found that their ΔMS value was about 1 h24.
Comparing these results with ours suggests that objective ΔMS values might tend to be smaller than subjective ΔMS values, but trends of decreases in ΔMS with age were detected in both studies. Although it is unclear the effect of differences in the subjects’ characteristics, the discrepancy between studies might be caused by differences the nature of data acquisition method. Previous studies have found that diary-based bedtime and wake-up times were strongly correlated with objective observational data25,26; however, there have
been no studies on the relationship between data regarding “usual” sleep patterns obtained using a questionnaire and objective daily sleep measurements. Further studies are required to assess the difference of subjective and objective sleep parameters.
Subjects’ maximum and median values for various sleep parameters were used to examine intra-weekday variations in sleep patterns. Our results showed that the greatest mean MSmax − MSmed value was seen in subjects in their 20s (47 min). Furthermore, 22.9% of these subjects exhibited mean weekly MSmax – MSmed values of more than 60 min using repeated random sampling analysis. This indicates that these subjects’ sleep schedules varied not only on weekends, but also on weekdays. Although the delays seen on the weekend resulted from delayed wake-up times and demand an extension of TIB, intra-weekday variations were primarily caused by subjects going to bed later on intra-weekdays, and hence, getting less sleep because of their obligations on weekday mornings. A previous study reported that even minor variations in weekday wake-up times are associated with poor subjective sleep quality and that weekday bedtime stability is strongly correlated with consistent weekday wake-up times27. Some studies from college students to senior citizens
reported that highly regular lifestyles including regular sleep patterns are related to better subjective sleep28–30. The subjects with stable bedtimes and wake-up times (variation of ≤15
min) exhibited better subjective sleep quality and slightly higher SE than the subjects with variable bedtimes or wake-up times (variation of >15 min) among retired senior citizens31.
18
going to bed and waking up within pre-assigned 1-hour time windows, and the study found that this decreased subjective daytime sleepiness, sleep onset latency, and increased SE32.
The subjects’ circadian rhythms (DLMO) were significantly delayed in the late bedtime conditions (1:00 a.m.) compared with the early bedtime conditions (10:00 p.m.) in 7-19 night periods involving a fixed lights on time (7:00 a.m.)33. Clearly, further studies are required to
assess the effects of abrupt sleep delays on circadian rhythms and daytime fatigue and sleepiness.
Such delays affect not only sleepiness and daytime performance, but can also influence lifestyle diseases or behaviors. A previous study reported that MSFsc (MSF – (sleep duration on free days – sleep duration in week) / 2) was correlated with body mass index (BMI) among overweight and obese subjects (BMI ≥ 25), but not among individuals with normal body weights (BMI < 25)9. The risk of diabetes and inflammation might be increased by circadian
misalignment independent of insufficient sleep34. In addition, reduced weekday sleep and
weekend oversleeping were found to be associated with suicidality in adolescents35,36. On
the other hand, some studies have reported that catch-up sleep on weekends decreases the risk of overweightness and hypertension37,38. Further studies are required to assess the
advantages of getting extra sleep and the disadvantages of the circadian rhythm disturbances caused by catch-up sleep on weekends.
3.2 Seasonal change of sleep
3.2.1 The magnitudes of the seasonal changes in sleep over 3 year periods
Figure 7 shows the changes in five sleep parameters plotted as weekly time series data over three years. The age-adjusted average of the all weekly data is plotted in each upper panel with temperature (red) and sunrise time (blue), and separated weekday and weekend data are plotted in each lower panel. It does not show clearly periodic variation in sleep onset time over three years, even after separation of weekdays and weekends (Fig. 7A). On the other hand, sleep offset time showed significant periodic variation with a single peak within a year, especially during weekends (Fig. 7B). The magnitude of variation in sleep offset from mid-winter to mid-summer is early by nearly 30 min (three-year average, 29.2 min) during weekends. Furthermore, even on weekdays, the seasonal variation was significant (15.6 min). MS also fluctuates as a result of the sleep onset and offset time fluctuation (Fig. 7C)
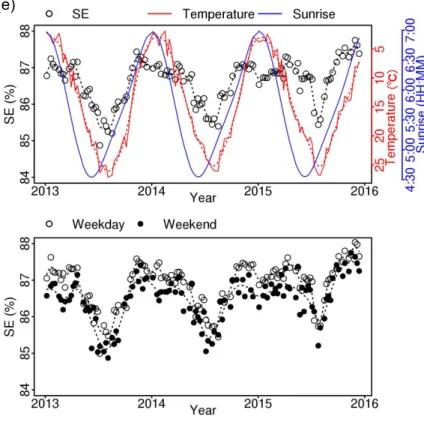
In sleep quality parameters, WASO reflecting intervening arousal during sleep showed a change with two peaks in mid-summer and mid-winter within a year (Fig. 7D). These two peaks indicated that both high and low temperatures impaired sleep. Similarly, SE which also indicates sleep quality, showed a change with two different peaks within a year (Fig. 7E). Regarding yearly peaks, SE decreased sharply in mid-summer, especially during the highest
19
temperature period, and decreased a smaller amount around mid-winter. The difference of the two peaks derived from the difference in the length of TST, since the WASO increase peaks were not much different compared with sleep offset time variation. Total sleep time during winter was longer than during summer, which made the SE during winter appear to be greater than the SE during summer.
(℃)
(℃)
(a)
20
(℃)
(℃)
(c)
21
Figure 7. Weekly changes of the averages of the sleep parameters for all subjects (adjusted for age; open circles), temperature (red line, upside down) and sunrise time (blue line). Upper panels: All day averages. Lower panels: Weekday average (open circles) and weekend average (filled circles). Dotted line indicates smoothed data with spline interpolation. One plotted dot corresponds to more than 1,000 subject-nights. (a) Sleep onset time, (b) Sleep offset time, (c) Mid-sleep (MS), (d) Wakefulness after sleep onset (WASO), (e) Sleep efficiency (SE).
(℃)
22 3.2.2 The annual phases of the seasonal changes
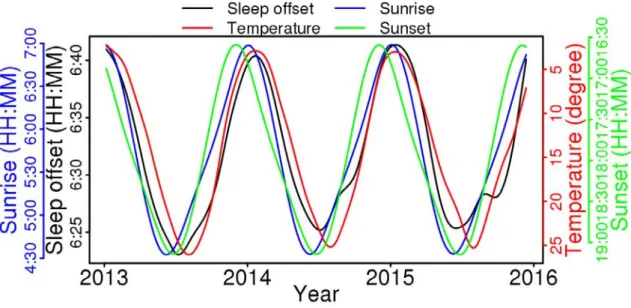
The data was smoothed using the spline interpolation method the local maximum, minimum and intermediate points were calculated to evaluate the annual phase of seasonal change. Figure 8 shows the smoothed data of sleep offset time, temperature (upside down), sunrise time and sunset time (upside down). Table 8 shows the summary of the phase calculation of five parameters, temperature and sun time. Clearly, the annual temperature change followed the annual photo period change. The greatest difference between temperature and sunrise is about two months in Japan, as a result of the earliest sunrise time in early June and the highest temperature day in early August. The earliest sleep offset time is in early July, which is approximately halfway between the sunrise time and temperature peaks. Since the latest sunset time is about two weeks later than the earliest sunrise time, sleep offset rhythm is closer to sunset time than to sunrise time.
On the other hand, the day with the maximal WASO during summer and minimal SE are nearly synchronous with the highest temperature day. The day with the second smallest WASO peak during winter corresponds to the coldest temperature day.
Figure 8. Comparison of smoothed data with spline interpolation of sleep offset time (black, upside down), temperature (red), sunrise time (blue, upside down) and sunset time (green).
23
2013 2014 2015
summer autumn winter spring summer autumn winter spring summer sunrise time 6/8 9/21 1/4 3/23 6/10 9/22 1/4 3/23 6/10 sunset time 6/26 9/14 12/3 3/15 6/26 9/14 12/3 3/15 6/26 temperature 8/5 10/28 1/20 4/26 8/1 10/22 1/13 4/23 7/31 offset time 7/9 10/15 1/21 4/13 7/5 10/9 1/14 4/1 6/17 MS 7/19 10/21 1/22 4/23 7/23 10/10 12/28 3/22 6/15 WASO 8/4 - 2/17 - 8/1 - 1/10 - 7/30 SE 7/29 - - - 7/30 - - - 7/28
3.2.3 Correlation with temperature and light phases
We next examined the correlation of sleep parameters with temperature and sunrise time. Sleep offset time significantly correlated with sunrise time and temperature (r = 0.890 (p < 0.01), -0.924 (p < 0.01), respectively). Sleep onset time did not significantly correlate to sunrise time (r = 0.097), but weakly correlated to the temperature (r = -0.365 (p < 0.01)). MS also correlated to both sunrise time and temperature (r = 0.779 (p < 0.01), -0.896 (p < 0.01), respectively). Fig 9 shows the sleep parameter plot against temperature and sunrise time. Since the seasonal fluctuation is small, sleep onset time did not show a clear correlation with either temperature or sunrise time (Fig 9A). Sleep offset time showed significant correlations both with temperature and sunrise time (Fig 9B). The regression coefficient was bigger during weekends than during weekdays. Sleep offset time became earlier and earlier within the temperature region between 5 to 25 ℃ and almost linearly correlated with sunrise time. MS also showed a similar trend, but the correlation was slightly weaker than the sleep offset time (Fig 9C). WASO showed a U-shaped correlation with temperature (Fig 9D). WASO was at minimum at around 15 degrees ℃, and increased gradually with colder temperatures and increased rapidly with higher temperatures. WASO showed a complex correlation curve with sunrise time. SE showed an inverse U shape correlation with the temperature (Fig 9E). SE was at maximum at around 15 degrees ℃ and decreased very gradually with colder temperatures and decreased very rapidly with higher temperatures.
Table 8. Date of local maximum, minimum and intermediate points of each parameter. Local maximum and minimum date were calculated using spline interpolated data in summer and winter. Intermediate date were then calculated as the half point between the maximum and minimum in spring and autumn.
24
In order to clarify the relationship between sleep offset time and sunrise time, the data were separated into two groups according to the period, one from winter solstice to summer solstice (December - June, Fig 10, blue) and the other from summer solstice to winter solstice (June - December, Fig 10, red). The sleep offset time is significantly earlier in the latter group (June - December) (p < 0.01).
25 (c)
(b) (a)
26
Figure 9. Correlation of the averaged sleep parameters, (a) Sleep onset time, (b) Sleep offset time, (c) MS, (d) WASO, and (e) SE compared with temperature (left panels) and sunrise time every 5 min (right panels). All day (open circles), weekday (open triangles) and weekend (crosses). Averaged data are plotted. Dotted lines indicate smoothed data with spline interpolation. One plotted dot corresponds to more than 1,000 subject-nights.
(d)
27
Figure 10. Correlation of the average of sleep offset time with sunrise time every 5 min (corresponds to Fig. 8b, right panel). All day (open circles), weekday (open triangles) and weekend (crosses). Averaged data are plotted. The data is also divided into two periods (Dec, winter solstice to Jun, summer solstice; blue, and Jun, summer solstice to Dec, winter solstice; red). Dotted lines indicate smoothed data with spline interpolation. One plotted dot corresponds to more than 500 subject-nights.
28 3.2.4 Discussion of seasonal change of sleep
In this study, we analyzed seasonal changes in human sleep using large-scale longitudinal objective sleep data in the Japanese population obtained by a contactless biomotion sensor. We used age adjusted sleep parameter values, because the data were from an age-sex mixed population. We found significant seasonal fluctuations both in the phase and the quality of sleep.
As for sleep / wake phases, sleep onset time was stable over the course of a year, while sleep offset time changed significantly according to the season of the year. This suggested that Japanese people spend night time on their own preferred schedule, and bed time was not significantly affected by natural climate changes. Although social time restricts the wake-up time, especially on weekdays, sleep offset time followed the change of sunrise time, and it also followed the change in temperature. Therefore, even though the sunrise time is the same, sleep offset time in spring is later than sleep offset time in autumn (see Fig 10). The seasonal difference during the course of a year, i.e. amplitude of the sleep offset time on weekends averaged over the three years, was 29.2 min, and was larger than that on weekdays (15.6 min), suggesting that sleep offset time on weekends is more susceptible to natural environmental changes. However, the amplitude of sleep offset time on weekends is smaller than the difference of sleep offset time between weekday and weekends (51.4 min), which is associated with social jet lag. This may suggest that effects from natural environmental changes are weaker than the effects of social restraints.
Our results are comparable to a recent study which investigated the seasonal variation in sleep-wake times using a questionnaire in a large scale of population (9765 subjects) in Europe39. First, seasonal changes of photoperiod influenced the mid-sleep time on free days
adjusted for sleep debt, age and sex through the season (DST and standard zonetime periods - SZT). Second, social jet lag contributed more to the variation in sleep duration than natural seasonal sleep time variation. As discussed above, weekly variation was bigger than the amplitude of fluctuation through the year. The characteristic point of our study using the Japanese population instead of people from other countries is the absence of DST in Japan. This may the one reason that clear seasonal variation can be seen through the year compared with previous studies in the weekly average analysis.
One previous study indicated that the seasonal adaptation to changing photoperiods does not occur during the period of DST and that the human circadian system could not adjust to the transition pertaining to DST40. Under both controlled conditions and natural routine life,
significant seasonality was detected in the in-bed and wake-up times in young males14,15. In
another study using actigraphy in the subjects’ homes, a significant difference was detected only in wake-up time in elderly subjects41. Our results coincided with the latter study. One
29
possible explanation for this discrepancy is the difference in measurement conditions, particularly in the artificial conditions of the laboratory compared to natural conditions at home. In an advanced society, as humans are exposed to strong artificial lights after sunset and our life is influenced by social factors, the effects of seasonal sun light differences on in-bed time become weaker. On the other hand, we are exposed direct sun light before our usual wake-up time during summer, which is strongly influential.
In the analysis of weekly variation, bedtime and wake-up times were more delayed on weekends than on weekdays. On the other hand, seasonal variation showed that the magnitude of fluctuation of sleep offset time is larger on weekends (29.2 min) than on weekdays (15.6 min). This suggests that social time more strongly regulates our activity during weekdays, and the effects of natural entrainment factors emerge more explicitly on weekends when people usually become released from social obligations. However, sleep offset time also fluctuated by about 15 min according to season, while social obligations start at similar times throughout the year. The seasonal variation is smaller than social jet lag, also reflected in the results from previous work that examined the chronotype of nearly 10,000 people in Europe using the Munich Chronotype Questionnaire (MCTQ)8.
Another interesting finding in this study is the relationship of the phases between sleep offset time and natural photoperiods. The phases of natural seasonal climate changes are different. From winter to summer, sunrise time, sunset time and temperature get earlier, later and higher, and they reach their summer peaks on approximately June 9, June 26 and August 1 in Japan, respectively. As a result, day length becomes longer and the longest day is around June 21, which is between the earliest sunrise and the latest sunset. The day of the highest temperature delay is nearly two months from the day of earliest sunrise in Japan. The earliest sleep offset time was observed around July 10 in 2013 and 2014, which is after all of the photoperiod-related peaks (sunrise, sunset and day length) and before the temperature peak. Conversely, from summer to winter, sunrise time, sunset time and temperature become later, earlier and lower, and they reached to their winter peaks at around January 4, December 3, and January 15, respectively. Day length becomes shorter and the shortest day is around December 21. Sleep offset time becomes progressively later and its winter peak is around January 17, which is near the temperature nadir. Therefore, even when the sunrise times are equal, sleep offset time in spring is later than in autumn. Since our circadian time is entrained strongly by light42, this delay may be due to nonphotic entrainment,
including temperature. In sum, the timing of sleep is affected by multiple environmental factors, predominantly photoperiod, but the impact is smaller compared with the effects of social needs.
30
Since it is very hard to assess sleep quality properly by subjective sleep log scoring or questionnaires, an objective method is necessary in order to look into sleep quality. However, it is difficult to gather large scale data using previous objective methods such as actigraphs, because subjects need to wear it during sleep and they involve considerable cost. Since our monitor is contactless, the subjects do not feel any stress during sleep measurement. Measurements start either automatically or by pushing one button, and after that the resulting data is transferred over the internet. Therefore, the cost of gathering data is almost negligible, which enabled us to analyze nearly one million nights of data.
One good parameter of sleep quality, WASO, increased in both high and low temperatures. Previous studies reported that both cold exposure and heat exposure increased the total time of wakefulness in a laboratory environment; however, the subjects were instructed not to wear a night suit or use a blanket, which differs from real life43. There was no significant
difference between cold exposure and normal conditions if the subject uses normal bedding44.
Another study reported that WASO significantly increased in elderly people in summer compared to fall and winter, where the outside temperature was 25.2, 9, and 1.4 degrees ℃, respectively41. Our result indicated that even inside houses and using the preferred settings
of subjects’ air conditioners, bedding and outfit, both the hottest and coldest outside temperatures impaired the sleep quality and increased WASO in Japan. However, since the worsening changes in SE is milder in winter than in summer, increasing WASO in winter caused by the longer times in bed in winter is longer than that of summer.
31
4. Limitation
Our study has several limitations. First, the subjects might not have been representative of the general Japanese populations because they bought the contactless biomotion sensor and uploaded the data to the web-based healthcare application of their own volition. Thus, they may have sleep problems or have been interested in sleep. Second, although the validity of the system is confirmed, the contactless biomotion sensors tend to underestimate the wake condition. When subjects are awake but motionless, the contactless biomotion sensors label the condition as sleep, and as a result, sleep onset latency, WASO and SE may be shorter than the actual states that measure using PSG.
Furthermore, although data from the “absent” state were excluded to avoid measurement errors, the database may include other types of measurement errors. For example, people stay awake intentionally after starting the measurement (e.g., reading a book, using a smartphone), do something near the sensor when it remains measuring because the person forgot to push the stop button (e.g., change clothes, brushing teeth), or go back to sleep after stopping the measurement. The first and second types of errors detect incorrectly early bedtimes or later wake-up times, and as a result overestimate the TIB and wake state (sometime overestimate sleep state, it depends on the person’s behavior). The third type of error may underestimate the TIB and sleep state by detecting an incorrectly early wake-up time. Thus, these measurement errors affect the all of sleep parameters, and may tend to happen more on weekends than on weekdays. Third, although sometimes data were separated by weekdays and weekends similar to workdays and free days, the database did not contain any information about the subjects’ occupations. Therefore, some of the subjects might have worked on weekends and been off on weekdays. This might explain the differences between MSweekend − MSweekday values between our study and previous studies. Finally, environmental factor data such as temperature and sun time was connected to the subjects by their residence within prefectures. Therefore, data might not have reflected the subjects’ environment when they stayed far from home.
32
5. Conclusion
The size of our dataset is large enough to conclude that the weekly variation caused by social factors is larger than that caused by seasonal variation. Therefore, Japanese people tend to be forced to social jet lag every week. However, seasonal variation influences sleep phase and quality even in the highly artificial environment of the home, which is very informative.
Since some of the subjects measured and uploaded other health parameters along with sleep data, such as blood pressure, body weight, exercise and body temperature, which have been recorded in our database, we will analyze the relationship of sleep and other parameters to improve quality of life in future studies. Furthermore, widespread to measure sleep in home environment can help to clarify the index and criteria to diagnosis and treatment sleep related disorders.
33
6. References
1. Knutson KL, Van Cauter E, Rathouz PJ, DeLeire T, Lauderdale DS. Trends in the prevalence of short sleepers in the USA: 1975-2006. Sleep. 2010;33(1):37-45.
2. Nishitani N, Sakakibara H, Akiyama I. Short Sleeping Time and Job Stress in Japanese White-Collar Workers. Open Sleep J. 2013;6(1):104-109.
3. Morgenthaler TI, Croft JB, Dort LC, Loeding LD, Mullington JM, Thomas SM. Development of the national healthy sleep awareness project sleep health surveillance questions. J Clin
Sleep Med. 2015;11(9):1057-1062.
4. Sateia MJ, Buysse DJ, Krystal AD, Neubauer DN, Heald JL. Clinical practice guideline for the pharmacologic treatment of chronic insomnia in adults: an american academy of sleep medicine clinical practice guideline. J Clin Sleep Med. 2017;13(2):307-349.
5. De Chazal P, Fox N, O’Hare E, et al. Sleep/wake measurement using a non-contact biomotion sensor. J Sleep Res. 2011;20(2):356-366.
6. Hashizaki M, Nakajima H, Tsutsumi M, et al. Accuracy validation of sleep measurements by a contactless biomotion sensor on subjects with suspected sleep apnea. Sleep Biol
Rhythms. 2014;12(2):106-115.
7. Roenneberg T, Wirz-Justice A, Merrow M. Life between clocks: daily temporal patterns of human chronotypes. J Biol Rhythms. 2003;18(1):80-90.
8. Wittmann M, Dinich J, Merrow M, Roenneberg T. Social jetlag: misalignment of biological and social time. Chronobiol Int. 2006;23(1-2):497-509.
9. Roenneberg T, Allebrandt K V, Merrow M, Vetter C. Social jetlag and obesity. Curr Biol. 2012;22(10):939-943.
10. Yang C-M, Spielman AJ. The effect of a delayed weekend sleep pattern on sleep and morning functioning. Psychol Health. 2001;16(6):715-725.
11. TAYLOR A, WRIGHT HR, LACK LC. Sleeping-in on the weekend delays circadian phase and increases sleepiness the following week. Sleep Biol Rhythms. 2008;6(3):172-179. 12. Yang CM, Spielman AJ, D’Ambrosio P, Serizawa S, Nunes J, Birnbaum J. A single dose of
melatonin prevents the phase delay associated with a delayed weekend sleep pattern.
Sleep. 2001;24(3):272-281.
13. Foster RG, Roenneberg T. Human responses to the geophysical daily, annual and lunar cycles. Curr Biol. 2008;18(17).
34
14. Kohsaka M, Fukuda N, Honma K, Honma S, Morita N. Seasonality in human sleep.
Experientia. 1992;48(3):231-233.
15. Honma K, Honma S, Kohsaka M, Fukuda N. Seasonal variation in the human circadian rhythm: dissociation between sleep and temperature rhythm. Am J Physiol. 1992;262(5 Pt 2):R885-R891.
16. Van Dongen HP, Kerkhof G a, Klöppel HB. Seasonal covariation of the circadian phases of rectal temperature and slow wave sleep onset. J Sleep Res. 1997;6(1):19-25.
17. Pallesen S, Nordhus IH, Nielsen GH, et al. Prevalence of insomnia in the adult Norwegian population. Sleep. 2001;24(7):771-779.
18. Ohayon MM, Partinen M. Insomnia and global sleep dissatisfaction in Finland. J Sleep
Res. 2002;11(4):339-346.
19. Janson C, Gislason T, De Backer W, et al. Prevalence of sleep disturbances among young adults in three European countries. Sleep. 1995;18(7):589-597.
20. Sivertsen B, Øverland S, Krokstad S, Mykletun A. Seasonal variations in sleep problems at latitude 63°-65° in Norway. Am J Epidemiol. 2011;174(2):147-153.
21. Crowley SJ, Carskadon MA. Modifications to weekend recovery sleep delay circadian phase in older adolescents. Chronobiol Int. 2010;27(7):1469-1492.
22. Hasler BP, Dahl RE, Holm SM, et al. Weekend–weekday advances in sleep timing are associated with altered reward-related brain function in healthy adolescents. Biol Psychol. 2012;91(3):334-341.
23. Lee YJ, Park J, Kim S, Cho S-J, Kim SJ. Academic performance among adolescents with behaviorally induced insufficient sleep syndrome. J Clin Sleep Med. 2014.
24. Roepke SE, Duffy JF. Differential impact of chronotype on weekday and weekend sleep timing and duration. Nat Sci Sleep. 2010;2:213-220.
25. Monk TH, Petrie SR, Hayes AJ, Kupfer DJ. Regularity of daily life in relation to personality, age, gender, sleep quality and circadian rhythms. J Sleep Res. 1994;3(4):196-205.
26. Iwasaki M, Iwata S, Iemura A, et al. Utility of subjective sleep assessment tools for healthy preschool children: a comparative study between sleep logs, questionnaires, and
actigraphy. J Epidemiol. 2010;20(2):143-149.
27. Soehner AM, Kennedy KS, Monk TH. Circadian preference and sleep-wake regularity: associations with self-report sleep parameters in daytime-working adults. Chronobiol Int. 2011;28(9):802-809.
35
28. Carney CE, Edinger JD, Meyer B, Lindman L, Istre T. Daily activities and sleep quality in college students. Chronobiol Int. 2006;23(3):623-637.
29. Monk TH, Reynolds CF, Buysse DJ, DeGrazia JM, Kupfer DJ. The relationship between lifestyle regularity and subjective sleep quality. Chronobiol Int. 2003;20(1):97-107. 30. Zisberg A, Gur-Yaish N, Shochat T. Contribution of routine to sleep quality in community
elderly. Sleep. 2010;33(4):509-514.
31. Monk TH, Buysse DJ, Billy BD, et al. Circadian type and bed-timing regularity in 654 retired seniors: correlations with subjective sleep measures. Sleep. 2011;34(2):235-239.
32. Manber R, Bootzin RR, Acebo C, Carskadon MA. The effects of regularizing sleep-wake schedules on daytime sleepiness. Sleep. 1996;19(5):432-441.
33. Burgess HJ, Eastman CI. Early versus late bedtimes phase shift the human dim light melatonin rhythm despite a fixed morning lights on time. Neurosci Lett. 2004;356(2):115-118.
34. Leproult R, Holmbäck U, Van Cauter E. Circadian misalignment augments markers of insulin resistance and inflammation, independently of sleep loss. Diabetes.
2014;63(6):1860-1869.
35. Lee YJ, Cho S-J, Cho IH, Kim SJ. Insufficient sleep and suicidality in adolescents. Sleep. 2012.
36. Kang SG, Lee YJ, Kim SJ, et al. Weekend catch-up sleep is independently associated with suicide attempts and self-injury in Korean adolescents. Compr Psychiatry. 2014;55:319-325.
37. Kim C-W, Choi M-K, Im H-J, et al. Weekend catch-up sleep is associated with decreased risk of being overweight among fifth-grade students with short sleep duration. J Sleep Res. 2012;21(5):546-551.
38. Hwangbo Y, Kim W-J, Chu MK, Yun C-H, Yang KI. Association between weekend catch-up sleep duration and hypertension in Korean adults. Sleep Med. 2013;14(6):549-554.
39. Allebrandt K V, Teder-Laving M, Kantermann T, et al. Chronotype and sleep duration: the influence of season of assessment. Chronobiol Int. 2014;31(5):731-740.
40. Kantermann T, Juda M, Merrow M, Roenneberg T. The human circadian clock’s seasonal adjustment is disrupted by daylight saving time. Curr Biol. 2007;17(22):1996-2000. 41. Okamoto-Mizuno K, Tsuzuki K. Effects of season on sleep and skin temperature in the
36
42. Roenneberg T, Kumar CJ, Merrow M. The human circadian clock entrains to sun time. Curr
Biol. 2007;17(2).
43. Haskell EH, Palca JW, Walker JM, Berger RJ, Heller HC. The effects of high and low ambient temperatures on human sleep stages. Electroencephalogr Clin Neurophysiol. 1981;51(5):494-501.
44. Muzet A, Libert JP, Candas V. Ambient temperature and human sleep. Experientia. 1984;40(5):425-429.
37
7. Acknowledgements
I am grateful to Dr. K. Kume for instruction of research.