九州大学学術情報リポジトリ
Kyushu University Institutional Repository
海洋における希土類元素の炭酸塩スキャベンジング
西野, 博隆
http://hdl.handle.net/2324/2236033
出版情報:Kyushu University, 2018, 博士(理学), 課程博士 バージョン:
権利関係:
Carbonate scavenging of rare earth elements in the oceans
Hirotaka Nishino
Department of Earth and Planetary Sciences Faculty of Sciences
Kyushu University
i
Abstract
The oceanic cycling of rare earth elements (REEs) has not seen full explanation. Widely believed explanation is the combined mechanisms of "boundary exchange" and "reversible scavenging" (Siddall et al., 2008; Arsouze et al., 2009; Oka et al., 2009; Rempfer et al., 2011). In this model, REEs are exchanged with continental margin and the particles scavenge REEs from shallower layers of the ocean and release REEs to deeper layers of the ocean. However, there are the unclearness of what is
“boundary exchange” and what carries out “reversible scavenging”.
It has recently been indicated that REEs are contained in diatom frustules and that the presence of REEs in them could innovate the understanding of the circulation of REEs in the ocean (Akagi, 2013b; Akagi, 2013a). In this model, diatom frustules accumulate REEs in their frustules at the surface layer of the ocean. The diatom frustules settle down to the deeper layer of the ocean, and they are dissolved into the water with REEs. The released REEs are scavenged by particulate carbonate (Akagi, 2013a). Considering REE scavenging processes are keys to finalize the understanding on the REE cycling in the ocean, herein, I focus on the secondary scavenging with carbonate.
This thesis is comprised of three chapters.
In Chapter 1, I reviewed the understanding of the distribution of REEs in the oceans. The vertical distributions of REEs show nutrient-like profile. The mechanism to make these profiles is explained by "boundary exchange" and "reversible scavenging".
Previous studies explain the REEs profiles the model combining "boundary exchange"
and "reversible scavenging". However, there is few understanding what is “boundary
ii
exchange” and what is “reversible scavenging” In the recent study (Akagi, 2013b;
Akagi, 2013a), an idea is introduced that diatom frustules drive circulation of REEs.
however, the idea is not universally in the oceans because the idea was led at bearing sea where has high productivity of diatoms. Therefore, I introduced an idea to explain the distribution of REEs in the oceans, the idea is combination of “primary scavenging”
and “secondary scavenging”.
In Chapter 2, I developed a self-consistent algorithm to evaluate the importance of the two scavenging processes. The calculation requires reported vertical profiles of REEs and nutrients (Si or P) and provides the composition of surface plankton (primary scavenging) and REEs partitioning patterns between “secondary scavenger” and seawater. The results of calculation show us that carbonate and oxide are the main secondary scavengers of L+MREEs and organic matters are the that of HREEs. It is explained that carbonate particles play important role on scavenging REEs in the oceans by calculation.
In Chapter 3, I developed a new experimental method to determine naturally effective partitioning coefficients of REEs between calcite and seawater. The partitioning coefficients of REEs were estimated conventionally by precipitating calcite in solution. The partitioning reaction in the oceans are not precipitation but more like exchange reaction, and kinetic effect disturb the partitioning if the precipitation occurs rapidly. In my study, I estimate the partitioning coefficients by measuring finer calcite particles which are better reacted with seawater. The results of the experiments show a similar feature with partitioning patterns obtained from observational data and these calculated partitioning pattern in Chapter 2.
In Chapter 4, these results of two separate studies, calculation with double
iii
scavenging model and experiments under the nearer natural condition than previous studies indicate that scavenging processes are key factors to better understanding the behavior of REEs in the oceanic cycling, and that, among all, carbonate plays role in redistributing dissolved REEs within water columns.
iv
Acknowledgements
This thesis was completed in the course of the running studies at the laboratory of Inorganic Geochemistry for the Biosphere, while I was in doctoral course of Department of Earth and Planetary Sciences, Graduate School of Science, Kyushu University. I am deeply grateful to my supervisor, Prof. Tasuku Akagi at this University, for his long-term support. His guidance, encouragement and advice made this work go forward enormously. I would like to thank Assoc. prof. Junichiro Ishibashi and Assoc.
prof. Hiroshi Tsuno at Yokohama National University, and Prof. Yasutaka Terakado at Kobe University. Their constructive advice and comments have been a great help in discussion of the paper.
Dr. Seiichiro Uehara at this University for his help in the XRD analysis. Last of all, I acknowledge support by all faculty members at the department and encouragement of the past and present members of the laboratory.
v List of figures
Fig. 2-1 Examples of vertical profiles of REEs depicting depletion of L&MREEs from the North Pacific (Piepgras and Jacobsen, 1992), Indian (Bertram and Elderfield, 1993) and Atlantic (Zheng et al., 2016) Oceans. The concentration of each REE is normalized to 0 at the surface and to 1 at the deepest layer.
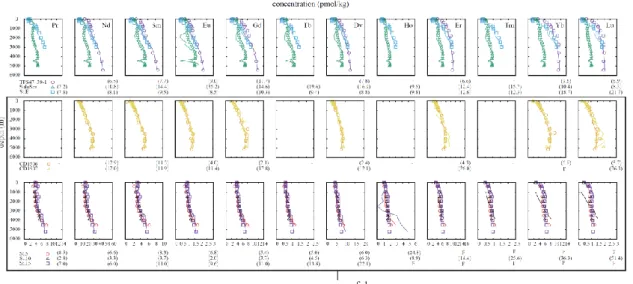
Fig. 2-2 Fitting examples of vertical distributions of water columns in the North Pacific, Indian and Atlantic Oceans by Si-based calculation. Reported data are indicated by marks and fitting data are shown in lines. The bold numbers in parentheses under figures are relative standard deviations of residues of fitting (%); - missing data; F calculation failure. Those results, where calculation of one or more elements was failed, are judged unsuccessful and are shown in the box.
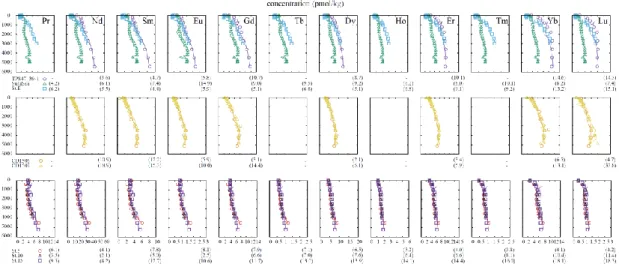
Fig. 2-3 Fitting examples of vertical distributions of water columns in the North Pacific, Indian and Atlantic Oceans by P-based calculation. Reported data are indicated by marks and fitting data are shown in lines. The bold numbers in paretheses under figures are relative standard deviations of rediues of fitting (%); - missing data.
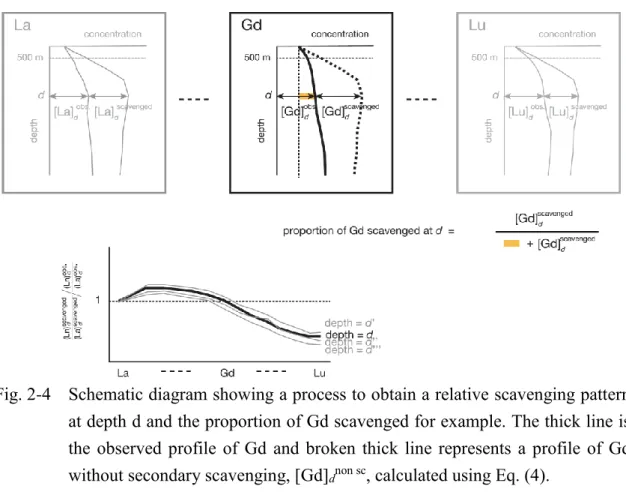
Fig. 2-4 Schematic diagram showing a process to obtain a relative scavenging pattern at depth d and the proportion of Gd scavenged for example. The thick line is the observed profile of Gd and broken thick line represents a profile of Gd without secondary scavenging, [Gd]dnon sc, calculated using Eq. (4).
Fig. 2-5 Algorithm of self-consistent calculation.
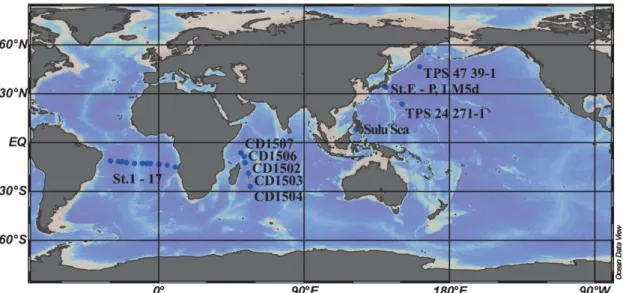
Fig. 2-6 Map showing the geographical origin of data used for the self-consistent calculation.
Fig. 2-7 Relative standard deviation of residues for fitting using the calculated
vi
composition of primary scavengers and relative partitioning pattern of scavenging.
(a)Si-based calculation and (b) P-based calculation. The relative standard deviations of calculation-failed elements are not considered.
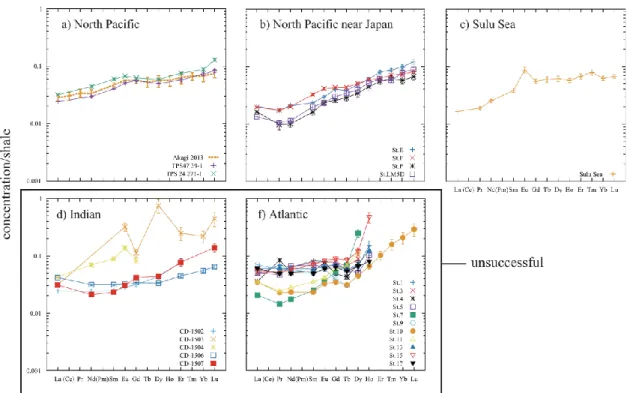
Fig. 2-8 Shale normalized patterns of the compositions of diatom frustules estimated by the self-consistent calculation using Si as representative nutrient (Si-based SCCP). The Ln/Si ratios are converted to the concentration of diatom frustules assuming the composition SiO2+0.4H2O. In Fig. 5a, the diatom frustule composition determined analytically at Station AB in the Bering Sea is also plotted (Akagi, 2013a). Those results, where calculation of one or more elements was failed, are judged unsuccessful and are shown in the box.
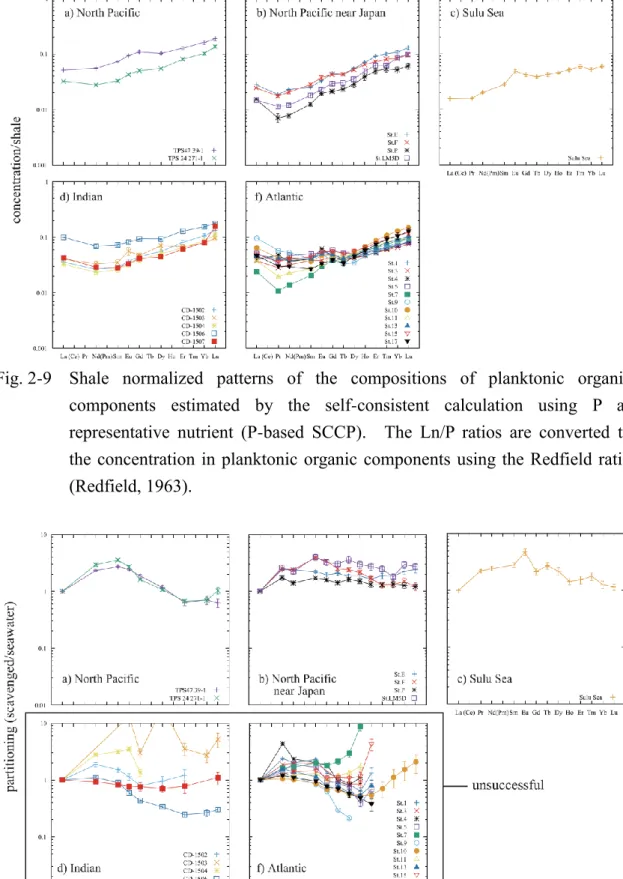
Fig. 2-9 Shale normalized patterns of the compositions of planktonic organic components estimated by the self-consistent calculation using P as representative nutrient (P-based SCCP). The Ln/P ratios are converted to the concentration in planktonic organic components using the Redfield ratio (Redfield, 1963).
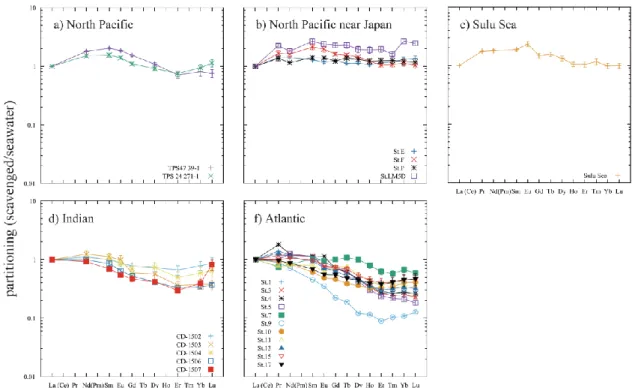
Fig. 2-10 Self-consistent partitioning pattern of scavenging calculated using Si as representative nutrient (Si-based SCRPS). Those results, where calculation of one or more elements was failed, are judged unsuccessful and are shown in the box.
Fig. 2-11 Self-consistent partitioning pattern of scavenging calculated using P as representative nutrient (P-based SCRPS)
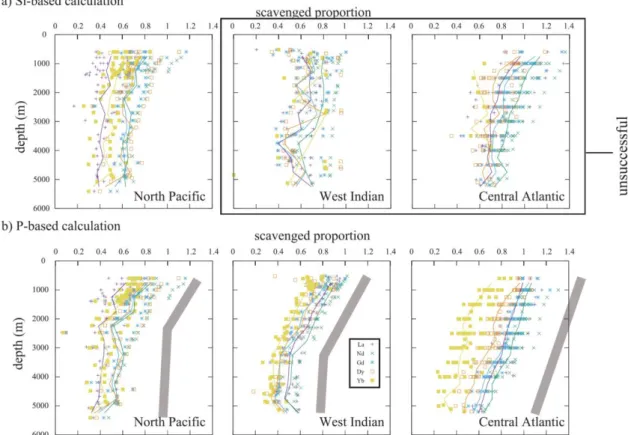
Fig. 2-12 Vertical profiles of scavenged proportion of La, Nd, Gd, Dy and Yb in the Pacific Indian and Atlantic Oceans. Lines are average profiles of the oceans.
Thick gray lines are simplified trends of the average profiles. a) Si-based calculation; b) P-based calculation. Those results, where calculation of one or more elements was failed, are judged unsuccessful and are shown in the box.
vii
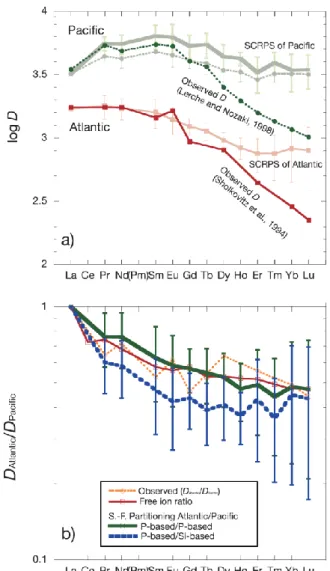
Fig. 2-13 Partitioning patterns of REEs between particulate carbonate and seawater, together with self-consistent relative partitioning patterns of scavenging (SCRPSs) (a) and their difference between the Pacific and Atlantic Oceans (b). In Fig. (a) the vertical positions of the lines have no meaning. Only water columns of successful calculations are considered. In Fig. (b) the conditions of the thermodynamic calculations are pH=8, pCO2=0.0008 and [Si]=20 mol/kg for the deep Atlantic Ocean water and pH=7.5, pCO2=0.001 and [Si]=150 mol/kg for the deep Pacific Ocean water.
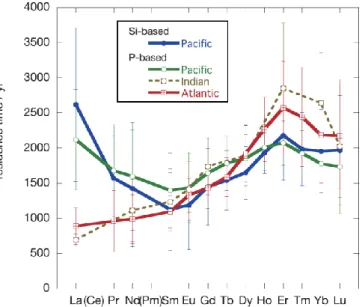
Fig. 2-14 Residence time of rare earth elements calculated relative to turnover rate of nutrient. Only water columns of successful calculations are considered.
Fig. 3-1 Illustration of the experimental device.
Fig. 3-2 [La]/[Ca] ratio versus reciprocal of average size of size-separated calcite (red dots). The lines are theoretically calculated relationship when thickness of partitioning is 5 m (REE, REE + Mn) and 0.9 m (REE + Fe). The green crosses show the observed concentration of calcite.
Fig. 3-3 Partitioning pattern of REEs of calcite. Solid lines are for pCO2 300 ppm and broken lines are for pCO2 10000 ppm.
Fig. 3-4 Partitioning pattern of REEs of smallest particles. Solid lines are for pCO2 300 ppm and broken lines are for pCO2 10000 ppm. a) and b) are partitioning patterns of calcite and aragonite, respectively.
Fig. 3-5 Partitioning patterns of REEs with varying amounts of REE spike to the seawater. Closed marks are for pCO2 300 ppm and open marks are for pCO2
10000 ppm
viii
Fig. 3-6 The calculated proportion of REE species in seawater when the condition is (a) pCO2 = 300 ppm, pH = 8.10 and (b) pCO2 = 10000 ppm, pH = 6.90.
Fig. 3-7 Solid lines are the REEs partitioning pattern of calcite with pCO2 = 10000 ppm (Stage 2) divided by that with pCO2 = 300 ppm (Stage 1). Broken lines are the proportion ratio of chemical species of REEs calculated at pCO2 = 10000 ppm and pH = 6.90 and that at pCO2 = 300 ppm and pH = 8.10.
Fig. 3-8 Solid lines are the REEs partitioning pattern of aragonite with pCO2 = 10000 ppm (Stage 2) divided by that with pCO2 = 300 ppm (Stage 1). Broken lines are the proportion ratio of chemical species of REEs calculated at pCO2 = 10000 ppm and pH = 6.90 and that at pCO2 = 300 ppm and pH = 8.10.
Fig. 3-9 [La (or Lu)]/[ Ca] ratio versus reciprocal of average size of size-separated calcite in the Fe spiked experiment. The lines are theoretical relationship and the orange dots are differential values measured concentration in calcite.
Fig. 3-10 The partitioning patterns of measurement of sedimenal calcite (filled marker), experimental (open maker) and this study (solid and broken lines). The citations are ●(Parekh et al., 1977), ■(Scherer and Seitz, 1980), ▲(Palmer, 1985),
○(Tanaka and Kawabe, 2006), △(Zhong and Mucci, 1995) and ▽×(Toyama and Terakado, 2014).
Fig. 3-11 Partitioning patterns normalized to La. Patterns obtained in this experiments are shown in (a) and observational patterns are shown in (b).
ix List of tables
Table 2-1 Origins of data used for the self-consistent calculation
Table 2-2. Results of Si-based self-consistent calculation of diatom frustules and partitioning pattern of scavenging
Table 2-3. Results of P-based self-consistent calculation of diatom frustules and partitioning pattern of scavenging
Table 2-4 Experiments with artificial data.
CONTENTS
CHAPTER 1. INTRODUCTION 1
CHAPTER 2. DOUBLE SCAVENGING PROCESSES EXPLAIN THE
VERTICAL DISTRIBUTION OF REES IN THE OCEANS: IMPORTANCE OF SURFACE PLANKTON AS A PRIMARY SCAVENGER AND
CARBONATE/OXIDE AS A SECONDARY SCAVENGER. 6
2.1. Introduction 6
2.2. Methods 9
2.2.1. Algorithm for self-consistent calculation of composition of surface
plankton and relative partitioning pattern of scavenging 9
2.2.2. Data set used to the calculations 13
2.3. Results 15
2.3.1. Self-consistent compositions of surface plankton (SCCPs) 15 2.3.2. Self-consistent relative partitioning pattern of scavenging (SCRPS) 16 2.3.3. Proportion of scavenged REEs to those supplied by remineralization of
plankton 17
2.4. Discussion 19
2.4.1. Validity of the self-consistent calculation 19
2.4.2. Possible carriers (primary scavengers) of REEs from surface to deep
water 22
2.4.3. Two possible scavenging phases (secondary scavengers) for REEs in the
deep water 26
2.4.4. Residence time of REEs 30
2.5. Conclusion 32
2.6. Figures 34
2.7. Tables 45
CHAPTER 3. A NEW EXPERIMENTAL METHOD DETERMINES PARTITIONING COEFFICIENT OF RARE EARTH ELEMENTS
BETWEEN CALCITE AND SEAWATER. 49
3.1. Introduction 49
3.2. Theory and methods 51
3.3. Results 56
3.4. Discussion 59
3.5. Conclusion 65
3.6. Figures 66
CHAPTER 4. CONCLUSION 72
REFERENCES 73
1
Chapter 1.
Introduction
Rare earth elements (REEs) are the third group elements which consists of Sc, Y and lanthanoids (57La – 71Lu), but not of actinoids. REEs have valence of three in their outermost shell, and, therefore, they show similar chemical property. Sometimes only lanthanoids (without Sc and Y) is referred to as REEs because their chemical properties are extremely similar within lanthanoids (In this study, the term “REEs” is used to refer to lanthanoids). REEs in the oceans exist as trivalent ions except cerium.
Cerium is oxidized in oxidative environment and dissolved oxygen in seawater oxidate Ce3+ to Ce4+. REEs chemical properties are very similar, but they are not identical.
The positive charge of the nucleus of REEs are increasing as the atomic number is increasing. Because the additional electrons are placed into inner shell (4f), the enforced positive charge of nucleus is pulling the electrons of outermost shell and, as a result, the ionic radius shrink with increasing atomic number (i.e., lanthanoid contraction). The shrinkage of ionic radius yields the gradual change of chemical properties of REEs.
REEs are very useful tool in geochemistry. Because of the slight difference in their chemical behavior, the difference in REEs composition in geochemical samples reflects the history of chemical reactions experienced by the REEs in the samples. The REEs in the earth materials are originated solely from meteorites, whose compositions are more or less similar. The REE compositions of the mantle, crust, and further respective rocks in them should reflect the history of myriad physicochemical or partitioning reactions, through which the mantle, crust and rocks are produced. The REE composition of them are often normalized to the chondritic composition and
2
plotted in a logarithmic scale in order of atomic number (named as REE abundance pattern). It is important that each rock, mantle, crust samples has a distinct REE pattern and REE patterns are sometimes regarded as “finger prints” of geochemical matter.
When REEs are firstly applied to marine geochemical studies, REEs seem to have been expected to be potent tracers to reveal scavenging process in the oceans (e.g.
Elderfield and Greaves, 1982). However, as mentioned later, REEs have failed to identify the scavengers in oceanic columns until now. REEs are now more often used as the tracers of water mass (e.g. Siddall et al., 2008; Rempfer et al., 2011).
The elements in the oceans are classified to three types according to their vertical dissolved concentration profiles. The three types are conservative (e.g. Na, K, Ca), nutrient-like (e.g. N, P, Si) and scavenged (e.g. Al, Mn). The concentrations of nutrient-like and scavenged type elements gradually decrease and increase from surface to deep water, respectively. The residence times in the oceans differ depending on the types. The conservative type elements have very long residence time (>105 years) and the vertical profiles are well mixed and uniformed. The scavenged type elements have very short residence time (<1000 years), because the affinity or adsorption with scavenging particles is high. Nutrient-like type elements are carried by plankton from surface to deep water, where elements are re-mineralized. The residence time is between those of conservative and scavenged types. Nitrate and phosphate are taken in by phytoplankton when they produce organic matter. Silicate is taken in by diatoms as an important element to produce their frustules. Other trace elements which are used for biological activities show nutrient-like type profiles.
The REEs show nutrient-like type of vertical profiles in the oceans, however, it is difficult to explain by work of phytoplankton. One is that why and how
3
phytoplankton uptake REEs, and if phytoplankton is unrelated with REEs, what makes their vertical profiles nutrient-like type? None of them are known to be essential or beneficial to plankton. The other is paradox of residence time called “neodymium paradox” (e.g. Bertram and Elderfield, 1993; Jeandel et al., 1995; Siddall et al., 2008).
The residence time estimated from fingerprint of neodymium isotope are
~500 years (Elderfield and Greaves, 1982; Alibo and Nozaki, 1999). The residence time estimated from input flux is 4000 years (Bertram and Elderfield, 1993). One of the paradoxes is the huge discrepancy in the residence time among the estimation methods.
The other paradox emerges when residence time of 500 years is accepted. As I mentioned above, the elements having shorter residence time than about 1000 years in the oceans show scavenged type profiles. However, the vertical profiles of REEs show nutrient-like type. There seem to be a lot of things we do not know about the REEs cycle in the oceans.
There are some ideas to explain the REEs cycle. One is the combination of
“boundary exchange” and “reversible scavenging” (Siddall et al., 2008; Rempfer et al., 2011) and the other is diatom-uptake and carbonate/oxide scavenging (Akagi, 2013a).
The “boundary exchange” is exchange of REEs between continental margin and seawater, and explains similarity in Nd isotopic compositions between seawater and continental margin without additional REEs input (Lacan and Jeandel, 2005a). The
“reversible scavenging” is the scavenging of REEs at shallow followed by release of REEs at deep water. This assumption roughly succeeds to explain the profile of REEs.
However, what is “boundary exchange” and what carries out “reversible scavenging”
are still not clear. Furthermore, they did not reproduce the profile of the surface layer in their model. In the other hypothesis, diatom-uptake is the new idea to explain the
4
nutrient-like profiles. A part of REEs is in the form of silicic acid compositions and diatoms uptake only them when they produce silicic frustules (Akagi, 2013a). The REEs taken in by diatoms are carried to deep water and dissolved in the course of frustule dissolution in the deep water. The REEs are re-scavenged by carbonate/oxide particles without changing isotopic ratio of seawater (Akagi, 2013a). Its assumption can explain the profiles of REEs, but REEs compositions of diatom frustules has been obtained in a limited area where production of diatoms is very high. Furthermore, it is not sure that it can apply to Atlantic where the production of diatoms is much lower than pacific.
In the deep water, many possible particles as scavengers are reported (oxide (Sholkovitz et al., 1994), carbonate fluorapatite (Takebe, 2005), phosphate (Byrne and Kim, 1993) and organic matter (Sholkovitz et al., 1994; Kuss et al., 2001)). They are major constituents of settling particles and have the different shape of distribution pattern of REEs each other. Even just on carbonate, there have been reported a variety of partitioning patterns (Terakado and Masuda, 1988; Zhong and Mucci, 1995; Tanaka and Kawabe, 2006; Toyama and Terakado, 2014). Such ambiguity in partitioning data has weakened the discussion on the REE cycling in the oceans. Although Akagi (2013a) had reported at the northernmost Pacific that carbonate/oxide particles are the scavenger of REEs, this does not deny that the others particles play a role in scavenging of REEs in the others oceans.
These uncertainness of REEs have deterred us from understanding the REEs cycle in the ocean. Therefore, in this study, I have tackled with two subjects. One is to determine what makes REEs profiles nutrient-like type and which scavengers play a role in differentiating profiles of each REE in deep water using a new idea. The other is to determine the most appropriate partitioning of REEs between carbonate and seawater,
5
which should be directly applicable to the REE cycling in real oceans, using a new method based on a novel concept.
6
Chapter 2.
Double scavenging processes explain the vertical distribution of REEs in the oceans: importance of surface plankton as a primary
scavenger and carbonate/oxide as a secondary scavenger.
2.1. Introduction
Many vertical profiles of rare earth element (REE) concentration in seawater have been reported since 1980 (Elderfield and Greaves, 1982; De Baar et al., 1985;
Piepgras and Jacobsen, 1992; Bertram and Elderfield, 1993; German et al., 1995; Zhang and Nozaki, 1998; Alibo and Nozaki, 1999; Nozaki et al., 1999; Osborne et al., 2014;
Molina-Kescher et al., 2014; Zheng et al., 2016). They typically show overall increases with depth and relative depletion of lighter (L) and middle (M) REEs in the intermediate depth. These two features are clearly seen in the normalized depth profiles in all oceanic water columns (Fig. 2-1).
The first feature “overall increase with depth” has been explained by
“reversible scavenging”, where REEs scavenged at the surface are released in the deep water. Simulation of this mechanism roughly reproduces the observed REE distribution (Oka et al., 2009; Siddall et al., 2008). Some recent observations suggest that surface plankton scavenges REEs (Hara et al., 2009; Strady et al., 2015), but other phases such as oxide (Sholkovitz et al., 1994), carbonate (Takebe, 2005), phosphate (Byrne and Kim, 1990), organic matter (Kuss et al., 2001; Sholkovitz et al., 1994) and clay (Kuss et al., 2001; Rousseau et al., 2015) are also considered as possible scavengers. It is a matter of controversy which phases are responsible for the release of REEs in the deep water.
7
The second feature “depression of L+MREEs in the intermediate layers” has often been discussed in connection with the oxygen minimum zones, where released Mn or Fe ions from particles reprecipitates to absorb dissolved REEs (German and Elderfield, 1990; Sholkovitz et al., 1994; Bayon et al., 2004). However, this line of discussion leads to difficulty in explaining the release of REEs in more oxic deeper water.
So far, most discussion has followed from the assumption that a host of REEs identified in seawater or sediments is the scavenger of REEs in the surface water and transporter of REEs to the deep water at the same time. Diatom frustule REE composition inspired an alternative view on the REE cycling in the oceans (Akagi et al., 2011; Akagi, 2013a): Diatom frustules are likely to be the main carriers of REEs in the North Pacific water columns, and release REEs in the course of frustule dissolution (Akagi, 2013a); a portion of the REEs dissolved in deep water are scavenged by carbonate/oxide phases of particles (Akagi, 2013a). In the new view, diatom frustules are primary scavengers of REEs in the surface water with carbonate/oxide being a secondary scavenger in deep water. The primary scavenger aptly explains non-zero
surface concentration (Akagi, 2013a); the secondary scavengers produce characteristic differences in vertical profiles among REEs. Because REE/Si in diatom frustules is greater than those of REE/Si ratios in the deep water, this new view further implies that there is input of REEs at the surface. Nd istopic consideration (Akagi et al., 2014) have shown that the steady-state of Nd isotope as well as REE composition in the water column are indeed satisfied only if surface inputs are introduced, and identified loess and island-arc matter as the extra surface input. Lithogenic input has been suggested by intensive observation of an estuarine and coastal area (Rousseau et al., 2015). Our hypothesis regarding a mechanism responsible for the observation is that the input of
8
such lithogenic matter is via incorporation of the matter into diatom frustules, from which REEs are released to water columns during the frustule dissolution.
We revisited reported REE profiles of water columns where silicic acid and phosphate profiles were also available. These profiles are expected to possess features that reflect an increase of REE concentration in accord with nutrient concentration profiles, and the REE/Si(or P) ratio of the input can be extracted through an appropriate mathematical algorithm. There are relatively few instances of published REE profiles, which reported REE, Si and P data at a sufficient number of different depths, but such profiles are available for the North and Central Pacific, Indian and Southern and Central Atlantic Oceans. The aim of this study is to see how well the idea of surface input and double scavenging processes can explain the observed vertical profiles of REEs and to see how reasonable the outcomes (i.e. the type of primary scavengers, REE compositions of the primary scavengers, and REE removal by secondary scavenging) of the calculations are, and finally to see if the scavenged amount is appropriate in view of residence times of REEs.
9 2.2. Methods
2.2.1. Algorithm for self-consistent calculation of composition of surface plankton and relative partitioning pattern of scavenging
REEs are assumed to be supplied to a deep water column solely by the dissolution of surface plankton, which has incorporated REEs by means of primary scavenging. The surface plankton is likely to be phytoplankton. Within the water column at any given location, the composition of the plankton is assumed unique (Assumption 1). REEs are released to the water column through remineralization of the plankton, which releases nutrient (Si from diatom frustules or P from organic components of plankton) at the same time, thereby keeping REEs/Si(or P) constant.
A portion of the released REEs is later removed by particles in the deep water (secondary scavenging). The particulate phases responsible for the secondary scavenging are assumed to be unique to a water column, and therefore the scavenged pattern between particles and seawater can be assumed unique in a given water column (Assumption 2). If the secondary scavenging phase is dominated by a simple carbonate/oxide phase, as observed in the Bering Sea, we expect that Assumption 2 would not be unrealistic. In real oceans, where lateral flows prevail, the vertical process modelled in this study is often disturbed by lateral flows. The vertical process takes place typically over a time scale of 400 years (Treguer et al., 1995), which is similar to or shorter than the oceanic residence time of REEs (Elderfield and Greaves, 1982; Alibo and Nozaki, 1999). One can assume that the vertical process resets/overprints the effects of lateral processes at least once and vertical process should still be one of the most influential processes governing REE vertical profiles. Also laterally-inserted/replaced water should convey dissolved Si or P from remineralization of surface plankton with a
10
similar REE composition. These considerations lends support to the handling of the vertical model. The validity/invalidity of the two assumptions would be evaluated by how well the calculation outcomes reproduce the observed profiles (Fig. 2-2 and Fig.
2-3).
The model can be expressed mathematically by the following two equations:
[Ln]𝑑obs. = [Ln]𝑑=0obs. + (Ln
Nu)plankton× ([Nu]𝑑 − [Nu]𝑑=0) − (Ln)𝑑scavenged (1) and
𝐷Ln =
(Ln)𝑑 scavenged (La)𝑑
scavenged [Ln]𝑑obs.
[La]𝑑obs.
= const.(>0) (2)
In equations (1) and (2), [Ln]obs.d is the observed concentration of Ln, a given REE, in seawater at a depth of d, and [Nu]d is the observed concentration of a nutrient element at a depth of d. Nutrient elements considered in this study are Si and P. (Ln/Nu)plankton and (Ln)scavengedd represent the ratio of Ln relative to that of Nu in surface plankton and the absolute amount of Ln scavenged by particles (secondary scavenging) at a depth of d,
respectively.
(Ln)𝑑 scavenged (La)𝑑
scavenged [Ln]𝑑obs.
[La]𝑑obs.
, or more simply denoted as (
Ln La)
𝑑 scavenged
[LnLa] 𝑑
obs. , in equation (2) is the partitioning coefficient (secondary scavenging) of Ln between particles and seawater relative to that of La at a depth of d. This process is schematically shown in Fig. 2-4.
The goal of the calculation is to obtain a set of (Ln/Nu)plankton to minimize both the element-averaged relative standard deviation (RSD) of (Ln/La)scavengedd/[Ln/La]obs.d and that of residues in fitting to reported vertical profiles at all the observation depths. A greater (Ln/Nu)plankton yields greater (Ln)scavenged, which
11
often tends to reduce RSD of (Ln/La)scavengedd/[Ln/La]obs.d, but tends to increases RSD of fitting. The two RSDs generally behave differently against varying (Ln/Nu)plankton, and the sum of the two RSDs was minimized by tuning (Ln/Nu)plankton. Because a set of solutions is given in the calculation as the assumption, the calculation is referred to as the self-consistent calculation. The idea of a partitioning between the scavenging phase and seawater is also supported by the fast redistribution of Nd invoked to explain the similarity of Nd isotope ratios between a labile particulate phase and seawater (Tachikawa et al., 1999).
The algorithm of the calculation is illustrated schematically in Fig. 2-5 and described in the following steps:
Step 1) Using a given (Ln/Nu)plankton, (Ln)scavengedd is calculated using eq. (3) for each depth, d.
(Ln)𝑑scavenged = [Ln]𝑑=0obs. + (Ln
Nu)plankton× ([Nu]𝑑 − [Nu]𝑑=0) − [Ln]𝑑obs. (3) Step 2) The relative standard deviation (RSD) of (
Ln La)
𝑑 scavenged
[Ln La]
𝑑
obs. for the dataset at all depths is calculated for each REE, Ln.
Step 3) Values of (Ln/Nu)plankton other than (La/Nu)plankton are tuned to minimize the RSD of Step 2.
Step 4) By averaging (
Ln La)
𝑑 scavenged
[LnLa] 𝑑
obs. for all d, 𝐷Lnaverage is obtained. By averaging the RSD of scavenging of all REEs, RSDscavenging is obtained.
Step 5) Using the tuned (Ln/Nu)plankton, estimated concentration of La without secondary scavenging at depth = d, [La]dnon sc and reproduced concentration of Ln with secondary scavenging at depth = d, [Ln]drepro, are calculated using eqs. (4) and (5) for each depth,
12 d.
[La]𝑑non sc= [La]𝑑=0obs. + (La
Nu)plankton× ([Nu]𝑑 − [Nu]𝑑=0) (4) [Ln]𝑑repro = [Ln]𝑑=0obs. + (Ln
Nu)
plankton
× ([Nu]𝑑 − [Nu]𝑑=0)
− 𝐷Lnaverage× ([La]𝑑non sc− [La]𝑑)
(5)
Step 6) The standard deviation (SD) of the residue of reproduction, [Ln]drepro-[Ln]dobs., at all depths is calculated for each REE, Ln. Next, RSD of the residue is calculated by dividing the SD by average concentration of Ln below 500 m depth. The RSD of the reproduction, RSDfitting, is obtained by averaging the RSDs of all REEs.
Step 7) Sum of the two RSDs (RSDscavenging + RSDfitting) is calculated.
Step 8) (Ln/Nu)plankton is increased (or decreased) and Steps 1 to 7 are repeated.
Step 9) If RSDscavenging + RSDfitting has decreased, (Ln/Nu)plankton is varied in the same direction as that of Step 8. Otherwise, it is varied in the opposite direction.
Step 10) Steps 8 and 9 are repeated to minimize RSDscavenging + RSDfitting and output the set of (Ln/Nu)plankton as a self-consistent composition of plankton (SCCP) and the set of
(LnLa) average scavenged
[Ln La]obs.
obtained using the self-consistent composition, as a self-consistent relative
partitioning pattern of scavenging (SCRPS).
In Steps 1 to 10, Ce data were entirely excluded as this element shows anomalous behavior due to its preferred tetravalent state in seawater (Goldberg and Koide, 1963; Akagi and Masuda, 1998). The reason we refer to a relative partitioning pattern is that it is obtained relative to La. Thus, absolute values for partitioning of scavenging cannot be obtained, but the proportion of REEs scavenged relative to that
13
supplied by the dissolution of surface plankton at depth = d can be expressed by
(𝐿𝑛)𝑑𝑠𝑐𝑎𝑣𝑒𝑛𝑔𝑒𝑑 (NuLn)plankton×([Nu]𝑑−[Nu]𝑑=0)
. (6)
Further proportion of REEs scavenged from a column is obtained by integrating the proportion from 500 m to maximum sampling depth (Fig. 2-4).
We wrote the program to find solutions using Fortran with its determining condition being the minimum RSDscavenging + RSDfitting and referred the calculation using the vertical profiles of Si and P as representative nutrients to “Si-based calculation” and
“P-based calculation”, respectively. If the calculation fails to find a proper solution, it yields infinite or zero values for plankton composition, and the calculation loop was aborted in such cases without a solution output. When calculation of one or more elements were aborted, the calculcation was referred to as “unsuccessful”.
2.2.2. Data set used to the calculations
The datasets used are summarized in Table 1 (Piepgras and Jacobsen, 1988;
Piepgras and Jacobsen, 1992; Bertram and Elderfield, 1993; German et al., 1995; Zhang and Nozaki, 1998; Nozaki et al., 1999; Zheng et al., 2016). Geographical sources of the data are shown in Fig. 2-6. Only the data for the depths deeper than 500 m were used for the calculation in order to ensure the post-mortal nature of biogenic particles and, thereby, the unique scavenging property of particles in assumption 2. This criterion can be important especially for carbonate particles, because biogenic carbonates can be lined with organic molecules (Pokroy et al., 2006) and may behave differently from purely-inorganic particles. According to our survey only 12 vertical distributions of REEs exist with Si and P concentration data with a large enough number (n>5) of sampling depths from water deeper than 500 m. Piepgras and Jacobsen (1992) and
14
Zhang and Nozaki (1998) published unfiltered data, but the contribution of particulate phases should be less than 5% of the dissolved REEs (Alibo and Nozaki, 1999), except for Ce. Therefore, we adopted unfiltered data as dissolved REE data. Some profile data did not report the surface concentration (e.g. Molina-Kescher et al., 2014) and some reported data with an insufficient number of depths (Lacan and Jeandel, 2005b; e.g.
Haley et al., 2014) and were not used in this study. The original REE data were obtained using isotope dilution thermal ionization mass spectrometry (ID-TIMS) (Elderfield and Greaves, 1982; German et al., 1995; Piepgras and Jacobsen, 1992) and inductively-coupled plasma mass spectrometry (ICP-MS) (Nozaki et al., 1999; Zhang and Nozaki, 1998; Zheng et al., 2016). In some literature, data of phosphoric acid were not reported (German et al., 1995; Zheng et al., 2016). If GEOTRACES phosphoric acid data are available, we carried out the calculation using those (Zheng et al., 2016). We did not apply e-WOCE Si and P data to avoid mismatching of water column structures, which may be important when sampling sites are not pelagic.
15 2.3. Results
2.3.1. Self-consistent compositions of surface plankton (SCCPs)
SCCPs were obtained for all of the data set and are summarized in Tables 2 (Si-based calculation) and 3 (P-based calculation). The compositions are shown as concentration of diatom frustules in the case of the Si-based calculation and as that of organic components of photoplankton in the case of the P-based calculation by converting self-consistent Ln/Si ratios assuming SiO2+0.4H2O as diatom frustule matrix and self-consistent Ln/P ratios assuming the Redfield ratio of surface plankton (Redfield, 1963). The justification of this numerical manipulation will be made later (Section 2.4.1). In the Pacific Ocean water columns, the same number of elements were successfully calculated regardless of whether Si or P were adopted as the representative nutrient. In the Indian and Atlantic Oceans the P-based calculation was more successful with outcomes of greater number of elements than the Si-based calculation. The reason for the failure of some elements in the Si-based calculation will be addressed later in detail (see Section 2.4.1 and Section 2.4.3). The standard deviations of the SCCPs were calculated as a range of data to yield the size of the standard deviation of SCRPSs. The standard deviation of both the Si-based and P-based SCCPs in the Pacific Ocean is similar; in other oceans it is generally smaller in the P-based calculation than in the Si-based calculation even when omitting the standard deviation of the calculation-failed elements (Tables 2 and 3).
The general patterns of both the Si- and P-based SCCPs were similar to each other (Fig. 2-8 and Fig. 2-9) for water columns of the Pacific Ocean, but in the Indian and Atlantic Ocean water columns Si-based SCCPs were less consistent with each other
16
than in the Pacific Ocean water columns. Most of the SCCPs showed an HREE enrichment against that of shale (Fig. 2-8 and Fig. 2-9). Their shale-normalized patterns (Fig. 2-8 and Fig. 2-9) showed typically around 1/100-1/30 the concentration of LREEs in shale and around 1/10 for HREEs. In most of the water columns the patterns of both the Si-based and P-based SCCPs showed small humps at Eu, but in the Indian and Atlantic Ocean a depletion was seen around Pr, Nd and Sm. The reason for the variation will be discussed later (Section 2.4.1). The Si-based SCCP at the northeast site TSP-47 39-1 in the North Pacific is almost identical to that of diatom frustules in the Bering Sea with differences being <15% (Table 2 and Fig. 2-8). The latter is estimated from the composition of siliceous matter in settling particles corresponding to infinite diatom productivity, which is based on measurement of natural samples and dissolution kinetics (Akagi, 2013b; Akagi, 2013a). Exact cross-checking between the two compositions at the same location cannot currently be performed, because of the lack of corresponding REE profile data in the Bering Sea.
2.3.2. Self-consistent relative partitioning pattern of scavenging (SCRPS)
Similarly to the calculation results of SCCPs (Section 2.3.1), the Si-based calculation gave less uniform SCRPSs in the Indian and Atlantic Ocean water columns than in the Pacific Ocean water columns; whereas the P-based calculation gave consistent SCRPSs in all oceans (Fig. 2-10 and Fig. 2-11). Regardless of whether Si or P were used as a representative nutrient, the SCRPSs are characterized typically by a convexity around L&MREEs; a slight increase toward Lu can be seen in most of the water columns. In the Indian and Central Atlantic Oceans the convexity around MREEs is generally smaller in both the Si- and P- based SCRPSs, whereas in the Pacific Ocean,
17
the convexity was greater in the Si-based SCRPSs than the P-based ones. The position of the L+MREE maximum in the SCRPSs seems also to vary geographically: It occurs at Sm in most profiles from the North Pacific Ocean and occurs at La, Pr or Nd in profiles from the Indian and Atlantic Oceans in both the Si- and P- based SCRPSs.
In almost all cases the relative standard deviations (RSDs) of SCRPSs are greater for HREEs than those for LREEs. Similar RSDs occur throughout L and MREEs but RSDs increase for HREEs (Tables 2 and 3). In the North Pacific Ocean the RSDs are typically smaller than 10 % in the Si-based SCRPSs; for the other oceans, they became greater (greater than 10%) and the calculation failed to give some HREE data in the Si-based SCRPSs; but in the P-based SCRPSs, the RSDs are typically smaller than 10% except for the Indian ocean (Tables 2 and 3).
The results obtained by the Si-based calculation of the Pacific Ocean water columns and P-based calculation of all three ocean water columns are used in the following discussion.
2.3.3. Proportion of scavenged REEs to those supplied by remineralization of plankton
The proportion of REEs scavenged appears to vary substantially across geographical location and across the REE family. It also depends on depth. The choice of a representative nutrient used in the calculation was not critical in the scavenged proportion. Generally, in both the Si-based and P-based calculations the scavenged proportion is smallest in the North Pacific Ocean, and greater in the Indian and Atlantic Oceans. It is typically highest at MREEs and smallest at HREEs (Fig. 2-12a, b).
Regardless of elements chosen as a representative element, the scavenged proportion decreases with an increase in depth (Fig. 2-12a, b). This decrease is generally
18
monotonous down to 5000 m depth in the Atlantic, but in the Indian Ocean the decrease is conspicuously seen above 3000 m. In the North Pacific Ocean the decrease is seen in shallower depths above 2000 m.
19 2.4. Discussion
2.4.1. Validity of the self-consistent calculation
The overall validity should be examined by the extent to which the reported vertical profiles can be reproduced by the model. In Fig. 2-2 and Fig. 2-3 the examples are shown. Fittings to the Pacific Ocean by Si-based calculation and those to any ocean by P-based calculation are fairly good with RSD of residues of the profile fitting being as small as 10% (Fig. 2-7). From the fittings, however, it is not certain which of Si or P better represent the primary carriers. Scrutiny of the calculations, however, indicates limitation of interpretation and oversimplified logic in some cases.
(Sensitivity to discern primary scavengers and oversimplified assumption of single primary scavengers) Sensitivity on the nutrient used in calculation depends on the difference in the vertical profiles between Si and P. The variation of Si/P in the Atlantic and Indian Oceans is greater by a factor of two than that in the Pacific Ocean.
In addition, each REE concentration data should carry analytical uncertainty perhaps around several %. We performed the calculation using a set of artificial REE profile data for the observed Si or P profiles in the three oceans in order to understand the sensitivity of the calculation to the choice of nutrient and its limitation. The artificial REE profile data are generated on the assumption that one of the Si- or P-representing carriers exclusively released REEs during its remineralization. Some sets of the artificial data were deliberately loaded with random errors to see the effect of analytical uncertainty.
Results of the runs with artificial profiles are summarized in Table 4. The results of calculation (RSDscavenging and RSDfitting) depend greatly on ocean. The results of the experiments are: for the Pacific Ocean water columns, even if the primary
20
carriers are set to be exclusively Si-related plankton, the load of random errors to the REE data makes the difference between the Si- and P-based calculations unclear (e.g., Run Nos. 3-6; Run Nos. 15-18); when the primary carriers are set to P-related plankton, with load of random errors only slightly smaller RSDscavenging are obtained in P-based calculation than in Si-based calculation (e.g. Run Nos. 9-12; Run Nos. 21-24). For the Atlantic water columns, the difference of carriers appears as the number of failed elements: When the primary carriers are set to P-related plankton, the P-based calculation gave better results with greater number of element outcomes (e.g. Run Nos.
43-48; Run Nos. 55-60). It is shown that the calculation for the Pacific Ocean water columns may not be sensitive enough to discern the type of the primary scavenger, as long as the carrier is made of nutrient-type elements. This limits interpretation on primary carriers based only on the comparison of sizes of RSDscavenging in the Pacific Ocean water columns. Mismatching between the element that the calculation is based on versus the element representating primary carriers can be judged from the failure of calculation in the Atlantic Ocean water columns.
The greater Si/P variation in profiles or greater dissimilarity between Si and P profiles may be the principal reasons for the higher sensitivity to the choice of nutrient in the calculation for the Atlantic and Indian Oceans (Fig. 2-6 - Fig. 2-10). This may explain the reason why the outcomes of the calculation for the Pacific Ocean were generally similar, whichever Si or P is employed as representing nutrient of the primary carriers (Fig. 2-6 - Fig. 2-10).
The self-consistent calculation does not allow the presence of more than one surface scavenger. This assumption may not be valid in some oceans. In the North Pacific Ocean, although the calculation has limited sensitivity to the choice of
21
representative nutrient, it is likely that both carriers representated by Si and P are likely to play a role for the two reasons. 1) The carrier representated by P is likely to be organic matter of general phytoplankton (Section 2.4.1). The calculation for the Atlantic Ocean water column favours the carriers represented by P and rather ubiquitous presence of phytoplankton in oceans makes the omission of the carriers rather unrealistic. 2) As stated in Section 2.4.1, Si-representing diatom frustules also comprise significant carriers in the North Pacific Ocean.
Strong lateral flow of different water masses or intense dissolutive supply from the seafloor with distinct REE concentrations may also breach Assumption 1 of a unique composition of plankton in a water column, and this may result in more uncertain calculations of SCCP. Perhaps this may be the case with some of the data from the Indian Ocean and near the Mid-Atlantic Ridges in the South Atlantic Ocean (Stns. 7). The SCCPs and SCRPSs tend to be irregular, abnormal or to give greater RSDscavenging in such cases.
(Oversimplified assumption of unique secondary scavenger) Because the RSDscavenging is calculated based on the vertical profile of La, it is considered that Assumption 2 of a unique partitioning pattern for scavenging is only valid for elements that are scavenged by the same substance as La. This may account for the failure of a self-consistent calculation of some HREEs in data from certain areas, although, as discussed earlier, mismatching between the element calculation is based on and the element representating primary carriers may likely be a more important cause of failure of the calculation. As mentioned in Section 2.3.2, RSDscavengings are almost the same from Pr to Dy then increase towards heaviest Lu, at least for certain samples (Fig. 2-11;
Tables 2 and 3). It is thought that assumption 2 of the unique partitioning pattern of
22
scavenging becomes less applicable for HREEs, as discussed in Section 2.4.3.
We therefore conclude that the Si-based calculations of the Indian and Atlantic Ocean water columns are unsuccessful due mainly to mismatching between the element that the calculation is based on and the element representing primary carriers.
2.4.2. Possible carriers (primary scavengers) of REEs from surface to deep water The calculation of REE composition of surface plankton is predicated on the presence of a REE carrier, which can release Si or P and REEs at the same time through remineralization. The presence of unique solutions to the calculation algorithm based on nutrient should imply that primary carriers of REEs in the oceans are surface plankton.
It is shown by the sensitivity tests (Section 2.4.1) that the calculation for the Pacific Ocean water columns may not be sensitive enough to discern the type of the primary scavenger using REE data with a few percent errors, as long as the carrier is made of nutrient-type elements. Good agreement obtained between the estimated values of diatom frusules in the Bering Sea based on the chemical analysis (Akagi, 2013a) and the SCCP of the nearest site of TPS47 39-1 (Fig. 2-8a, Table 2) indicates that the diatom frustules are likely to be one of the most influential carriers (primary scavenger) of REEs from the surface to the deep water in the North Pacific Ocean. The North Pacific Ocean is well known as a “silica ocean” with a Si concentration as high as 200 mol /kg.
Opal has long been invalidated as a possible carrier of REEs given the negative correlation between REE concentration and opal content (Murray and Leinen, 1993).
Our study showed that opal is geochemically simply a diluter of the REEs in diatom frustules (Akagi et al., 2011), concluding that diatom frustules themselves, not opal, can be important carriers of REEs. The presence of Al in opal is known to decrease the
23
dissolution rate of opal (Dixit et al., 2001) and we consider that an inclusion of REEs in opal makes neighboring opal less-opaline.
Soft tissues of marine organisms may be important carriers. A significant correlation between particulate organic carbon (POC) and particulate HREEs (not LREEs) was reported in the North Atlantic surface water (Kuss et al., 2001). Some marine algae may contain relatively high concentrations of REEs (Fu et al., 2000). Our recent study of bivalve soft tissues shows that organic components can contain REEs at concentrations as high as 1/100 to 1/10 of shale values (Akagi and Edanami, 2017).
Hara et al. (2009) reported the assimilation of dissolved REEs by phytoplankton during a Fe-induced plankton bloom, where LREEs were preferentially absorbed. The direct measurement of REE composition in plankton was carried out by Strady et al. (2015), but unfortunately it is suspected that REEs in carbonate particles are also measured by their method. Sorption onto organic matter may be feasible to explain the REE/P ratio of organic matter, in which HREE are reported to be preferentially absorbed onto organic matter or cell surfaces (Takahashi et al., n.d.; Schijf et al., 2015). As discussed later in this section, there might be another mechanism to explain presence of REEs in diatom frustules and organic components at the same time. The remineralization of planktonic organic components has been well-established as the cause of the nutrient-type profile for P (Broecker and Peng, 1982). We conclude that a P-related REE carrier is organic components of plankton. The smaller errors in the P-based self-consistent calculations in the Indian and Atlantic Oceans (Table 3) and the results of sensitivity tests (see Section 2.4.1) indicate that organic components comprise more important primary scavengers especially in these oceans. As discussed earlier, it is likely that organic components of surface plankton should also comprise a possible carrier of REEs besides
24
diatom frustules in the Pacific Ocean. In the present calculation, one cannot separately determine the REE compositions of two different carriers (see Section 2.4.1), but organic components may not be very different from diatom frustules with respect to REE compositions considering the similarity between the Si- and P-based self-consistent compositions among the oceans (Fig. 2-8 and Fig. 2-9). This is supported by the analysis of the H2O2 leaching experiment of settling particles (Emoto, 2016), which discovered that the REE compositions of diatom frustules are greater by a factor of three than those of organic matter, but that the REE patterns are roughly similar between each other.
The main question is what mechanisms exist for phytoplankton to incorporate REEs in silica frustules or organic components. It is natural to consider that the incorporation mechanisms are very different between into silica frustules and into organic components. Recently, transparent exopolymeric particles (TEPs) secreted by diatoms have found to facilitate the selective dissolution of altered Al-enriched diatom frustules (Toullec and Moriceau, 2018). Complex formations of metals in the altered frustules with organic functional groups in TEP are likely to be a mechanism of breakdown and lead eventually to dissolution the metals in seawater. It is more reasonable if TEPs dissolve silicates supplied via the atmosphere to facilitate photic zone diatoms to absorb elements in the silicates, although this should be tested experimentally. A greater amount of TEPs is secreted by diatoms when silicic acid is deficient. This TEP-mediated dissolution of silicate minerals is likely the gateway of terrigenous REEs into the oceanic cycling: diatoms may take in dissolved REEs probably with silicic acid from silicate minerals in the TEP pools; elements in organic components of phytoplankton could also eventually come from this TEP or even TEPs
25
themselves could be organic matter whose REE composition are calculated as P-based SCCPs. This explains very well the similarity of REE compositions between the P-based SCCPs and Si-based SCCPs. As organic ligands show higher complex formation constants with heavier REEs (Byrne and Kim, 1990), this also explain the enrichment of HREEs in the SCCPs.
Other phases so far suggested as REE carriers, which includes oxide (Sholkovitz et al., 1994), phosphates (Byrne and Kim, 1990) and carbonates (Takebe, 2005) should not be important as primary scavengers, since they do not produce nutrient-like dissolution profiles. Both calcium phosphate and carbonate in live tests are considered not to accumulate significant levels of REEs (Sholkovitz and Shen, 1995;
Akagi et al., 2004; Trueman et al., 2006; Tütken et al., 2008; Bau et al., 2010;
Ponnurangam et al., 2016; Akagi and Edanami, 2017), although they may accumulate REEs at much higher concentration during diagenesis (Scherer and Seitz, 1980; Tütken et al., 2008).
The SCCPs in the Pacific Ocean display a characteristic hump around MREEs or an Eu anomaly; whereas those in the other oceans a depletion in L-MREEs (Fig. 2-8 and Fig. 2-9). The difference can be explained by differences in the types of surface plankton and/or that in provenance of continental margin. In the Bering Sea the diatoms are considered to incorporate island-arc matter to their frustules, based on the budget calculation of REEs and Nd isotope ratios (Akagi et al., 2014). It is likely that the composition of surface plankton calculated for the North Pacific Ocean represents that of diatom frustules, in which island arc matter with characteristic humps around MREEs or Eu anomalies (Kelemen et al., 2003) is incorporated. In contrast in the other oceans, with less extra inputs by diatoms and short of island arc matter, the REEs
26
dissolved in the deeper layer of water columns, which has been already depleted with L+MREEs (see Fig. 2-1), may be the primary source of REEs for the surface plankton.
2.4.3. Two possible scavenging phases (secondary scavengers) for REEs in the deep water
Irrespective of the elements used as representative nutrient, the SCRPSs (Fig.
2-10 and Fig. 2-11) typically show a broad maximum in the L+MREE region: around Nd or Sm in the Pacific and La or Nd in the Indian and Atlantic Oceans. They are similar to the distribution pattern between the acetic acid soluble fraction of particles and seawater: that in the Pacific Ocean shows maximum around Sm, whereas that in Atlantic Ocean shows maximum around La (Sholkovitz et al., 1994; Lerche and Nozaki, 1998; Akagi, 2013a) (Fig. 2-13a). The acetic acid soluble phase normally contains a greater amount of Mn than the other oxide and siliceous phases (Akagi et al., 2011;
Sholkovitz et al., 1994). This basically supports our early conclusion that carbonate/oxide phases of settling particles are responsible for the scavenging in deep water (Akagi, 2013b). In Fig. 2-13a, partitioning of REEs between acetic acid soluble fraction of particles and seawater are compared with our SCRPSs. Both the patterns resemble each other very well in L+MREE region. The difference in the positions of the L+M REE maximum are reproduced by the partitioning patterns between the acetic acid soluble fractions and seawater. However, the discrepancies become greater toward Lu.
The discrepancies are explained by the operation of other scavenging phases as discussed later.
A crucial question is what in the acetic acid soluble fractions represents REE carriers? Carbonate has been identified as a carrier of REEs in sediments (Takebe, 2005).
It is known from field observation (Scherer and Seitz, 1980) as well as laboratory
27
experiments (Zhong and Mucci, 1995) that carbonate particles accumulate MREEs, especially around Sm, which has the closest ionic radius to that of Ca. The partitioning coefficient (D) of MREEs is as high as 103 against calcium in seawater (Zhong and Mucci, 1995; Lakshtanov and Stipp, 2004; Tanaka and Kawabe, 2006). The typical carbonate in settling particles is considered to be calcite, and Ca in the calcite lattice is considered to be replaced by REEs. The high D of inorganic calcite is in a good contrast with that of live carbonate (D ≈ 1) for calcite + aragonite (Akagi and Edanami, 2017;
Bau et al., 2010; Ponnurangam et al., 2016) and aragonite (Akagi et al., 2004;
Sholkovitz et al., 1994). It is concluded that carbonate (not live carbonate) is one of the most important carriers of REEs, which represent REEs in the acetic-acid soluble fraction.
A part of oxides can be dissolved by the treatment of acetic acid. Oxide has been also known to accumulate REEs from seawater based on both experiment and observation of oxide phases in the ocean sediment (Koeppenkastrop and De Carlo, 1992; Bayon et al., 2004; Johannesson et al., 2011). The adsorption coefficients obtained in experiments with seawater and -MnO2 (Koeppenkastrop and DeCarlo, 1992) seem to explain selective removal of L+MREEs in seawater. Other experiments with Fe oxide suggest that REE removal is rather unselective (Ohta and Kawabe, 2000;
Ohta and Kawabe, 2001). Fe-Mn leachate from sediment exhibits an L+MREE enrichment (Bayon et al., 2004). L+MREE enriched composition of pore water has often been observed together with a high Mn concentration (Johannesson et al., 2011). A Mn-rich layer on sedimentary foraminifera was observed to accumulate Nd (Tachikawa et al., 2013). Further significant correlation of Mn and Nd was reported in carbonate tests in trapped particles (Pomiès et al., 2002). The SCRPSs may be the results of
28 scavenging by Mn oxide as well as carbonate.
The scavenged proportion tends to decrease with increasing depth (Fig. 2-12).
The difference in carbonate saturation depth (CSD) among the oceans seems to be reflected in the vertical profiles of scavenged proportion (Fig. 2-12). CSD is in the order of the North Pacific Ocean > Indian Ocean > Atlantic Ocean (Broecker and Peng, 1982).
This order is in a good accord with the depth where the decrease in the scavenged proportion is seen (<2000 m in the Pacific, <3000 m in the Indian and <5000 m in the Atlantic Oceans). The profiles of the scavenged proportion is more easily explained by scavenging by carbonate particles. It is our opinion that carbonate and Mn play synergetic roles, where carbonate may provide efficient surface to actively concentrate REEs and Mn oxide may act as a fixer of REEs. Carbonate and oxide remain as the candidates of the second scavengers and will hereby be referred to as “carbonate/oxide”.
Regardless of whether of carbonate or Mn oxide predominates in terms of scavenging, the difference in elements for the maximum positions of the SCRPS between the Pacific and Atlantic Oceans (Fig. 2-10 and Fig. 2-11) can be explained by the difference in proportions of free REE ions between the two oceans (Fig. 2-13b). The proportion of free REE ions of total dissolved REEs was calculated by the thermodynamic calculation using the same equation applied to coral (Akagi et al., 2004).
Another feature seen in the SCRPSs is an increase toward Lu with varying extents (Fig. 2-10 and Fig. 2-11). The sizes of maxima around MREEs and the increase toward Lu appear to be independent of each other, and it is considered that chemically-different phases from carbonate/oxide may be responsible for the increase toward Lu. The candidates of REE carriers other than carbonate/oxide are phosphate
29
(Byrne and Kim, 1993) and organic matter (Kuss et al., 2001; Sholkovitz et al., 1994).
Most fixed carbon in phytoplankton decays rapidly in water columns (Yasuda et al., 2016) and particulate organic carbon in the deep water therefore consists mostly of older carbon (Druffel et al., 1992). It is known that complex formation constants of organic ligands with REEs unanimously increase almost linearly with increasing atomic number (Byrne and Kim, 1990). A correlation between particulate organic matter and HREEs was reported in suspended particles (Kuss et al., 2001). Phosphate is known as absorbers of REEs, but they preferentially absorb MREEs (Byrne et al., 1996;
Koeppenkastrop and DeCarlo, 1992). It is likely that organic matter in the particles, which differ from fresh organic components in surface plankton, is largely responsible for the scavenging HREEs. This should explain the greater difference with increasing atomic number at the HREE region between the observed acetic acid leachate/seawater partitionings (Lerche and Nozaki, 1998; Sholkovitz et al., 1994) and our greater SCRPSs (Fig. 2-13a).
The two chemically different phases for secondary scavenging should explain the increasing RSDs for heavier REEs in the calculation (Tables 2 and 3). It is likely that the amounts of the two phases vary independently at different water depths. The present self-consistent calculation assumes a unique particulate phase of secondary scavenging (Assumption 2). By selecting La as a standard element (see Section 2.2.1), the calculation would capture the partitioning pattern of the phase to scavenge La. The greater RSDs of the calculated partitioning pattern of scavenging for HREEs should degrade the quality of the estimation of self-consistent HREE composition of surface plankton to some extent.
The success of the self-consistent calculation in the Pacific and Atlantic