The development of highly sensitive
carnitine biosensor based on cathodic
stripping voltammetry
丹羽研究室
Zixin Zhang
(Doctoral Program in Life Science and Green Chemistry)
Dissertation submitted to the Graduate School of
Engineering in partial fulfillment of the requirements for the
degree of Doctor of Philosophy in Engineering at Saitama
Institute of Technology
Table of Contents
CHAPTER 1. GENERAL INTRODUCTION 1
1.1 Introduction 1
1.2 Current study of carnitine 5
1.2.1 The function of carnitine in human body 5
1.2.2 Determination methods of carnitine 7
1.3 Self-assembled monolayers 15
1.4 Cathodic stripping voltammetry detection method- A electrochemistry technology 16
1.5 Purpose of this work 18
REFERENCES 20
CHAPTER 2. AU BULK ELECTRODE-BASED CARNITINE BIOSENSOR
2.1 Introduction 27
2.2 Experimental section 30
2.2.1 Diagram of device 30
2.2.2 Reagents and materials 31
2.2.3 Apparatus 32
2.2.4 Enzyme immobilization 33
2.2.5 Linear-sweep cathodic stripping voltammetry analysis 34
2.3 Results and Discussion 35
2.3.1 Electrochemical behavior of CoA and acetyl-CoA on a bulk gold
electrode 35
2.3.2 Optimization of enzyme membrane compositions of modified-gold bulk
electrode 37
2.3.3 Optimization of enzyme membrane position on a gold bulk electrode 40
2.3.4 Carnitine calibration curves 42
2.3.5 Selectivity of carnitine biosensor 45
2.4 Conclusion 47
2.5 References 48
CHAPTER 3. THE STUDY OF SPUTTERED CARBON FILM FOR GOLD NANOPARTICLE-BASED BIOSENSOR
3.1 Introduction 54
3.1.1 Carbon film 54
3.1.2 Metal nanoparticle modified carbon film electrode 56
3.2 Experimental section 59
3.2.1 Reagents and materials 59
3.2.2 Carbon film preparation 61
3.2.3 Gold nanoparticles electrodeposition 62
3.2.4 Carbon film characterization 63
3.2.5 Electrochemical measurements of pure carbon films 64 3.2.6 Cathodic stripping voltammetry analysis 65
3.3 Results and Discussion 66
3.3.1 Surface characterizations of DC sputter deposited carbon films 66 3.3.2 Potential windows of DC-sputtered carbon films 71 3.3.3 Basic electrochemical properties of DC carbon films 73 3.3.4 Optimization of AuNPs deposition parameters 79 3.3.5 Electrochemical behavior of CoA and acetyl-CoA on a AuNPs modified
carbon film electrodes 83
3.3.6 Electrochemical behavior of carnitine biosensor 84 3.3.7 Carnitine calibration curves of AuNPs-based biosensor 86 3.3.8 Selectivity study of carnitine biosensor 88 3.3.9 Recovery in artificial saliva with carnitine biosensor based on AuNPs
modified carbon film 89
3.4 Conclusion 90
3.5 References 92
CHAPTER 4. CONCLUSIONS 98
Chapter 1. General Introduction
1.1 Introduction
Cancer has become one of the common diseases in daily life.
According to the data of W.H.O (world health organization), it has become
the second leading cause of death in human beings. In recent years,
research data shows that cancer has a young trending with the rapid
development of social economy and the accelerated pace of life.[1] Also, population aging has become a global trend. This information indicates that
if we cannot pay attention to cancer in time, cancer will become a global
catastrophe. Therefore, how to cure and prevent cancer is extremely
important for future human life. Fig.1.1 shows the top 10 cancer death by
type in Japan. It shows the fatality of lung cancer is much higher than other cancers. However, the sum of fatality number from the digestive system
cancers (colon cancer, stomach cancer, pancreatic cancer, liver cancer, and
gallbladder cancer) far exceeds lung cancer, suggesting that the digestive
cancers are the most severe cancer in Japan.
In recent years, various cancer treatments have been developing based on improvement of the medical and biological technologies. The treatment
given for cancer is variable and dependent on several factors, including the
health status of the patient. There are three general types of cancer
treatments: radiation therapy, surgery, and systemic therapy. However,
those treatments are only effective for early and mid-stage cancer patients.
Hence, early detection of cancer becomes the key for treating and even preventing cancer.
The biomarkers in the human body can effectively and accurately
reflect the health status of the human body. Therefore, invasion detection
technology has been rapidly developed and applied to the early detection
of cancer. However, the process of invasion detection often brings pain to the patient, which will cause many people to give up precious curable
opportunities because of the pain during the detection process. In order to
solve this problem, non-invasive detection methods came into being under
the efforts of many researchers. Although the non-invasive detection
method is not well-developed, some remarkable works have reported. For example, the biomarkers have been found in urine,[2] sweat[3-5] and saliva
[6-8] samples.
Electrochemical methods were widely employed in biosensing
applications and were usually combined with enzymatic or immunoassay
to determine the biomolecules in the human body such as glucose,
cholesterol, DNA, uric acid, lactate, hemoglobin, and others.[9-11] This is because the electrochemical measurements are highly sensitive,
quantitatively determined by electrochemical measurements despite of
their inexpensive equipment. With the development of biosensing
technology in recent years, biosensors have been successfully
commercialized. And products have a trend of small size and simple operations, such as the smart-biochips shown in figure 1.2. Particularly the
disposable sensor is essential for real clinical trials. Therefore, a suitable
material is crucial for the development and fabrication of an ideal biosensor.
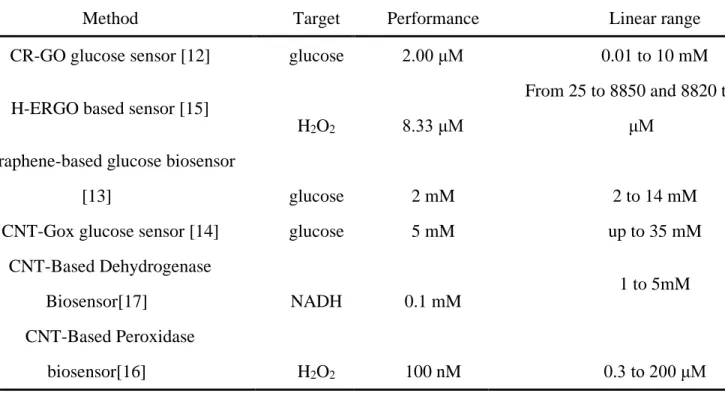
Carbon-based materials are widely used in electrochemical analysis
due to their excellent electrochemical properties, such as low noise and good electrochemical stability. Many carbon electrode based biosensors
have been developed by utilizing electrochemical technology, such as,
glucose,[12-14] H2O2 [15, 16] and alcohol biosensors [17], as listed in
Table 1.1. For realizing chip-shaped with carbon-based electrodes for the
manufacture of biosensors, carbon films are mass-producible and can be fabricated with any shape and size. Therefore, we can achieve a promising
disposable and non-invasive biosensors with small-size, accurate, and
Table. 1.1 The performance summary of the carbon-based biosensors
Method Target Performance Linear range
CR-GO glucose sensor [12] glucose 2.00 μM 0.01 to 10 mM
H-ERGO based sensor [15]
H2O2 8.33 μM
From 25 to 8850 and 8820 to 28850 μM
Graphene-based glucose biosensor
[13] glucose 2 mM 2 to 14 mM
CNT-Gox glucose sensor [14] glucose 5 mM up to 35 mM
CNT-Based Dehydrogenase
Biosensor[17] NADH 0.1 mM
1 to 5mM CNT-Based Peroxidase
biosensor[16] H2O2 100 nM 0.3 to 200 μM
Figure 1.1 The top 10 cancer death by type in Japan, (2017).
1.2 Current study of carnitine
1.2.1 The function of carnitine in human body
Carnitine is a quaternary ammonium compound derived from an
amino acid as shown in figure 1.3. It is mainly distributed in the digestive system and the liver, and is involved in the metabolism of fatty acids (Fig.
1.4). Carnitine also provides antioxidant and anti-inflammatory effects.
Carnitine is commonly present in the mitochondria in a cell, where it helps
to convert long-chain fatty acids to energy (e.g., ATP)[20], and
approximately 75 % of carnitine found in the human body derives from our diet, and the remainder is synthesized from lysine and methionine in the
liver and kidneys [21]. Carnitine can also transport any toxins that are
produced to the mitochondria to prevent toxin accumulation [22]. In view
of these key functions, carnitine will be concentrated in tissues such as
bones and heart muscle, which use fatty acids as dietary fuel.
Also, L-carnitine deficiency is usually observed in chronic
hemodialysis patients,[23] and researchers reported that the chronic fatigue
syndrome,[24] methylmalonic acidemia,[25] and even heart failure and
Alzheimer disease[26] might associate with the carnitine amount in the
human body. Therefore, the carnitine was also considered as a confident
found in cancer patients and healthy subjects were about 20 and 10 μM,
respectively.[7]
Figure 1.3 The chemical structure of carnitine.
1.2.2 Determination methods of carnitine
1.2.2.1 Traditional carnitine detection methods
High-performance liquid chromatography detection method
High-Performance Liquid Chromatography (HPLC) is an analytical
chemistry technique used to separate and quantify each component in a
mixture sample.
Minkler et al. utilized the HPLC method to detect the content of total
carnitine and acetyl-carnitine in human urine and plasma. They
successfully determined the relationship between the content of total carnitine and acetyl-carnitine in urine and methylmalonic aciduria,
isovaleric acidemia, and medium chain acyl-CoA dehydrogenase
deficiency. The carnitine and acetyl-carnitine were separated from urine
using 0.5-ml columns of silica gel, and obtained a linear range of 10-300
nmol/mL. [27, 28] However, HPLC method is time-consuming and high-cost of equipment.
Figure 1.6 the schematic diagram of HPLC.[29]
Capillary electrophoresis mass spectrometry (CE-MS)
CE-MS is a technology which combined the capillary electrophoresis
and mass spectrometry.
Heinig et al. reported the determination of carnitine and acylcarnitines in human urine and plasma samples by CE-MS. The separation of carnitine
and acylcarnitines were performed in aqueous, mixed organic–aqueous and
non-aqueous media by CE. To improve the separation efficiency, the
electrolyte compositions were optimized. Then the separated carnitine and
acylcarnitines were determined by MS. An acceptable performance with a
linear range of 2.7 to 108 nmol/mL and a LOD of 12 nmol/mL was achieved.[30] Sánchez-Hernández et al. determine D-carnitine of the
D-carnitine were separated by CE, and determined by an improved MS/MS
method. As a result, an LOD of 10 ng/ml and detection ranged from 0.4 %
and 5.9 % were obtained.[31]
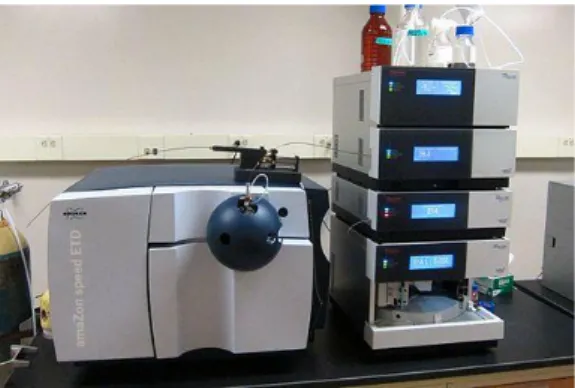
Figure 1.7 CE/MS system
Figure 1.8 Schematic diagram of CE method.
Liquid chromatography mass spectrometry
chromatography (or HPLC) with the mass spectrometry (MS). Due to the
synergistic enhancement of the respective functions of each technology, the
combined chromatography-MS system is very popular in chemical analysis.
The free carnitine in milk-based infant formula and health-care products was determined by Andrieux et al. The free carnitine was
separated by liquid chromatography and quantified by ion-pair
chromatography with single-quadrupole MS detection. As a result, the
intermediate reproducibility relative standard deviation and the average
product-specific recoveries range were less than 4.7 and 92–98%, respectively. [32]
Figure 1.10 Schematic diagram of LC-MS.[33]
Radio-assay
The radioisotopic assay usually combines with the enzymatic assay by pre-labeling the 14C isotope on the acetyl functional group. Carnitine
concentration was quantified by determining the content of the isotopic.
The enzymatic reaction was shown in figure 1.11.
Figure 1.11 The enzymatic reaction of carnitine.
McGarry et al. reported an improved and simplified radioisotopic assay to determine free and total carnitine in human plasma samples. The
acetyl-CoA. After the enzymatic reaction, the labeled acetyl-carnitine was
separated by passing the mixture through a column of anion exchange resin.
And the isotope content determined from the effluent fluid. As a result,
55.7 ± 1.99 and 65.7 ± 2.55 μM/L of free carnitine and total carnitine were detected from human plasma samples, results which are in close agreement
with those reported by others at that time. [34]
To sum it up, although the traditional carnitine detection methods have
a good performance as shown in Table 1.2, the time-consuming and
high-cost of equipment slow down the promotion of commercialization.
1.2.2.2 Enzyme-based carnitine biosensor
Recently, an Ion-sensitive field-effect transistor (ISFET) based
carnitine biosensor was reported by Andianova et al. [35] A new sensor based on specially optimized for biosensing (complementary
metal-oxide-semiconductor) CMOS-compatible ISFET structures. The CMOS
membrane (Ta2O5) was modified with an enzymatic membrane containing
carnitine acetyltransferase for the direct determination of L-carnitine. The
schematic diagram of this ISFET carnitine biosensor was shown in Fig. 1.12.
The CMOS structure was optimized for achieving high sensitivity
using a subthreshold operation mode and by reducing the influence of the
capacitances on the value of subthreshold swing. The developed ISFET
was used as a basis for a biosensor for L-carnitine detection. The carnitine
enzymatic products can change the pH values of solution, and the Ta2O5
film is very sensitive to the ionic charge. Therefore, the amount carnitine
can be detected by the ISFET sensor. The detected L-carnitine at a range
of 0.2–100 μM with a LOD of 0.2 μM. The biosensor response was linear
1.3 Self-assembled monolayers
SAM is an ordered molecular assembly formed by adsorbing active
surfactants on a solid surface. This simple process makes SAM inherently
manufacturable, and therefore technically attractive for superlattice
construction and surface engineering. In these two-dimensional systems, when the system is in equilibrium, the spontaneous chemical synthesis at
the interface produces a sequence.[36]
The CoA-SH, the carnitine enzymatic product, has a thiol-terminated
functional group, which allows CoA-SH can easily adsorb on the surface
of noble metals (e.g., gold, silver, platinum) to form SAMs as shown in Fig. 1.13.
1.4 Cathodic stripping voltammetry detection method- A
electrochemistry technology
Cathodic stripping voltammetry (CSV) has been used to identify
metal types and quantify them based on their reduction current. CSV has a
pre-concentration step, which usually involves adsorption of complexes
with selective ligands (usually organic ligands) on the electrode. For SAMs,
it is the formation of Au-S-R (Fig. 1.14). There is no diffusion during
scanning, so a high scanning rate can be used to obtain high sensitivity. The sensitivity of CSV is sufficient to detect about 20 elements in seawater.[37]
Figure 1.14 The assumed formation of a gold–thiolate ligands.
By using this property, CSV could be utilized for thiol group
determination. CSV has many advantages, such as high sensitivity,
accuracy, and applicability to small volume samples. Moreover, in recent
years, many researchers have used the CSV method to detect biomarkers,
Table. 3 The application of CSV for determination.
Target Technology Performance Linear range
Cardiac biomarker[38] Enzyme-free electrochemical
immunoassay 3.8 pg mL
−1 0.01 to 500 ng mL−1
Metallothionein for evaluating
environmental contamination[39] Modified square wave CSV 5 × 10⁻⁸ g L
−1 up to 100 ug*g−1
Cancer biomarker[40] Stripping voltammetric
immunoassay (SVI) pg mL
−1 level 1 to 50 ng*ml−1
Cardiac marker[41] CSV-based electrochemical
enzyme immunoassay system 20 ng L
−1
1.5 Purpose of this work
In this study, we developed a highly sensitive carnitine biosensor by the CSV method using a gold electrode modified with an enzyme (carnitine
acetyltransferase). The biosensor concentrates CoA produced by the
enzymatic reaction of carnitine, acetyl coenzyme A (acetyl-CoA) and
carnitine acetyltransferase on a gold electrode by a self-assembling
reaction, and electrochemically reduces it all at once, resulting in a large
current. A signal can be obtained and a low detection limit can be achieved. Both acetyl-CoA and CoA are adsorbed on the gold electrode, but CoA is
selectively detected by the potential difference of reduction elimination.
We first constructed a biosensor based on a commercially available
gold electrode and achieved a detection limit of 0.025 μM (Chapter. 2). In
order to further improve the performance, AuNPs deposited sputtered carbon film electrode was employed in further biosensor development
study. Because the substrate of AuNPs could extremely affect the
electrochemical properties of biosensor. Therefore, we studied the DC
magnetron sputtered carbon film first, the electrochemical properties and
the structures were characterized by cyclic voltammetry (CV), XPS, and TEM. Then, we developed a new electrode modified with gold
nanoparticles, the AuNPs deposition conditions were evaluated by the
performances of biosensor were evaluated by the reduction peak obtained
References
[1] K.D. Miller, M. Fidler-Benaoudia, T.H. Keegan, H.S. Hipp,
A. Jemal, R.L. Siegel, Cancer statistics for adolescents and
young adults, 2020, CA: A Cancer Journal for Clinicians,
70(2020) 443-59.
[2] B.W. van Rhijn, H.G. van der Poel, T.H. van der Kwast,
Urine markers for bladder cancer surveillance: a systematic
review, European urology, 47(2005) 736-48.
[3] V. Oncescu, D. O'Dell, D. Erickson, Smartphone based
health accessory for colorimetric detection of biomarkers in
sweat and saliva, Lab on a Chip, 13(2013) 3232-8.
[4] S. Jadoon, S. Karim, M.R. Akram, A. Kalsoom Khan, M.A.
Zia, A.R. Siddiqi, et al., Recent Developments in Sweat Analysis
and Its Applications, International Journal of Analytical
Chemistry, 2015(2015) 164974.
[5] J. Choi, A.J. Bandodkar, J.T. Reeder, T.R. Ray, A.
Turnquist, S.B. Kim, et al., Soft, Skin-Integrated Multifunctional
Microfluidic Systems for Accurate Colorimetric Analysis of
Sweat Biomarkers and Temperature, ACS Sensors, 4(2019)
379-88.
diagnosis – a review [In Process Citation], Journal of clinical
periodontology, 27(2000) 453-65.
[7] M. Sugimoto, D.T. Wong, A. Hirayama, T. Soga, M.
Tomita, Capillary electrophoresis mass spectrometry-based
saliva metabolomics identified oral, breast and pancreatic
cancer-specific profiles, Metabolomics, 6(2010) 78-95.
[8] A.E. Herr, A.V. Hatch, D.J. Throckmorton, H.M. Tran, J.S.
Brennan, W.V. Giannobile, et al., Microfluidic immunoassays as
rapid saliva-based clinical diagnostics, Proceedings of the
National Academy of Sciences of the United States of America,
104(2007) 5268-73.
[9] Z. Guler, P. Erkoc, A.S. Sarac, Electrochemical
impedance spectroscopic study of single-stranded
DNA-immobilized electroactive polypyrrole-coated electrospun
poly(ε-caprolactone) nanofibers, Materials Express,
5(2015) 269-79.
[10] Y. Wang, H. Xu, J. Zhang, G. Li, Electrochemical
Sensors for Clinic Analysis, Sensors, 8(2008) 2043-81.
Elsevier2019, pp. 249-62.
[12] M. Zhou, Y. Zhai, S. Dong, Electrochemical Sensing
and Biosensing Platform Based on Chemically Reduced
Graphene Oxide, Anal Chem, 81(2009) 5603-13.
[13] C. Shan, H. Yang, J. Song, D. Han, A. Ivaska, L. Niu,
Direct Electrochemistry of Glucose Oxidase and Biosensing for
Glucose Based on Graphene, Anal Chem, 81(2009) 2378-82.
[14] J. Wang, M. Musameh, Enzyme-dispersed
carbon-nanotube electrodes: a needle microsensor for monitoring
glucose, The Analyst, 128(2003) 1382-5.
[15] Z. Chen, D. Liu, C. Zhu, L. Li, T. You, Facile Preparation
of Hemin-functionalized Electrochemically Reduced Graphene
Oxide Nanocomposite for H2O2 Biosensing, Sensors and
Materials, 31(2019) 1167.
[16] K. Yamamoto, G. Shi, T. Zhou, F. Xu, J. Xu, T. Kato, et
al., Study of carbon nanotubes–HRP modified electrode and its
application for novel on-line biosensors, The Analyst,
128(2003) 249-54.
[17] J. Wang, M. Musameh, A Reagentless Amperometric
Alcohol Biosensor Based on Carbon-Nanotube/Teflon
Composite Electrodes, Anal Lett, 36(2003) 2041-8.
[19] Biosensors: sensing elements and techniques.
[20] J. Bremer, Carnitine--metabolism and functions,
Physiological Reviews, 63(1983) 1420-80.
[21] C.J. Rebouche, Quantitative estimation of absorption
and degradation of a carnitine supplement by human adults,
Metabolism, 40(1991) 1305-10.
[22] R.-I. Stefan, R.G. Bokretsion, J.F. van Staden, H.Y.
Aboul-Enein, Biosensors for the Determination of
Ortho-acetyl-L-carnitine. Their Utilization as Detectors in a Sequential
Injection Analysis System, Preparative Biochemistry &
Biotechnology, 33(2003) 163-72.
[23] T. Sakurabayashi, S. Miyazaki, Y. Yuasa, S. Sakai, M.
Suzuki, S. Takahashi, et al., L-Carnitine Supplementation
Decreases the Left Ventricular Mass in Patients Undergoing
Hemodialysis, Circulation Journal, 72(2008) 926-31.
[24] A.V. Plioplys, S. Plioplys, Serum Levels of Carnitine in
Chronic
Fatigue
Syndrome:
Clinical
Correlates,
Neuropsychobiology, 32(1995) 132-8.
[25] F. Hörster, G.F. Hoffmann, Pathophysiology, diagnosis,
and treatment of methylmalonic aciduria—recent advances
and new challenges, Pediatric Nephrology, 19(2004) 1071-4.
and Deficit - When Supplementation is Necessary?, Current
Pharmaceutical Biotechnology, 4(2003) 211-9.
[27] P.E. Minkler, C.L. Hoppela, Determination of free
carnitine and ‘total’ carnitine in human urine: derivatization with
4'-bromophenacyl trifluoromethanesulfonate and high
performance liquid chromatography, Clin Chim Acta,
212(1992) 55-64.
[28] P.E. Minkler, C.L. Hoppel, Quantification of Free
Carnitine, Individual Short- and Medium-Chain Acylcarnitines,
and Total Carnitine in Plasma by High-Performance Liquid
Chromatography, Anal Biochem, 212(1993) 510-8.
[29] High-Performance Liquid Chromatography (HPLC).
[30] K. Heinig, J. Henion, Determination of carnitine and
acylcarnitines
in
biological
samples
by
capillary
electrophoresis–mass
spectrometry,
Journal
of
Chromatography B: Biomedical Sciences and Applications,
735(1999) 171-88.
[32] P. Andrieux, T. Kilinc, C. Perrin, E. Campos-Giménez,
Simultaneous determination of free carnitine and total choline
by liquid chromatography/mass spectrometry in infant formula
and health-care products: Single-laboratory validation, J
AOAC Int, 91(2008) 777-85.
[33] Liquid chromatography–mass spectrometry.
[34] J.D. McGarry, D.W. Foster, An improved and simplified
radioisotopic assay for the determination of free and esterified
carnitine, J Lipid Res, 17(1976) 277-81.
[35] M.S. Andrianova, E.V. Kuznetsov, V.P. Grudtsov, A.E.
Kuznetsov, CMOS-compatible biosensor for L-carnitine
detection, Biosens Bioelectron, 119(2018) 48-54.
[36] A. Ulman, Formation and Structure of Self-Assembled
Monolayers, Chem Rev, 96(1996) 1533-54.
[37] E.P. Achterberg, C. Braungardt, Stripping
voltammetry for the determination of trace metal speciation
and in-situ measurements of trace metal distributions in marine
waters, Anal Chim Acta, 400(1999) 381-97.
Chim Acta, 904(2016) 51-7.
[39] W. Fan, X. Wang, X. Li, F. Xue, Determination of
metallothionein in Daphnia magna by modified square wave
cathodic stripping voltammetry, Electrochem Commun,
52(2015) 17-20.
[40] D. Wang, N. Gan, J. Zhou, P. Xiong, Y. Cao, T. Li, et al.,
Signal
amplification
for
multianalyte
electrochemical
immunoassay with bidirectional stripping voltammetry using
metal-enriched polymer nanolabels, Sensors and Actuators B:
Chemical, 197(2014) 244-53.
Chapter 2. Au bulk electrode-based
carnitine biosensor
2.1 Introduction
Carnitine is a quaternary ammonium compound derived from amino
acids. It is mainly distributed in the digestive system, especially the liver,
and participates in the metabolism of fatty acids, and provides antioxidant
and anti-inflammatory effects. Carnitine is usually present in the
mitochondria of cells and it can help convert fatty acids into energy (such as ATP).[1] About 75% of the carnitine in the human body comes from our
diet, and the rest is synthesized in the liver by lysine and methionine in the
kidneys.[2] Carnitine can also transport any toxins produced to the
mitochondria to prevent the accumulation of toxins.[3] Salivary carnitine
content has been reported as strong evidence for confidence in assessing health status and pancreatic cancer biomarkers. The carnitine levels found
in cancer patients and healthy subjects are approximately 20 and 10 μM,
respectively.[4]
Carnitine has been detected using traditional analytical methods such
as high-performance liquid chromatography (HPLC)[5-10]. Capillary electrophoresis-mass spectrometry (CE-MS),[11, 12] HPLC-MS [13, 14]
and gas chromatography (GC)-MS [15, 16] have been adopted because of
time-consuming and cause high equipment costs. Radioactivity and
fluorescence measurements are also very accurate and reliable. However,
the processing of radioisotopes requires special facilities and sufficient
skills.[17-20] Although the fluorescence method combined with the
enzymatic reaction shows a lower detection limit, the enzymatic reaction product should have absorbance in the UV/VIS range and have a higher
fluorescence quantum yield.[21, 22]
Recently, by using complementary metal-oxide semiconductors
(CMOS) compatible with Ta2O5 sensitive surfaces, enzyme sensors based
on field-effect transistors (FET) have been developed.[23] In this method, carnitine acetyltransferase is immobilized on the surface of the FET, and
the author speculates that in the presence of coenzyme A (CoA), the
enzymatic reaction of carnitine may cause local pH changes on the surface
of the Ta2O5 gate. However, the performance (such as detection limit) of
FET-based carnitine sensors has not reached the level required for clinical applications. The above background indicates the need for an inexpensive
carnitine biosensor with high sensitivity and short analysis time. Cathodic
stripping voltammetry (CSV) has many advantages, such as high
sensitivity, high accuracy, and suitability for small-volume samples. Many
researchers have employed the CSV method to determine various
evaluating environmental contamination by using modified square wave
CSV,[25] a cancer biomarker by using stripping voltammetric
immunoassay (SVI) to amplify the signal,[26] and a cardiac marker by
using a CSV-based electrochemical enzyme immunoassay system.[27] In
the former study, the performance of the detection limit can reach the pg level, which indicates that CSV technology might be very suitable for the
determination of trace-level biomarkers.
In this work, the author developed a carnitine biosensor that combines
the CSV method and enzymatic reaction. In this study, carnitine
acetyltransferase converts carnitine and acetyl-coenzyme A (acetyl-coenzyme A) into acetyl-carnitine and (acetyl-coenzyme A (CoA). The CoA
produced by the enzymatic reaction is a thiol compound that can be
pre-concentrated on the surface of precious metals, including gold and silver.
CSV can detect this pre-concentrated thiol compound by electrochemical
methods with high sensitivity and low detection limit.[27] Although acetyl-CoA is also a thiol compound, the author found that CSV can selectively
detect CoA by using the different reduction potential between acetyl-CoA
and CoA. By optimizing parameters such as the amount of enzymes, low
detection limits below the μM level can be achieved, and CSV parameters
and methods have been successfully used to detect carnitine in artificial
2.2 Experimental section
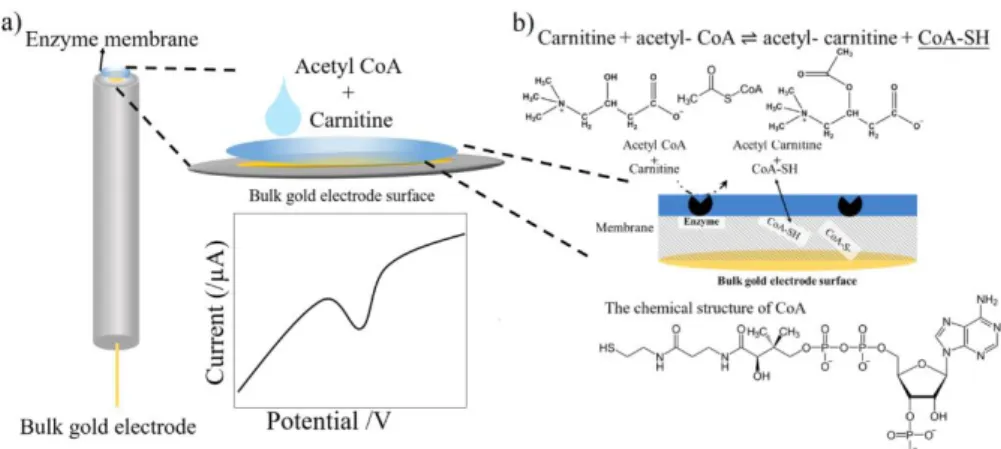
2.2.1 Diagram of device
Figure 2.1. Schematic diagram of carnitine biosensor
Figure 2.1 shows a schematic diagram of the developed carnitine
biosensor. The role of the BSA membrane with immobilized enzymes includes maintaining the activity of the enzyme and allowing carnitine and
acetyl-CoA to react almost completely before reaching the electrode
surface. When carnitine and acetyl-CoA react with the enzymes in the
membrane, CoA and acetyl carnitine are produced, and coenzyme A
2.2.2 Reagents and materials
Bovine serum albumin (BSA) was obtained from Jackson
ImmunoResearch Laboratories, Inc. (Pennsylvania, USA). Acetyl
coenzyme A lithium salt (acetyl-CoA, enzymatic ≥ 93%) and carnitine
acetyltransferase (40 unit/g) were purchased from Sigma-Aldrich (Tokyo, Japan). L-Carnitine was purchased from Fujifilm (Japan, Osaka).
Glutaraldehyde (G.A.) 50 % (5 mM) water solution was purchased from
KISHIDA CHEMICAL Co., Ltd. (Osaka, Japan). The artificial saliva used
for the recovery experiment was purchased from Teijin (Tokyo, Japan), and
composition is 14.44 μM NaCl, 16.11 KCl, 0.99 μM CaCl2·2H2O2, 0.55
μM MgCl2, and 1.96 μM K2HPO3. Glucose, creatine, and urea were used
as the interfering factors spiked in the artificial saliva for the selectivity
studies, and glucose and creatine were purchased from Sigma-Aldrich
(Tokyo, Japan) and urea was purchased Fujifilm (Japan, Osaka),
respectively. The following buffer solutions were used: 0.1 M acetic acid buffer was used as the acetyl-CoA buffer. 0.1 M PB buffer (pH = 7.9) was
2.2.3 Apparatus
An electrochemical analyzer (ALS model 720E BAS Co. Ltd., Tokyo,
Japan) was used for the electrochemical measurements including CSV. A
gold electrode (d = -1.6 mm BAS Co. Ltd., Tokyo, Japan), Ag/AgCl (RE-3V BAS Co. Ltd., Tokyo, Japan) and Pt wire were used as working,
reference and counter electrodes, respectively. The electrolyte solutions
(0.5 M KOH) were deoxygenated by purging them with pure Ar gas for 20
2.2.4 Enzyme immobilization
First, the author prepared the BSA and enzyme solutions separately.
The range of BSA concentrations are between 0.6 and 1.8 μM, and the enzyme concentrations are ranged between 1 * 104 to 5 * 104 unit/g. Then
after mixing the final concentrations of enzyme and BSA were ranged from
0.5 * 104 to 2.5 * 104 unit/g, and 0.3 to 0.9 μM, respectively. The same
volumes of enzyme-BSA solutions were then mixed with different
concentrations of GA solutions. The concentrations of GA solutions were
ranged from 0.4 to 1.5 %, and the final concentrations were from 40 to 150 μM. After the mixing completed, 4 μL of the enzyme-BSA-GA solution
was cast onto the gold electrode. The electrode was ready for experiments
2.2.5 Linear-sweep cathodic stripping
voltammetry analysis
Linear-sweep cathodic stripping voltammetry (LSCSV) was
performed with an enzyme-modified gold bulk electrode. Before the
LSCSV measurement, the author prepared a 20 μL solution containing 500
nM carnitine and 500 nM acetyl-CoA and incubated it with the enzyme-modified electrode for 30 min. Then, the electrode was rinsed with
deionized water. After rinsing, the electrode was immersed in a 0.5 M KOH
solution for an LSCSV measurement. The working electrode potential was
scanned from -0.8 to -1.4 V at a scan rate of 0.05 V/s to observe the
2.3 Results and Discussion
2.3.1 Electrochemical behavior of CoA and acetyl-CoA
on a bulk gold electrode
Since CoA has a thiol group that can be adsorbed on the Au surface,
acetyl-CoA has a thioester structure, which seems difficult to adsorbed on
the gold surface. However, previous literature reported that similar groups
could strongly adsorb gold particles.[28, 29] Another literature also
reported that chemicals with thioester groups could be electrochemically reduced on the electrode.[30] Therefore, it is essential to study the
electrochemical reduction behavior of CoA and acetyl-CoA on Au bare
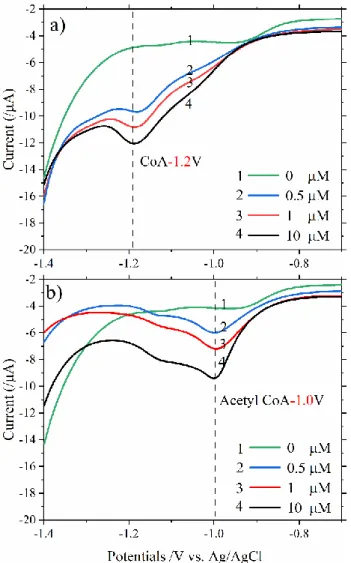
electrodes. Figure 2.2 shows the LSCSV curves of CoA and acetyl CoA at
different concentrations from 500 nM to 10 μM. The reduction peaks of
CoA and acetyl CoA were observed at -1.2 and -1.0 V, respectively.
In Fig. 2.2, no response was observed without CoA and acetyl-CoA,
suggesting no interference from the chemicals used for buffer solutions.
The reduction peak of CoA was about 200 mV lower than that of acetyl-CoA. These results indicated that CoA could be detected selectively against
acetyl-CoA thanks to the different reduction potentials of acetyl-CoA and CoA, although both CoA and acetyl-CoA adsorb on the gold electrode. The
currents from 0 to 1 M for both CoA and acetyl-CoA exhibited increases
small when the high concentration is taken into account, suggesting that
the adsorption on the flat Au electrode surface saturates. This indicates that
a quantitative evaluation of CoA could be possible for a lower CoA
concentration range.
Figure 2.2. LSCSV curves of different CoA and acetyl-CoA concentrations with
2.3.2 Optimization of enzyme membrane compositions of
modified-gold bulk electrode
To achieve high sensitivity, the author optimized the composition of
the enzyme membrane, as shown in Figure 2.3. Before the optimization study, the author checked the response of the buffer and different modified
materials on the bare gold electrode. However, no response was observed
at bare Au electrode after modifying membrane materials including BSA,
GA, BSA+GA BSA+GA+enzyme. Figure 2.3(a) shows the relationship
between the BSA concentration and the LSCSV curve, where the concentration of enzyme and GA are fixed at 4 % (or 1.0 * 104 U/g) and
0.5 %, respectively. A prominent peak of CoA was observed with 0 % BSA.
However, a more pronounced acetyl-CoA peak was also observed. If the
electrode is used continuously, the direct cross-linking of the enzyme and
GA will reduce the enzyme activity.
When the BSA concentration was increased, the CoA peak was still
clearly observed up to a BSA concentration of 1 %. However, the CoA peak
decreased with a further increase in BSA concentration. This might be
because the enzyme film is too thick, or some parts of the BSA and enzyme
were dissolved in the solution due to insufficient GA. In contrast, when the
CoA reduction peak was significantly suppressed. This result indicates that
acetyl-CoA diffusion to the Au surface can be inhibited by consuming
acetyl-CoA in the enzyme membrane. Therefore, the concentration of BSA
was fixed to 1 % for further experiments. Figure 2.3(b) shows the change
of the LSCSV curve when the enzyme concentration changes. When the fixed BSA and GA concentrations are 1 and 0.5 %, respectively, the
enzyme concentration range is 2 % to 10 % (the final concentration range
is 0.5 * 104 to 2.5 * 104 U/g). Both acetyl-CoA and CoA peaks were
observed when the enzyme concentration was below 4 %, but the CoA peak
was slightly smaller than those at higher enzyme concentrations of 8 and 10 %. The acetyl-CoA peak disappeared at a higher enzyme concentration,
indicating that the enzymatic reaction is a rate determined step when the
enzyme concentration is lower than 4 %. This also indicates that the
acetyl-CoA diffused into the enzyme membrane is mainly consumed by the
enzyme reaction before reaching the Au electrode surface, thereby enhancing the selective adsorption of CoA on the electrode surface.
Therefore, the author chose an enzyme concentration of 10% to achieve a
complete enzymatic reaction. Figure 2.3(c) shows the change of the
LSCSV curve as the GA concentration increases. The concentration of
BSA and enzyme were 1 % and 10 %, respectively, and the concentration
could be observed when the GA concentrations were 0.5 or 0.6 %,
suggesting that the GA concentration was sufficient to immobilize the
enzyme in the membrane. However, when the GA concentration further
increased to 0.75 %, the acetyl-CoA peak appeared again, suggesting that
the enzymatic reaction rate was reduced as a result of the deactivation of the enzyme by GA. Therefore, the mild crosslink reaction condition of the
0.5 % GA concentration was selected to maintain enzyme activity and high
sensitivity.
As summarized above, the author have optimized an enzyme
membrane composition consisting of 1 % BSA, 10 % (or 2.5 * 104 U/g)
enzyme, and 0.5 % glutaraldehyde.
Figure 2.3. Optimization of BSA, enzyme, and glutaraldehyde (GA)
2.3.3 Optimization of enzyme membrane position on a
gold bulk electrode
To achieve high sensitivity, the amount of enzymatically produced
CoA diffused to the surface of the Au electrode is very important. Therefore, the author studied the dependence of the position of the enzyme membrane
on the coenzyme A reduction peak produced by the enzymatic reaction of
carnitine and acetyl-CoA. Figure 2.4 shows the LSCSV results of the
enzyme membrane composition, composed of 1 % BSA, 0.5 % GA, and
10 % (or 2.5 * 104 U/g) carnitine acetyltransferase. The enzyme membrane
was modified by surrounding the Au electrode with a membrane or directly
on the electrode. When the enzyme membrane surrounds the Au electrode,
reduction peaks are observed at -1.25 and -1.04 V, which belong to CoA
and acetyl-CoA, respectively. However, the reduction peak of CoA is
significantly smaller than the peak of acetyl-CoA, indicating that the enzyme membrane position is inappropriate. This might be because the
diffusion distance of the produced CoA greatly exceeds the diffusion
distance of the acetyl CoA already existing near the surface of the Au
electrode. Due to the long diffusion distance to the Au electrode surface,
some parts of the generated CoA might diffuse into the bulk solution. In
enzyme membrane was directly modified on the Au electrode surface. This
indicates that most of the acetyl-CoA molecules diffused into the enzyme
membrane might be converted into CoA before reaching the surface of the
Au electrode, thereby increasing the sensitivity and selectivity of carnitine.
Based on the above results, the author directly modified the enzyme membrane on the Au electrode to evaluate the sensitivity and detection
limit.
Figure 2.4. Comparison of modified enzyme membrane positions for carnitine
2.3.4 Carnitine calibration curves
Figure 2.5. Relationship between CoA reduction current and carnitine
concentration.
The relationship between the CoA reduction current and the carnitine
concentration was obtained, as shown in Fig. 2.5. The obtained linear range
for carnitine from 0.025 to 25 μM where the linear regression equation is
Y(-10-7C) = 0.2638x + 1.3871 (R2 = 0.9484). However, the peak current
was almost saturated when the carnitine concentration exceeded 25 μM,
which might be due to the limit of the enzyme reaction or the saturation of
the CoA adsorption. In the latter case, the calibration curve could be
obtained in a higher concentration region by reducing the incubation time
for the enzymatic reaction.
than the previously reported values (Table 2.1). Our sensor requires a much
lower equipment cost with an acceptable detection time. The employment
of mass reproducible working electrodes such as Au film electrodes or
carbon electrodes modified or embedded with Au nanoparticles that
previously reported might greatly reduce the chip cost.[31] Although the FET sensor is also inexpensive and offers a shorter detection time, our
sensor is more advantageous in that it has a detection limit that is about one
Table 2.1. Comparison of analytic performance of different carnitine
determination methods.
Method Performance
(LOD)
Linear range Detection time (min) Reaction volume Cost HPLC[10] 1μM 5-400 (μM) 60 100 μL High CE-MS [11] 1.8 μg/ml 1.8-30 (μg/ml) 45 2 mL High LC-MS [14] 0.1 μM 0.1-1000 (μM) 10 20 μL High Radio-assay [20] 0.11μM 0.11-15 (μM) 85 0.9 mL High FET-biosensor [23] 0.2 μM 0.2-100 (μM) 10 2 μL Relatively low
2.3.5 Selectivity of carnitine biosensor
Figure 2.6. Selectivity studies with possible interferents.
For selectivity study, three interfering factors in saliva were spiked in artificial saliva, namely glucose, urea, and creatine. In the artificial saliva,
the creatine, glucose, and urea concentrations were less than 1, 50 and 100
μM, respectively. The CoA signal is 4.5 times higher than those of creatine
and glucose, and 3 times higher than that of urea (Fig. 2.6). Therefore, the
results indicated that our biosensor could achieve high selectivity for real
2.3.6 Recovery tests of spiked samples with carnitine in
artificial saliva
Recovery test results for carnitine spiked in artificial saliva under an
optimized carnitine biosensor are shown in Table 2.2. The calculated recovery values for artificial saliva samples were between 97.17 and 96.55 %
with RSDs as low as 5.58 %. The results showed that our biosensor device
is capable of highly sensitive and highly selective carnitine determination
in saliva.
Table 2.2. Recovery of carnitine in artificial saliva samples (n=3)
2.4 Conclusion
The author developed a highly sensitive carnitine biosensor based on
an enzyme-modified Au electrode combined with CSV measurement. The
sensor can quantitatively detect carnitine by detecting CoA generated by the reaction of carnitine and acetyl-CoA generated by the enzymatic
reaction of carnitine acetyltransferase. Although the CoA and acetyl-CoA
could adsorb on the gold surface, the selective detection of CoA could be
achieved thanks to their different desorption potentials and the
optimization of the enzyme membrane composition, which realized the
complete consumption of the acetyl-CoA diffused in the enzyme membrane. A detection limit of 0.025 µM and a linear detection range from
0.025 to 25 µM were obtained due to the accumulation of CoA on the Au
electrode surface. The sensor also exhibited a good recovery of carnitine in
artificial saliva sample. However, the Au bulk electrode is expensive and
2.5 References
[1] J. Bremer, Carnitine--metabolism and functions,
Physiological Reviews, 63(1983) 1420-80.
[2] C.J. Rebouche, Quantitative estimation of absorption
and degradation of a carnitine supplement by human adults,
Metabolism, 40(1991) 1305-10.
[3] R.-I. Stefan, R.G. Bokretsion, J.F. van Staden, H.Y.
Aboul-Enein, Simultaneous determination of L- and
D-carnitine using a sequential injection analysis/amperometric
biosensors system, J Pharm Biomed Anal, 33(2003) 323-8.
[4] M. Sugimoto, D.T. Wong, A. Hirayama, T. Soga, M.
Tomita, Capillary electrophoresis mass spectrometry-based
saliva metabolomics identified oral, breast and pancreatic
cancer-specific profiles, Metabolomics, 6(2010) 78-95.
[5] P.E. Minkler, C.L. Hoppela, Determination of free
carnitine and ‘total’ carnitine in human urine: derivatization with
4'-bromophenacyl trifluoromethanesulfonate and high
performance liquid chromatography, Clin Chim Acta,
212(1992) 55-64.
Chromatography, Anal Biochem, 212(1993) 510-8.
[7] M. Kagawa, Y. Machida, H. Nishi, J. Haginaka, Direct
Enantiomeric Purity Determination of Acetyl-L-carnitine by LC
with
a
Ligand-Exchange
Chiral
Stationary
Phase,
Chromatographia, 62(2005) 239-44.
[8] K. Li, W. Li, Y. Huang, Determination of free l-carnitine
in human seminal plasma by high performance liquid
chromatography with pre-column ultraviolet derivatization
and its clinical application in male infertility, Clin Chim Acta,
378(2007) 159-63.
[9] P.E. Minkler, S.T. Ingalls, C.L. Hoppel, Strategy for the
Isolation, Derivatization, Chromatographic Separation, and
Detection of Carnitine and Acylcarnitines, Anal Chem, 77(2005)
1448-57.
[10] K. Li, Q. Sun, Simultaneous Determination of Free and
Total Carnitine in Human Serum by HPLC with UV Detection, J
Chromatogr Sci, 48(2010) 371-4.
[12] L. Sánchez-Hernández, M. Castro-Puyana, C.
García-Ruiz, A.L. Crego, M.L. Marina, Determination of l- and
d-carnitine in dietary food supplements using capillary
electrophoresis–tandem mass spectrometry, Food Chem,
120(2010) 921-8.
[13] P. Andrieux, T. Kilinc, C. Perrin, E. Campos-Giménez,
Simultaneous determination of free carnitine and total choline
by liquid chromatography/mass spectrometry in infant formula
and health-care products: Single-laboratory validation, J
AOAC Int, 91(2008) 777-85.
[14] C.S. Ho, B.S.S. Cheng, C.W.K. Lam, Rapid Liquid
Chromatography–Electrospray Tandem Mass Spectrometry
Method for Serum Free and Total Carnitine, Clin Chem,
49(2003) 1189.
[15] L.M. Lewin, A. Peshin, B. Sklarz, A gas
chromatographic assay for carnitine, Anal Biochem, 68(1975)
531-6.
[16] C. Costa, E. Struys, A. Bootsma, H. Brink, I. Almeida,
M. Duran, et al., Quantitative analysis of plasma acylcarnitines
using gas chromatography chemical ionization mass
fragmentography, J Lipid Res, 38(1997) 173-82.
determination of carnitine in the picomole range, Clin Chim
Acta, 37(1972) 235-43.
[18] J.D. McGarry, D.W. Foster, An improved and simplified
radioisotopic assay for the determination of free and esterified
carnitine, J Lipid Res, 17(1976) 277-81.
[19] P.R. Borum, Carnitine: determination of total carnitine
using a radioenzymatic assay, Journal of Nutritional
Biochemistry, 1(1990) 111-4.
[20] K.-G. Seline, H. Johein, The determination of
l-carnitine in several food samples, Food Chem, 105(2007)
793-804.
[21] L. Wan, R.W. Hubbard, Determination of free and
total carnitine with a random-access chemistry analyzer, Clin
Chem, 44(1998) 810.
[22] H. Kerspern, J.-L. Carré, Adaptation of free and total
plasma carnitine determination on the Dimension® HM,
X-Pand model (Dade Behring), Annales de biologie clinique,
66(2008) 207-11.
[23] M.S. Andrianova, E.V. Kuznetsov, V.P. Grudtsov, A.E.
Kuznetsov, CMOS-compatible biosensor for L-carnitine
detection, Biosens Bioelectron, 119(2018) 48-54.
Nanogold-penetrated poly(amidoamine) dendrimer for
enzyme-free electrochemical immunoassay of cardiac
biomarker using cathodic stripping voltammetric method, Anal
Chim Acta, 904(2016) 51-7.
[25] W. Fan, X. Wang, X. Li, F. Xue, Determination of
metallothionein in Daphnia magna by modified square wave
cathodic stripping voltammetry, Electrochem Commun,
52(2015) 17-20.
[26] D. Wang, N. Gan, J. Zhou, P. Xiong, Y. Cao, T. Li, et al.,
Signal
amplification
for
multianalyte
electrochemical
immunoassay with bidirectional stripping voltammetry using
metal-enriched polymer nanolabels, Sensors and Actuators B:
Chemical, 197(2014) 244-53.
[27] H. Matsuura, Y. Sato, O. Niwa, F. Mizutani,
Electrochemical Enzyme Immunoassay of a Peptide Hormone
at Picomolar Levels, Anal Chem, 77(2005) 4235-40.
[28] A. Yamada, Q. Feng, Q. Zhou, A. Hoskins, K.M. Lewis,
B.D. Dunietz, Conductance of Junctions with
Acetyl-Functionalized Thiols: A First-Principles-Based Analysis, The
Journal of Physical Chemistry C, 121(2017) 10298-304.
Homogeneous Catalysis, Chemistry, 24(2018) 18779-87.
[30] M. Weïwer, S. Olivero, E. Duñach, Product selectivity
in the electroreduction of thioesters, Tetrahedron, 61(2005)
1709-14.
Chapter 3. the study of sputtered carbon film
for gold nanoparticle-based biosensor
3.1 Introduction
In this chapter, the film electrode for detecting carnitine is studied to
improve the performance of the carnitine biosensor. The film electrode is
also important to apply for commercial biosensor which requires
mass-production and low const. The carbon film electrode was selected as a base
electrode because it is stable and low noise. Then, the authormodified the Au nanoparticles on the carbon film electrode to preconcentrate CoA
generated by the enzymatic reaction of carnitine and acetyl-CoA. In the
Introduction section, the author first introduced about carbon film electrode
and then metal nanoparticles modified film electrodes.
3.1.1 Carbon film
Carbon films are widely employed in electrochemical analysis
because they are mass-producible and can be fabricated with any shape and
size.[1] Carbon films fabricated by the pyrolysis of organic (or polymeric)
films can have a similar structure to that of glassy carbon,[2-5] which
exhibits good electrochemical activity. However, the films are often porous and require the substrates to be used at very high temperature. In contrast,
magnetron sputtering,[6-8] radio frequency (RF) magnetron sputtering,[9,
10] electron cyclotron resonance (ECR) sputtering,[11, 12] electron beam
evaporation,[13] and a filtered cathodic vacuum arc (FCVA) system,[14]
produce flat but more amorphous structures similar to diamond-like carbon
(DLC), which reduces electrochemical activity.
Ferrari et al. published a ternary phase diagram of amorphous carbons,
which clearly shows the relationships between DLC structures and
hydrogen, sp2 and sp3 carbons.[15] However, the diagram does not include
high-order structural features such as degree of crystallinity, which is
strongly related to electrochemical activity. Hirono et al. reported nanocarbon films formed by electron cyclotron resonance (ECR)
sputtering.[11] The films contain a nano-graphene structure, which
decreases with increasing sp3 concentration. In contrast, ECR nanocarbon
films with higher sp3 concentrations have excellent electrochemical
properties such as sufficient electrochemical activity, lower noise, and a wider potential window, as our group reported previously.[16, 17]
Kamata et al. subsequently reported similar carbon films prepared
with unbalanced magnetron (UBM) sputtering.[18] The sp2 and sp3 ratios
could be well controlled by the different subtracted bias voltage between
the target and substrate. More recently, Diao et al. reported carbon films
of ion irradiation.[12, 19] The films have rougher surfaces than previously
reported ECR nanocarbon films but exhibit better electrochemical activity.
However, such equipment is not widely used and the cost is very high. In
contrast, DC magnetron sputtering equipment has been commonly used to
fabricate conducting films including carbon. Freire et al., Broitman et al., and Zeng et al. reported a DLC carbon film prepared with a DC magnetron
sputtering method, and the amorphous carbon structure realized
electrochemical stability, a lower capacitive current and a smaller surface
area.[6-8] Although the sputtered carbon film electrodes show excellent
electrochemical characteristics as described above, the film electrodes were required to have improved electrochemical activity for applying to
carnitine biosensor because thiol compound cannot be preconcentrated
onto the carbon electrode.
3.1.2 Metal nanoparticle modified carbon film electrode
Metal electrodes have excellent electrochemical activity, and are widely employed in the electrochemical analysis of heavy metals and
thiol-containing biomolecules. Although the metal electrode has the
characteristics mentioned above, its application in biosensing technology
is limited. Because the biosensing technology required an electrode with
not only high sensitivity but low background current, which is necessary
employed to modify on carbon film electrodes to improve the
electrochemical activity of carbon film electrodes with maintaining low
noise level. This is because limited surface area of the NPs suppresses the
increase in background current since carbon surface shows low noise level.
The sensitivity can be controlled by changing the amount of NPs modified on the carbon electrode. Various metal nanoparticles embedded (or
modified) carbon film electrodes were employed for electroanalysis,
including PtNPs embedded carbon film electrode applied in H2O2, glucose,
acetylcholine and geosmin detection,[20, 21] PdNPs deposited carbon
electrode applied in NO2 detection,[22] NiNPs embedded carbon film
electrodes applied in sugar detection,[23] CuNPs embedded carbon film
electrode applied in glucose detection in alkaline solution,[24] AuNPs
embedded and deposited carbon film electrodes applied in As3+, glucose
and neuraminidase detection.[25-27] In the study of Wahyuni et al., the
performance could be achieved as ng/mL level by using voltammetry measurement.[27] This result indicated that the AuNPs-based carbon film
electrode could achieve a biosensor with trace level determination.
In this chapter, the author studied the structure and basic
electrochemical properties of DC magnetron-sputtered carbon films
prepared with different sputtering power, and then the carbon film surface
The author expects the application of sputtering power to allow us to
control such aspects of the film structure as sp3 concentration and improve
the ordering of the film thus realizing better electrochemical activity. The
author characterized the surface structure of DC-sputtered carbon films
using X-ray photoelectron spectroscopy (XPS) and transmission electron microscopy (TEM). The basic electrochemical properties were studied and
compared with those of UBM-sputtered carbon films by measuring the
cyclic voltammetry of several redox species with different electron-transfer
properties. The effect of surface functional groups on the electrochemical
properties was also studied by employing DC sputtered carbon films deposited under different conditions. This is because the content of surface
functional groups can affect the electron transfer kinetics of organic
biochemicals.[28] The deposition process of AuNPs on the DC carbon film
was optimized, and the CV method was employed to evaluate the amount
of deposited AuNPs. The performance of AuNPs-based biosensor was evaluated by CSV method. A low detection limit with the μM level was
achieved by optimizing AuNPs deposition process parameters such as the
3.2 Experimental section
3.2.1 Reagents and materials
All of the chemicals employed in this study were of analytical grade
and used as received without further purification. Hexaamimineruthenium
(III) chloride [Ru(NH3)6]Cl3 and dopamine hydrochloride were purchased
from Sigma-Aldrich (Tokyo, Japan). Potassium chloride (KCl), iron (II)
chloride tetrahydrate (FeCl2· 4H2O), and potassium hexacyanoferrate (III)
(K3[Fe(CN)6]) were purchased from Wako Pure Chemical Industries
(Tokyo, Japan). The glassy carbon electrode (GC) was purchased from
BAS (Tokyo, Japan).
The gold standard solution (1000 ppm HAuCl4) was purchased from
Wako (Tokyo, Japan.), Bovine serum albumin (BSA) was obtained from Jackson ImmunoResearch Laboratories, Inc. (Pennsylvania, USA). Acetyl
coenzyme A lithium salt (acetyl-CoA, enzymatic ≥ 93%) and carnitine
acetyltransferase (40 unit/g) were purchased from Sigma-Aldrich (Tokyo,
Japan). L-Carnitine was purchased from Fujifilm (Japan, Osaka).
Glutaraldehyde (G.A.) 50 % (5 mM) water solution was purchased from KISHIDA CHEMICAL Co., Ltd. (Osaka, Japan). The artificial saliva used
for the recovery experiment and selectivity study was purchased from
μM CaCl2·2H2O2, 0.55 μM MgCl2, and 1.96 μM K2HPO3. Glucose,
creatine, and urea were used as the interfering factors spiked in the artificial
saliva for the selectivity studies, and glucose and creatine were purchased
from Sigma-Aldrich (Tokyo, Japan) and urea was purchased Fujifilm
(Japan, Osaka), respectively. The following buffer solutions were used: 0.1 M acetic acid buffer was used as the acetyl-CoA buffer. 0.1 M PB buffer
(pH = 7.9) was used as the carnitine buffer, and the final pH of mixing
3.2.2 Carbon film preparation
The carbon films were deposited on highly doped silicon (100)
substrates with DC magnetron sputtering equipment at room temperature.
The Ar gas pressure was 2.5 × 10⁻¹ Pa. The substrate temperature was
200 °C, and the voltage and current of the target were 640 V and 0.68 A,
respectively. The powers of target bias were 0, 12, 20, 30, and 35 W
(namely, the target biases were 0, -130, -230, -300, and -350 V). The DC
3.2.3 Gold nanoparticles electrodeposition
The DC magnetron sputtered carbon film cut into a rectangular shape
and the insulating tape with a 2-mm-diameter hole attached the film
electrode in order to define the electrode surface area (0.0134 cm2). The
gold standard solution (1000 ppm HAuCl4) was diluted 10-fold with 0.1 M
H2SO4 for the further electrodeposition of AuNPs. The final solution of
AuCl4- consists of 100 ppm AuCl4-, 0.1 M HCl, and 0.09 M H2SO4. The
prepared carbon film electrode immersed in the 100 ppm AuCl4- solute on,
and applied the potentials of -0.15 V to the DC-magnetron sputtered carbon film for 240 s. After washing the electrode surface with pure water, the
electrode was transferred into the 1.0 M H2SO4 solution for
electrochemical cleaning by applied the potential scans from 0.1 V to 1.5
3.2.4 Carbon film characterization
The surface properties of the DC carbon films were characterized by
X-ray photoelectron spectroscopy (XPS, ESCA Quantum 200, Ulvac-phi
Co., Japan) using Al Kα monochromatic X-rays (1486.6 eV) to determine the elemental composition and the quantity of chemical bonds in the carbon
film electrode surfaces. The surface structure of the DC carbon films and
UBM nano film were characterized by a high-resolution transmission
electron microscopy (TEM, Tecnai Osiris, FEI Co., Japan) with a
3.2.5 Electrochemical measurements of pure carbon
films
Cyclic voltammograms (CVs) were obtained with an electrochemical
analyzer (ALS model 720E BAS Co. Ltd., Tokyo, Japan) using a three-electrode system. DC carbon films, Ag/AgCl (RE-3 V BAS Co. Ltd.,
Tokyo Japan) and Pt wire were used as working, reference and counter
electrodes, respectively. The electrolyte solutions in this study were
deoxygenated by purging them with pure Ar gas for 20 mins before
3.2.6 Cathodic stripping voltammetry analysis
Square-wave cathodic stripping voltammetry (SWCSV) was
performed with an enzyme-modified AuNPs-deposited carbon film
electrode. Before the SWCSV measurement, the author prepared a 20 μL
solution containing 500 nM carnitine and 500 nM acetyl-CoA and incubated it with the enzyme-modified electrode for 30 min. Then, the
electrode was rinsed with deionized water. After rinsing, the electrode was
immersed in a 0.5 M KOH solution for an SWCSV measurement. The
measurements consisted of two steps: (i) 60s deposition at -0.8 V vs
Ag/AgCl to preconcentrate CoA-SH. (ii) The working electrode was cathodic stripped from 0 to -1.8 V (vs. Ag/AgCl) by employing a frequency
3.3 Results and Discussion
3.3.1 Surface characterizations of DC sputter deposited
carbon films
The author prepared DC magnetron sputtered carbon films under
different conditions by changing the power of the target bias (0, 12, 20, 30,
and 35 W). The carbon films were characterized by using XPS and TEM
measurements. Figure 3.1 compares the C 1s TEM spectra of DC carbon
films formed with different target powers (0, 12, and 30 W) and UBM carbon film formed at -20 V.
As shown in Fig. 3.S1(B), the C 1s XPS spectra were fitted into two
peaks by using Shirley`s method as the author reported previously.[16, 18]
The peaks that appeared at 284.5, and 285.5 eV were assigned to sp2 and
sp3 hybrids, respectively. And GC consists of sp2 bonds,and approximately
without sp3 bonds, thus the sp3/sp3+sp2 ratio of GC is 0 %.[29] The
sp3/sp3+sp2 ratio obtained from the C 1s XPS spectrum and the content of
oxygen-containing functional groups obtained from the O 1s XPS
spectrum are summarized in Table 3.1. The sp3 ratio increased as the bias
power increased from 0 bias to 12 W, and then the ratio gradually decreased as the bias was further increased from 12 to 35 W. The sp3 content of DC
carbon film is insufficient compared with that of UBM carbon film,

![Figure 1.6 the schematic diagram of HPLC.[29]](https://thumb-ap.123doks.com/thumbv2/123deta/10124384.1958354/12.893.150.751.128.461/figure-the-schematic-diagram-of-hplc.webp)
![Figure 1.10 Schematic diagram of LC-MS.[33]](https://thumb-ap.123doks.com/thumbv2/123deta/10124384.1958354/15.893.162.733.188.445/figure-schematic-diagram-of-lc-ms.webp)
![Figure 1.12 The schematic diagram of ISFET carnitine biosensor[35]](https://thumb-ap.123doks.com/thumbv2/123deta/10124384.1958354/18.893.135.754.136.417/figure-schematic-diagram-isfet-carnitine-biosensor.webp)